Optical nonlinearity in Ar and N2 near the ionization threshold
Abstract
We directly measure the nonlinear optical response in argon and nitrogen in a thin gas target to laser intensities near the ionization threshold. No instantaneous negative nonlinear refractive index is observed, nor is saturation, in contrast with a previous measurement [Loriot et al., Opt. Express 17, 13429 (2009)] and calculations [Brée et al., Phys. Rev. Lett. 106, 183902 (2011)]. In addition, we are able to cleanly separate the instantaneous and rotational components of the nonlinear response in nitrogen. In both Ar and N2, the peak instantaneous index response scales linearly with the laser intensity until the point of ionization, whereupon the response turns abruptly negative and constant, consistent with plasma generation.
The optical Kerr effect, the intensity-dependent refractive index experienced by an optical pulse in a transparent medium, plays an important role in phenomena from nonlinear propagation in optical fibers agrawal_nonlinear_2006 to mode-locking in pulsed lasers haus_mode-locking_2000 to filamentary propagation in condensed media and the atmosphere couairon_femtosecond_2007 . A recent transient birefringence measurement in the components of air reported by Loriot et al. loriot_measurement_2009 purported to show that the optical Kerr effect saturates and then becomes negative for intensities greater than 26 TW/cm2. A strong higher-order Kerr effect, with a crossover from positive to negative nonlinear index at intensities well below the ionization threshold, would have a huge impact on the nonlinear optics of transparent media, and has inspired theoretical works predicting plasma-free light filamentation bejot_higher-order_2010 and exotic new effects in light propagation novoa_fermionic_2010 . It would overturn the picture most have of the mechanism behind long-range filamentary propagation of intense ultrashort pulses – as arising from an interplay between self-focusing due to the positive optical nonlinearity from bound electrons and defocusing due to the plasma generated by ionization. The existence of a higher-order Kerr effect would also have implications for the general nonlinear susceptibility in transparent media ettoumi_generalized_2010 ; kasparian_arbitrary-order_2010 , including harmonic generation Kolesik et al. (2010b); B?jot et al. (2011); ariunbold_2011 .
Subsequent experimental studies of light filaments chen_direct_2010 ; Kosareva et al. (2011); Polynkin et al. (2011); kolesik_higher-order_2010 have not supported the higher-order Kerr model, with one exception bejot_transition_2011 . One measurement chen_direct_2010 found that the electron density was two orders of magnitude higher than predicted by a calculation including higher-order nonlinearities, but agreed with a simulation based on plasma defocusing alone bejot_higher-order_2010 . A physical mechanism for the saturation and negative response was proposed based on the nonlinear response near the threshold of ionization Teleki et al. (2010); Brée et al. (2011). What is missing from this debate is a direct measurement of the nonlinearity that corroborates or refutes the intensity dependence observed by Loriot et al. Here, we describe such a measurement in Ar and N2 using spectral interferometry. We find no saturation and no negative instantaneous nonlinear phase, in contrast to the original experiment loriot_measurement_2009 .
The technique we use, single-shot supercontinuum spectral interferometry Kim et al. (2002a), provides a single-shot measurement of the transverse space- and time-dependent phase shift of a chirped probe pulse due to a transient nonlinearity induced by a short pump pulse. The time resolution is given by the probe bandwidth (in this experiment 15 fs) and the transverse spatial resolution here is 3 m. Loriot et al. used a non-spatially resolved multi-shot technique limited in time resolution by the probe duration of 90 fs loriot_measurement_2009 . They measured the transient birefringence and inferred the higher-order Kerr coefficients from the tensorial symmetry of the nonlinear susceptibilities , , etc. loriot_measurement_2009 ; Stegeman et al. (2011). In contrast, we can measure parallel and perpendicular components of the nonlinear response independently. Previously, supercontinuum spectral interferometry was used with 110 fs pump pulses to study the nonlinear response of air consituents Chen et al. (2007a), and no sign reversal of the nonlinear index was observed up to intensities where ionization occurs. However, the use of a gas cell complicates the interpretation of the experiment when the response is highly nonlinear Kim et al. (2002b). Also, at the high pressures used ( atm) plasma-induced refraction limits the peak intensity. Here, we measure the nonlinear response of Ar and N2 using a 38 fs pump pulse and a 2 mm thick gas target.
Figure 1 shows the experimental setup and data. Detailed descriptions of the experimental technique have been given previously Kim et al. (2002a); Chen et al. (2007a). The laser is a 1 kHz repetition rate Ti:sapphire amplifier producing 38 fs full width at half maximum (FWHM), 3.5 mJ pulses centered at 800 nm. Roughly 700 J of the laser output is used to generate supercontinuum covering 640-720 nm in a gas cell (not shown) filled with 1-2 atm of Ar; the fundamental is rejected using a dichroic mirror. The supercontinuum is linearly polarized. Probe and reference pulses, separated by 1.4 ps, are generated using a Michelson interferometer and chirped so that the group delay dispersion is 1950 fs2, and then the beam is spatially filtered with a 100 m pinhole. The pump power is attenuated using a waveplate and thin film polarizers so that the pulse energy is continuously adjustable from 5-100 J. The pump beam is then expanded with a telescope, and a waveplate allows rotation of the pump polarization. The pump and supercontinuum are combined using a dichroic mirror; at this point the pump beam is about 5 times wider than the probe/reference beam so that the probe spot overfills the pump spot in the interaction region.
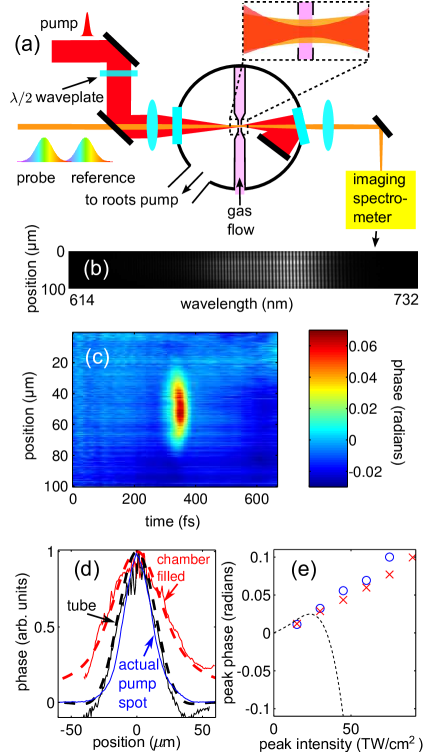
A well-defined interaction length, ideally comparable to or shorter than the Rayleigh range of the pump beam, minimizes spatial and temporal distortions due to axial variation in the pump intensity Kim et al. (2002b). To achieve this, we use a thin gas target inside a vacuum chamber, shown in Fig. 1a. The beams are focused using a lens of focal length 40 cm, and enter the vacuum chamber through a 5 mm thick fused silica window, propagating 30 cm through vacuum to the target. The pump beam waist, measured by imaging the focus onto a CCD camera, is 22 m FWHM. The target is a copper gas flow tube with a flattened section through which a 120 m diameter hole was laser drilled to allow the pump and probe to pass through. The space between the inner tube walls is 1 mm, with a wall thickness of 0.5 mm. A roots pump keeps the background pressure of the chamber at 400 mTorr, and the local gas density drops quickly enough away from the tube that the probe phase shift is dominated by the gas between the holes. The pump beam is rejected at the exit of the vacuum chamber using a dichroic mirror that is also used as a window. In the data shown here, we have subtracted a very small background signal due to cross phase modulation in the entrance window.
The central plane of the gas tube is imaged onto the entrance slit of an imaging spectrometer. Interference fringes appear in the spectrum because of the time delay between the probe and reference pulses. An example spectral interferogram for Ar at 60 TW/cm2 pump vacuum intensity is shown in Fig. 1b. The intensity values given here are calculated from the average power and the measured beam profile – we estimate an uncertainty of 20%. The pump pulse, centered at time and transverse dimension , causes a phase shift in the probe pulse (too small to produce fringe shifts visible by eye in Fig. 1b). This causes a change in the spectral phase and amplitude of the probe beam Kim et al. (2002a). The spectral phase is found by Fourier analysis of the interference fringes, and the change in amplitude is also found from the interferogram. The final piece of information required is the spectral phase of the reference pulse, which is, to an excellent approximation, quadratic and proportional to the group delay dispersion Kim et al. (2002a). The extracted time domain phase shift of the probe is shown in Fig. 1c. The signal-to-noise ratio is considerably improved by summing multiple interferograms before performing the phase extraction Chen et al. (2007a); in all of the data presented here, 300 interferograms were summed at each power and polarization.
The bound electron optical nonlinearity in Ar is instantaneous to a very good approximation because the energy of the lowest electronic excitation is 15 eV, far greater than the photon energy 1.5 eV. The ordinary instantaneous Kerr effect is linear in the intensity : the refractive index is of the form , where is the index of refraction and is the Kerr coefficient, and thus . The measured FWHM in Fig. 1c of 38 fs matches an autocorrelation measurement of the pump pulse. The spatial profile lineout, shown in Fig. 1d, agrees well with the pump spot profile. This confirms that the intensity profile in the thin gas target is the same as the vacuum profile. The deleterious effect of excessive interaction length on the width of the response is illustrated in Fig. 1d. A lineout of the measured phase shift along at is shown with the chamber backfilled with Ar – note the wider profile compared to the flow tube case. Also shown are simulations of using the beam propagation method Kim et al. (2002b); with the simulation we obtain an effective pump-gas interaction length of 2 mm, in agreement with the tube geometry. Because of the short interaction length, intensity clamping couairon_femtosecond_2007 does not affect the intensity profiles.
The peak phase shift measured in the experiment is plotted as a function of peak intensity in Fig. 1e. We find a very linear dependence for both Ar and N2, and nearly the same Kerr coefficient, which is consistent with other experiments Marceau et al. (2010). For peak intensity TW/cm2, we measure a peak phase shift in Ar of 0.059 radians. For a medium with an effective interaction length , (note the extra factor of 2 because we measure cross phase modulation). Using the literature value for Ar, cm2/W Lehmeier et al. (1985); Marceau et al. (2010) at 1 atm, and using mm, we estimate an average pressure in the interaction region of 0.3 atm. A higher-order Kerr effect would add terms of the form , where loriot_measurement_2009 . No negative instantaneous phase is observed at any intensity in Ar or N2, nor do we see evidence of saturation Brée et al. (2011), in disagreement with the results of Loriot et al. loriot_measurement_2009 . A simulation of the phase shift expected using the coefficients reported in loriot_measurement_2009 is shown as a dashed line in Fig. 1e. The difference is stark and well outside any error in our experiment we can conceive of. We have also performed the same experiment in Ar using a probe pulse whose spectrum overlaps the pump pulse, with orthogonal polarization so that the pump light could be rejected by a polarizer before the spectrometer (see the appendix). We have studied the possible origin of the results obtained in loriot_measurement_2009 and have found that the interference of pump and probe pulses of the same wavelength can produce a plasma grating which gives rise to an effective birefringence wahlstrand_effect_2011 .
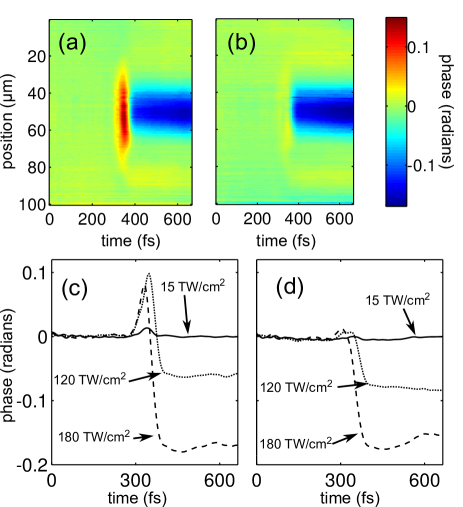
Increasing the pump intensity beyond the level of Fig. 1 requires careful consideration of increased supercontinuum generation by the pump itself. Because the pump and probe paths are not phase stable with respect to one another, spectral fringes between the pump supercontinuum and the reference pulse average out when many interferograms are summed. So the pump supercontinuum does not cause significant data distortion until it saturates the CCD camera, which occurs at intensities higher than 200 TW/cm2, well beyond the ionization threshold of 100 TW/cm2 Larochelle et al. (1998a). Maps showing at high intensity in Ar are shown in Fig. 2. At high intensities we observe an additional response due to the plasma generated by ionization Kosareva et al. (1997). The plasma produces a negative index contribution , where is the electron density and is the critical density. The plasma densities measured are consistent with calculations using Ammosov-Delone-Krainov (ADK) rates ammosov . Plots of as a function of pump intensity are shown in Fig. 2c () and Fig. 2d (). Note that the plasma contribution seen in Fig. 2 is highly characteristic: (1) its onset at higher intensity (180 TW/cm2 compared to 120 TW/cm2) increasingly dominates the instantaneous Kerr response at the back of the pulse; the residual positive Kerr peak appears to move forward in time, (2) unlike the Kerr response, the plasma-induced phase shift is probe polarization independent, and (3) after generation, the plasma response is long-lived on the time scale of this measurement, owing to recombination timescales of order 100 ps.
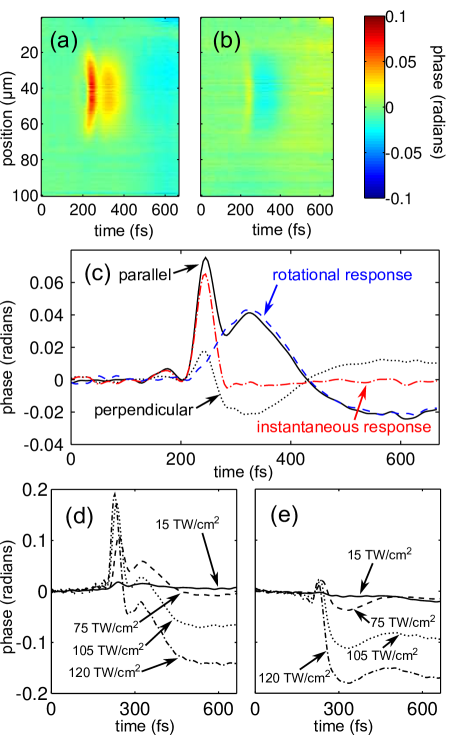
In N2, the optical Kerr response has an additional contribution from the transient alignment of the molecules in the strong optical field Nibbering et al. (1997); Chen et al. (2007a, b). Results for N2 are shown in Fig. 3; is shown at low pump intensity for parallel and perpendicular polarization in Fig. 3ab. The index change is , where is a response function that depends on properties of the rotational levels and the nuclear spin statistics Nibbering et al. (1997); Chen et al. (2007b). In N2 the rotational response peaks about 80 fs after the pump pulse arrives, as can be seen in Fig. 3a. The ratio of the instantaneous Kerr effect for parallel to perpendicular polarization is 3:1 in an isotropic medium. For the rotational component, the ratio is . The different symmetry properties allow the clean separation of the two contributions, as shown in Fig. 3c. Previous measurements using this technique Chen et al. (2007a, b) were unable to resolve the two contributions, but here we can owing to the shorter pump pulse. To our knowledge, this is the first direct observation of the relative contributions of the instantaneous and rotational components of the Kerr effect in N2. At higher intensities plasma is observed, as shown in plots of in Fig. 3de.
In summary, we have performed direct measurements of the optical Kerr effect in Ar and N2 using single-shot supercontinuum spectral interferometry. In N2, we are able to distinguish between instantaneous and rotational components of the nonlinearity, and the polarization dependence is consistent with theory. We observe the usual optical Kerr effect, linear in the intensity, as well as the onset of plasma, but no higher-order instantaneous nonlinearities effecting either saturation or negative response. The fact that the pump-induced response appears to be linear in the intensity until the point of ionization is a reflection of the latter’s extremely nonlinear onset. At least for 38 fs pulses, there is no practical distinction between plasma and special atomic states with negative polarizability. Finally, these results disprove the idea that higher-order instantaneous nonlinearities are important in nonlinear optics in gases at high intensities. Our results strongly confirm the long-standing conceptual picture couairon_femtosecond_2007 that short pulse filamentation in gases arises from the interplay between nonlinear self-focusing from bound electron nonlinearities and defocusing due to plasma generation.
J.K.W. thanks the Joint Quantum Institute for support. We thank S. Varma for helpful discussions. This research was supported by the National Science Foundation, the U.S. Department of Energy, the Office of Naval Research, and the Lockheed Martin Corporation.
Appendix A Appendix
Figure 4 shows experimental data in Ar using probe and reference pulses whose power spectra are identical to the pump pulse. In this case the probe and reference pulses are not supercontinua, but rather chirped versions of the pump pulse. To reject most of the pump light before the spectrometer, the pump polarization is perpendicular to the probe polarization, and a polarizer is inserted before the spectrometer. The signal from the windows is larger with a probe centered at 800 nm because the dichroic mirror that is used as an exit window when the probe is supercontinuum centered at 680 nm is replaced with a fused silica window. The window contribution has been subtracted in the data shown in Fig. 4.
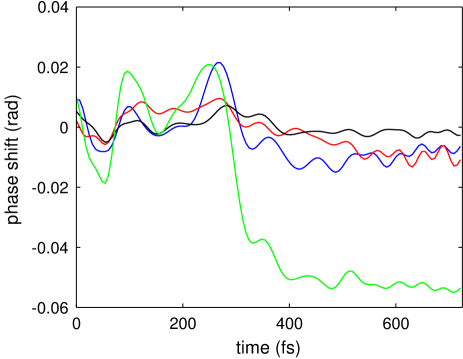
Due to the leakage of pump light through the polarizer due to its finite extinction ratio, a small fraction of the pump light reaches the CCD camera in the spectrometer. We attribute the oscillations in this data to the interference of this residual pump light with the reference pulse; as with the supercontinuum generated by the pump, this interference decreases when interferograms are averaged because the pump and probe arms are not phase stabilized. In this data, 1000 interferograms were averaged before the phase shift was extracted. The time resolution with the 800 nm probe is fs because of the narrower bandwidth. As with the data taken with a supercontinuum probe, a monotonically increasing, positive instantaneous phase shift is seen up to the ionization threshold. Note that coherent scattering from a plasma grating caused by interference between the pump and probe wahlstrand_effect_2011 is not present in this data because the pump polarization is perpendicular to the probe polarization.
References
- (1) G. P. Agrawal, Nonlinear Fiber Optics (Academic Press, 2006), 4th ed.
- (2) H. A. Haus, IEEE J. Sel. Topics Quantum Electron. 6, 1173 (2000).
- (3) A. Couairon and A. Mysyrowicz, Phys. Rep. 441, 47 (2007).
- (4) V. Loriot, E. Hertz, O. Faucher, and B. Lavorel, Opt. Express 17, 13429 (2009).
- (5) P. Béjot, J. Kasparian, S. Henin, V. Loriot, T. Vieillard, E. Hertz, O. Faucher, B. Lavorel, and J.-P. Wolf, Phys. Rev. Lett. 104, 103903 (2010).
- (6) D. Novoa, H. Michinel, and D. Tommasini, Phys. Rev. Lett. 105, 203904 (2010).
- (7) W. Ettoumi, Y. Petit, J. Kasparian, and J.-P. Wolf, Opt. Express 18, 6613 (2010).
- (8) J. Kasparian, P. Béjot, and J.-P. Wolf, Opt. Lett. 35, 2795 (2010).
- Kolesik et al. (2010b) M. Kolesik, E. M. Wright, and J. V. Moloney, Opt. Lett. 35, 2550 (2010b).
- B?jot et al. (2011) P. Béjot, E. Hertz, B. Lavorel, J. Kasparian, J.-P. Wolf, and O. Faucher, Opt. Lett. 36, 828 (2011).
- (11) G. O. Ariunbold, P. Polynkin, and J. V. Moloney, arXiv:1106.5511 (unpublished).
- (12) M. Kolesik, D. Mirell, J. Diels, and J. V. Moloney, Opt. Lett. 35, 3685 (2010a).
- (13) Y.-H. Chen, S. Varma, T. M. Antonsen, and H. M. Milchberg, Phys. Rev. Lett. 105, 215005 (2010).
- Kosareva et al. (2011) O. Kosareva, J. Daigle, N. Panov, T. Wang, S. Hosseini, S. Yuan, G. Roy, V. Makarov, and S. L. Chin, Opt. Lett. 36, 1035 (2011).
- Polynkin et al. (2011) P. Polynkin, M. Kolesik, E. M. Wright, and J. V. Moloney, Phys. Rev. Lett. 106, 153902 (2011).
- (16) P. Béjot, E. Hertz, J. Kasparian, B. Lavorel, J.-P. Wolf, and O. Faucher, Phys. Rev. Lett. 106, 243902 (2011).
- Teleki et al. (2010) A. Teleki, E. M. Wright, and M. Kolesik, Phys. Rev. A 82, 065801 (2010).
- Brée et al. (2011) C. Brée, A. Demircan, and G. Steinmeyer, Phys. Rev. Lett. 106, 183902 (2011).
- Kim et al. (2002a) K. Y. Kim, I. Alexeev, and H. M. Milchberg, Appl. Phys. Lett. 81, 4124 (2002a).
- Stegeman et al. (2011) Going from a measurement of the transient birefringence to Kerr coefficients requires careful accounting of all relevant tensor components, as discussed in G. Stegeman, D. G. Papazoglou, R. Boyd, and S. Tzortzakis, Opt. Express 19, 6387 (2011).
- Chen et al. (2007a) Y.-H. Chen, S. Varma, I. Alexeev, and H. Milchberg, Opt. Express 15, 7458 (2007a).
- Kim et al. (2002b) The distorting effects of using an interaction length in spectral interferometry much longer than the Rayleigh range are discussed and simulated in K. Y. Kim, I. Alexeev, and H. M. Milchberg, Opt. Express 10, 1563 (2002b).
- Marceau et al. (2010) C. Marceau, S. Ramakrishna, S. Génier, T. Wang, Y. Chen, F. Théberge, M. Châteauneuf, J. Dubois, T. Seideman, and S. L. Chin, Opt. Commun. 283, 2732 (2010).
- Lehmeier et al. (1985) H. Lehmeier, W. Leupacher, and A. Penzkofer, Opt. Commun. 56, 67 (1985).
- (25) J. K. Wahlstrand and H. M. Milchberg, arXiv:1107.2830 (unpublished).
- Larochelle et al. (1998a) S. Larochelle, A. Talebpour, and S. L. Chin, J. Phys. B: At. Mol. Opt. Phys. 31, 1201 (1998a); S. F. J. Larochelle, A. Talebpour, and S. L. Chin, J. Phys. B: At. Mol. Opt. Phys. 31, 1215 (1998b).
- Kosareva et al. (1997) O. G. Kosareva, V. P. Kandidov, A. Brodeur, and S. L. Chin, J. Nonlinear Opt. Phys. Mater. 6, 485 (1997).
- (28) M. V. Ammosov, N. B. Delone and V. P. Krainov. Sov. Phys. JETP 64, 1191 (1986).
- Nibbering et al. (1997) E. T. J. Nibbering, G. Grillon, M. A. Franco, B. S. Prade, and A. Mysyrowicz, J. Opt. Soc. Am. B 14, 650 (1997).
- Chen et al. (2007b) Y.-H. Chen, S. Varma, A. York, and H. M. Milchberg, Opt. Express 15, 11341 (2007b).