Measurement of the separation dependence of resonant energy transfer between CdSe/ZnS core/shell nanocrystallite quantum dots
Abstract
The separation dependence of the interaction between two resonant groups of CdSe/ZnS nanocrystallite quantum dots is studied at room temperature. A near-field scanning optical microscope is used to bring a group of mono-disperse 6.5 nm diameter nanocrystallite quantum dots which are attached to the microscope probe, into close proximity of 8.5 nm diameter group of nanocrystallite quantum dots which are deposited on a solid immersion lens. Information extracted from photoluminescence, photoluminescence excitation and absorption curves as well as numerical calculations of the energy levels, show that the third excited excitonic energy level of the large quantum dots nearly matches the ground excitonic energy level for the small quantum dots. Quenching of the small quantum dots photoluminescence signal has been observed as they approach the large quantum dots. On average, the separation between microscope probe and solid immersion lens changed in the 15-50 nm range. The transition probability between these two groups of quantum dots is calculated to be , within the experimentally obtained range of transition probabilities. The Förster radius, as a signature of energy transfer efficiency, is experimentally found to be in the 14-22 nm range.
pacs:
78.67.Hc,78.66.Hf,07.79.FcI Introduction
Advanced semiconductor technology starting in late 1980s allowed for the fabrication of nanocrystallite quantum dots (NQDs), consisting of a few hundred to many thousand atomsAllivisatos1996 of semiconductor materials producing a potential well for electrons and holes. NQDs are fabricated such that their diameters are smaller than the bulk Bohr exciton diameter, thus the electronic structure is dominated by quantum confinement effects in all three dimensions Efros1982 ; Brus1984 ; Reimann2002 and is suited for the study of zerodimensional structures. Allivisatos1996 ; Brus1991 ; Empedocles1996 Colloidal NQDs, which are synthesized by relatively inexpensive wet chemistry methods, have high control in engineering the energy levels. This results in NQDs with strong size dependent optical and electrical properties. Allivisatos1996 In particular, CdSe NQDs can be synthesized with a tunable size of 15-100 Å in a narrow distribution ( 5rms dispersion). Murray1993
Emission properties of NQDs are often measured via photoluminescence (PL) experiments. In PL, excitonic states in the semiconductor material are induced by photon absorption, and the optical emission as these excitons recombine analyzed. In Förster resonant energy transfer (FRET) an excited donor can transfer its energy directly (nonradiatively) to an acceptor via dipole-dipole interaction. The phenomenon of resonant energy transfer was observed by J. B. Perrin Wu1994 ; Masters2008 at the beginning of the 20th century, but it was Förster in the late 1940s Forster1948 who proposed a theory describing long range molecular interaction by resonance energy transfer. Due to its strong separation dependence, FRET has been used as a molecular ruler to determine inter- and intra-molecular distances.Stryer1999 Since FRET represents a transfer of energy, it can be detected by measuring the quenching of donor emission or the enhancement of acceptor emission. This relationship of the transfer rate as a function of donor-acceptor separation was first demonstrated with peptides in 1963.Edelhoch1963
Controlling the distance between the NQDs in real time has been a challenge faced by most groups studying the dynamic process of energy transfer between NQDs.Kagan1995 ; Kagan1996 ; Crooker2002 ; Nomura2007 ; Chen2008 ; Lu2008 ; Kim2008 ; Kim2009 ; Wang2010 ; Tai2010 We use a near-field scanning optical microscope (NSOM) to control the distance between two groups of NQDs in real time. In this experiment a group of core/shell CdSe/ZnS NQDs with external diameter of 6.5 nm, attached to the apex of the NSOM probe, are brought into close proximity to a second group of CdSe/ZnS NQDs with external diameter of 8.5 nm, which are deposited on the flat part of a solid immersion lens (SIL). Both groups of NQDs are excited and the PL signal of the small NQDs is monitored to observe any changes. Using an Al-coated NSOM probe and diluting the NQDs helps to reduce the number of NQDs excited on the NSOM probe and SIL.
II Experiment
II.1 Experimental setup
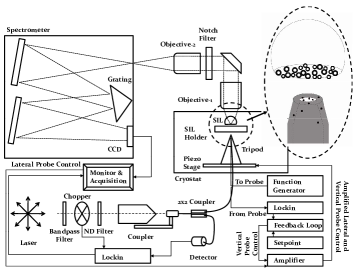
An aperture NSOM has been designed and built to be used as a probe to excite a small number of core/shell NQDs (CdSe/ZnS). The main reason behind using a NSOM system was to first illuminate an area much smaller than what can be achieved in far field microscopy by overcoming the diffraction limit by the size of probe. Pohl1984 ; Harootunian1986 ; Durig1986 ; Betzig1987 ; Betzig1991 ; Betzig1992 Second, the NSOM system can be used to move one group of NQDs with respect to another, making the separation between them arbitrarily small by feedback schemes. Pohl1984 ; Harootunian1986 ; Durig1986 ; Betzig1987 ; Betzig1991 ; Betzig1992 ; Karrai1995 Small NQDs are attached to the apex of a NSOM probe by dipping the probe into the colloidal suspension of the NQDs, while large NQDs are diluted and deposited on the SIL by drop cast. All NQDs are covered by octadecylamine (ODA) ligands. The inset to Fig. 1 schematically shows the probe’s Al-coating precluding the excitation of the NQDs outside its apex.
As it is shown in Fig. 1, the probe’s vertical motion is controlled by a feedback loop system while its lateral motion is computer controlled. The amplified signal from the feedback loop system and the computer are applied to a 3-axis piezo stage. The NSOM probe is assembled on a tripod which sits on the piezo stage. The probe approaches the flat side of a SIL through a hole on the SIL holder. While all the results reported in this paper were obtained at room temperature, the SIL holder also serves the purpose of cooling down the SIL as it is in thermal contact with the cryostat’s cold finger. An argon laser (488nm line) has been used for optical excitation. To improve on the signal-to-noise ratio of the monitored signal, the laser light is chopped before being coupled into a single mode optical fiber. The use of the fiber splitter, a Si photodiode and standard lock-in detection allows for continuous monitoring of the laser intensity coupled to the NSOM probe. After excitation of small and large dots on the NSOM probe and the SIL, photons released by these two groups of dots are collected through the SIL and two other objectives. They are then dispersed by a grating spectrometer and their energy is recorded on a charged-coupled device (CCD).
As the NSOM probe is brought close to the SIL, a portion of the small NQDs’ energy is expected to be transferred to the large NQDs and the PL signal of small NQDs’ should show quenching.
II.2 Measurement of the distance between small and large NQDs
In the NSOM system, the amplitude of vibration of the NSOM coated fiber probe, glued to a vibrating tuning fork driven at resonance, has been used as an input for the feedback loop circuit.Karrai1995 This circuit controls the distance between the NSOM probe and SIL. The vibrational amplitude of the NSOM probe decreases as it is driven towards the SIL. Karrai1995 ; Weiner1992 ; Toledo1992 ; Grober1994 This amplitude damping has been used to measure the probe-SIL separation. To be able to measure this distance, the probe was engaged in close proximity of the SIL and then moved towards the SIL by decreasing the setpoint in the feedback loop system. As the probe approaches the SIL and its amplitude decreases, the system reaches the point that its amplitude becomes unstable and the probe would break if moved any further. This point is assumed to be the contact point between the NSOM probe and the SIL. The separation is then increased by pulling back the probe by increasing the setpoint. Since the voltage applied to move the probe away from contact, as well as the displacement calibration of the piezo stage as a function of voltage, are known, the separation between the NSOM probe and SIL can be obtained. Hence, in other experiments the voltage-separation calibration curve has been used to identify the distance between the small and large NQDs that are on the NSOM probe and SIL respectively.
II.3 Resonant CdSeZnS NQDs
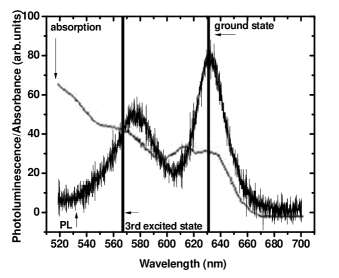
Specific sizes of small and large NQDs are selected to have the excitonic ground state of the small CdSe/ZnS NQDs coincide with one of the excited states of the large CdSe/ZnS NQDs. This energy selection is accomplished by a numerical calculation of the energy levels, and verified by PL, photoluminescence excitation (PLE), and absorption experiments. PL measurements were used to study the energy structure of the NQDs by using the photon excitation and relaxation. It is shown in the theory section that when the PL signal of the large NQDs with 8.5 nm diameter is observed at 630nm, the calculated corresponding PL signal for resonant set of small NQDs should be at 570nm, which corresponds to NQDs with 6.5 nm diameter. Vertical lines in Fig. 2 show the calculated third excited and ground state energy levels of large NQDs at 567nm and 631nm. To find a resonant pair of NQDs, PL signals of various NQDs have been studied. As it is shown in Fig. 2 by the absorbance spectrum for the large NQDs (provided by the NQDs distributer, N. N. Labs LLC.) there is an energy level at 570nm for the large NQDs with a ground energy level at 630nm. This was confirmed by PLE experiments. The PLE graph, which is similar to the absorption graph, shows strong absorption at nm with emission at nm.
II.4 Resonant energy transfer between CdSeZnS NQDs as a function of separation
Energy matched NQDs are used for the resonant energy transfer experiments. The area of the PL signal of small NQDs is monitored for any change. The small NQDs on the NSOM probe are optically excited, and the induced excitons relax to their ground state recombining and releasing a photon. These photons are collected through the SIL and sent to a spectrometer generating the high energy peak of the spectrum in Fig. 2. This same process also occurs with the large NQDs, generating the low energy peak of the spectrum in Fig. 2. As NQDs are brought into close proximity, a portion of the small NQDs energy would be expected to not be released through recombination and transferred to the large NQDs. This interaction, associated to the non-radiative energy transfer from the ground state of the small NQDs to the third excited state of the large NQDs, becomes increasingly more important as the separation between the NSOM probe and the SIL decreases, Forster1948 within the near-field region. Furthermore, since the intradot relaxation time is very fast Efros1995 ; Sionnest1997 ; Klimov1999 ; Sionnest2005 in the subpicosecond to picosecond range, energy transfer from the large NQDs to the small ones is precluded.
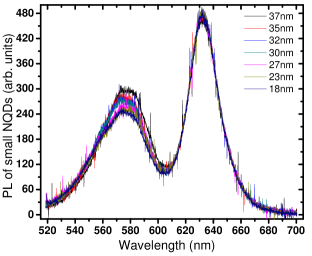
The separation induced quenching of the small NQDs signal is a clear signature of interaction between two groups of resonant NQDs. Quenching of the small NQDs PL signal is shown in Fig. 3. The small NQDs PL signal decreases as a function of separation: the area under the PL signal decreases in the 15286, 15026, 14846, 14740, 14496, 14352 and 14006 sequence fpr corresponding separations of 37, 35, 32, 30, 27, 23 and 18 nm respectively. Each PL spectrum in this experiment was integrated over 120 seconds.
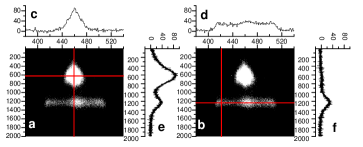
The corresponding enhancement in the large NQDs PL signal was not observed as the number of NQDs on the SIL were not under control. As a consequence of the deposition process of the large NQDs on the SIL, many NQDs agglomerate. Lowering the concentration of large NQDs on the 2.5 mm wide SIL did not prevent their agglomeration. This packed ensemble of monodispersed large NQDs allows energy transfer between similar size neighboring large NQDs, beyond the area above the NSOM probe. Hence, numerous large NQDs get excited, as observed in the spectrometer images. The spectrometer images in Fig. 4 show that large NQDs are excited beyond the area above the NSOM probe, strongly suggesting that neighboring NQDs transfer energy to each other. Consequently, the area under the PL signal of large NQDs is mostly constant.

Figure 5 shows the reduction of the PL signal of the small NQDs as a function of separation between the NSOM probe and SIL. In this figure the area under the PL signal of small NQDs has been normalized to the area of the large NQDs PL signal. This last normalization process is undertaken to cancel out small fluctuations associated with the laser intensity. As it is shown in the figure, when the separation reaches 20 nm, the decrease in PL signal from the small NQDs stops, which is believed to be the contact point between the two groups of NQDs on the NSOM probe and the SIL. After this separation the PL signal of the small NQDs remains constant. The Difference between this contact point and the sum of the diameters of the two NQDs ( 15 nm) could be partially due to the existence of 2.5 nm long and tightly bounded ODA ligands on the outer shell of NQDs which prevent full contact of NQDs.Belman2008 ; Li2003 This separation is interpreted as a zeroth of the FRET spectroscopic ruler.
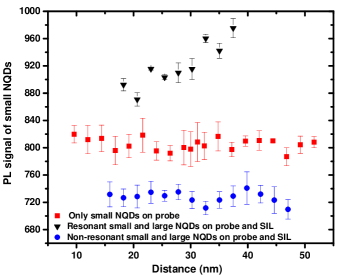
In addition the experiment was done without the large NQDs on the SIL and only keeping the small NQDs on the NSOM probe. The PL signal of the small NQDs does not change as the probe approaches the clean SIL, as shown in Fig. 6. On the other hand, the triangle points in Fig. 6 show the quenching of the small NQDs PL signal when both groups of small and large resonant NQDs were present. To further enhance the argument that the change of PL signal in small NQDs is due to FRET, nonresonant small and large NQDs were brought close together. No quenching in the small NQDs PL signal was observed as it is shown by the circles in Fig. 6. Small size NQDs were chosen to have difference ground energy level than any levels of the large NQDs.
III Theory
III.1 Energy levels of the CdSeZnS
Single band effective mass approximation Kortan1990 ; Haus1993 ; Schooss1994 has been used to study the excitonic energy levels of NQDs. This process helped us choose the right resonant NQDs for the experiment. This numerical calculation showed us that a large CdSe/ZnS with core radius of 3.7 nm and shell radius of 4.25 nm with ground energy level of J (631 nm) has its third excited energy level at J (567 nm). This makes it resonant with a small CdSe/ZnS with outer radius of 3.25 nm with a ground energy level emission at 570 nm. In this calculation, the presence of ODA ligands on NQDs does not change the energy levels.
The analysis is first restricted to the strong confinement regime where the Coulomb interaction between particles is neglected in comparison to the confinement energy. At the core-shell boundary () the continuity of the wavefunction and the probability current, Daniel1968 ; Brus1983 as well as the boundary condition on the wavefunction at shell-vacuum boundary of the NQDs (assumed to be immersed in vacuum) yield the energy levels of the free particles (electrons and holes). The shell radius of the NQDs is obtained from small angle X-ray diffraction scattering. Knowing , the core radius can be adjusted to change the ground energy level of the calculation, which is then used to find other energy levels.
Later the electron-hole Coulomb interaction energy is considered a correction to the total Hamiltonian. This last term is small and is treated as a Helium-like perturbationSchooss1994 for the electron and hole energy of the system. At this point, by adjusting , the ground state energy due to strong confinement and electron hole Coulomb interaction correction can be calculated and compared to the observed PL peak of the NQDs. Matching the calculated energy of the ground state and the observed PL peak leads us to choose the right . For nm and nm the first four energy levels and their Coulomb correction are shown in Table 1. The calculated excited energy levels are compared to the absorption peaks of the dots, showing very good agreement.
| 0 | 0 | |||||
| 0 | 1 | |||||
| 1 | 0 | |||||
| 1 | 1 |
III.2 Dipole-dipole interaction and resonant energy transfer
The energy of any charge distribution in the presence of other charge distributions and external electrical potential can be obtained by a multipolar expansion.Jackson Since both NQDs are neutral, the first term which survives is the dipole-dipole interaction energy, due to the dipolar electric field of one of the excitons, interacting with the other NQDs exciton’s dipole.
This energy of interaction between electric multipoles may be found by expanding the Coulomb interaction. First consider two charge distributions, 1 and 2, centered at and respectively with coordinate axes chosen to be parallel. The distance between these two origins is defined as which makes an angle with the axis of the first charge distribution. The separation between two elements, and , of these two charge distributions is defined as . By expanding this distance into spherical harmonics, the electrostatic interaction can be written as Carlson1950 ; Wolf1968
| (1) |
where
| (2) |
For the case of interaction between two NQDs, is the charge distribution of the first NQD and belongs to the second NQD. When the ground state of the small NQD () is in resonance with the third excited state of the large NQD (), the emission peak of the small NQD overlaps with the fourth absorption peak of the large NQD. Both of these states are optically active due to the P symmetry in the valence band.
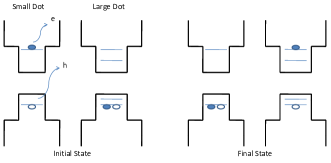
We have used Eqs. (1) and (2) to calculate the transition rate . Scholes2003 ; Curutchet2008 ; Baer2008 ; Scholes2005 ; Allan2007 is the Coulomb potential energy between the small and large NQDs and is the normalized overlap between donor emission and acceptor absorption spectra.Scholes2003 ; Curutchet2008 ; Baer2008 ; Scholes2005 From this equation, the transition probabilities are obtained, with the donor’s lifetime. Since the exciton at the ground state on the small NQDs recombines after , the energy transfer between two resonant NQDs happens in times shorter than . The overall initial wavefunction is the multiplication of the wavefunction of the exciton (electron-hole pair) at its ground state in the small NQD by the wavefunction of no exciton in the large NQD (which is equivalent to have an electron and hole both in the first excited energy level in the valence band of the large NQD). Similarly the overall final wavefunction is considered to be the product of the wavefunction of no exciton in the small NQD by the wavefunction of an exciton at the third excited energy state in the large NQD. Fig. 7 shows the initial and final states considered. Using these initial and final states, is obtained. Here the normalized overlap between donor’s emission and acceptor’s absorption, , obtained from the experimental data, has been used. Hence, the transition rate is: and the transition probability is by considering nanosecond. Radiative lifetime of CdSe or CdSe/ZnS has been measured or calculated to be in the range of few nanoseconds up to several tens of nanoseconds. Efros1992 ; Michler2000 ; Dahan2001 ; Zhang2002 ; Schlegel2002 ; Wang2003 ; Klimov1999 ; Matsumoto2007 ; Fisher2004
IV Discussion
Data similar to those reported in Fig. 3 have been used to derive the transition probability of the resonant energy transfer between these two groups of NQDs. The procedure to obtain the transition probability is given by
| (3) |
where is the normalized area of the PL signal of the small NQDs at a separation and is the corresponding one at an infinite separation, when there is no interaction between the small and large dots. Equation (3) represents the fact that as the two groups of NQDs get closer the dipole-dipole interaction increases and the probability of resonant energy transfer increases. Hence, the normalized PL signal of the small NQDs decreases proportionally to the square of the strength of the interaction. In the experimental case has been selected at the distance when the interaction is the smallest, i.e. the largest experimentally accessible separation between groups of NQDs. Since the PL signal of small NQDs cannot be collected when they are very far away from the SIL, a position where the PL signal from small NQDs is completely collected has to be used as a reference. Furthermore, the feedback interaction between the NSOM probe and the SIL happens over 50 nm, which limits the point for the largest separation to about this value. As an example, for the experiment that Fig. 5 was extracted, this distance is 37 nm.
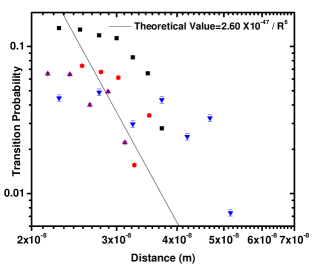
Figure 8 shows the transition probability for four experimental sets. The theoretical value for the transition probability () is also shown in the figure.
The transition probability also provides the Förster radius as it is represented by in the Förster rate equation.Forster1948 ; Forster1965 ; JaresErijman2003 ; Muller2004 By comparing from the Förster rate equation and its equivalent experimental transition probability, the Förster radius is calculated to be in the 14-22 nm range. From the theoretically calculated transition probability, radius is extracted to be 17 nm. A Förster radius of 4.7 nm was obtained by C. Kagan et al.Kagan1995 ; Kagan1996 using differently sized CdSe NQDs and capping ligands, under a closed packed mixture of two sizes of NQDs. In our experiment the measurement is between small and large NQDs that are isolated from each other, while in Ref. [13, 14] it is between mixed small and large NQDs. The authors of Ref. [13, 14] have used spectral overlap of donor emission and acceptor absorption integral to measure Förster radius. C. Kagan et al. show Kagan1995 ; Kagan1996 ; Dexter1953
| (4) |
is the frequency, is the donor luminescence quantum yield, and is the effective index of refraction. is the normalized spectrum for the donor and is the molar extinction coefficient for acceptors absorption. The authors used a random closed packed mixture of NQDs with organic caps filling interstices and considered the volume weighted average of the index of refraction of CdSe () and organic caps () as an effective index of refraction. In our experiment, isolating small NQDs from large NQDs would make smaller in comparison to these works because of the presence of air between the interacting NQDs. This screening effect has been discussed previously in similar systems. Beljonne2009 Using , spectral overlap and under our experimental condition would bring the Förster radius obtained from Ref. [13, 14] in close agreement with our data. By considering the parameters for L. Guo et al. work, Guo2006 a similar conclusion can be obtained.
V Conclusion
In conclusion, resonant energy transfer between two groups of CdSe/ZnS as a function of separation has been observed directly from the PL signal of small NQDs. Small CdSe/ZnS NQDs on the apex of the NSOM probe were brought into close proximity to the resonant large NQDs on the SIL and both groups of NQDs were optically excited. As the third excited state energy level of large NQDs is the closest energy level to the ground state energy level of the small NQDs, some fraction of the energy was transferred from small NQDs to the large NQDs before recombination took place in the small NQDs. Figure 8 indicates that the interaction between resonant NQDs could be a dipole-dipole interaction. Within the experimental resolution, this energy transfer is compatible with a dipole active one and depends on distance as dipole-dipole interaction (). In the future, more work will be needed to isolate a single small NQD on the NSOM probe and a single large NQD on the SIL.
In all experiments, the small PL signal reaches a point that the quenching stops and the PL signal becomes constant, which seems to correspond to the contact point of the small and large NQDs as they get close enough to each other. For all of the experiments this contact point is 20 nm, comparable to the sum of the size of the two NQDs diameters of 15 nm. This difference is mostly due to the presence of the 2.5 nm long, tightly bounded ODA ligands on the NQDs.
The experimental transition probability between 6.5 nm and 8.5 nm diameter CdSe/ZnS NQDs is measured in the range of , while the theoretically calculated value is (). Figure 8 indicates that the interaction between resonant NQDs could be a dipole-dipole interaction. More precise data is needed for obtaining a better fitting. Comparison of the Förster radius from our experiment, 14-22 nm, with the distance between NSOM probe and SIL, (15-50 nm), shows that coupling between NQDs is a near-neighbor interaction.
Acknowledgements.
This work was supported in part by the National Science Foundation through grants No. CCF-0508239 and PHY-0701636, and Los Alamos National Laboratory support through contract No. 49423-001-07. The authors are also indebted to the Nanoscale Imaging Center at IUPUI for the liberal use of the installations. We are also indebted to Dr. Horia Petrache for conducting the NQDs size measurement by small angle X-ray scattering and Cynthia Wassall for preparing the SIL.References
- (1) A. P. Alivisatos, Science , 933 (1996)
- (2) L. Al. Efros and L. A. Efros, Sov. Phys. Semicond. , 772 (1982)
- (3) L. E. Brus, J. Chem. Phys. , 4403 (1984)
- (4) S. A. Reimann and Matti Mannien, Rev. Mod. Phys. , 1283 (2002)
- (5) L. Brus, Appl. Phys. A-Mater. , 465 (1991),
- (6) S. A. Empedocles, D. J. Norris, and M. G. Bawendi, Phys. Rev. Lett. , 3873 (1996)
- (7) C. B. Murray, D. Norris and M. G. Bawendi, J. Am. Chem. Soc. , 8706 (1993)
- (8) P. Wu and L. Brand, Anal. Biochem. , 1 (1994)
- (9) B. R. Masters and P.T.C. So, Hand Book of Biomedical Nonlinear Optical Microscopy, Oxford University Press (2008)
- (10) V. T. Forster, Ann. Phys. , 55 (1948)
- (11) L. Stryer, Annu. Rev. Biochem. , 819 (1978)
- (12) H. Edelhoch, L. Brand and M. Wilcheck, Isr. J. Chem. , 216 (1963)
- (13) C. R. Kagan, C. B. Murray and M. G. Bawendi, Phys. Rev. B , 8633 (1996)
- (14) C. R. Kagan, C. B. Murray, M. Nirmal and M. G. Bawendi, Phys. Rev. Lett. , 1517 (1996)
- (15) S. A. Crooker, J. A. Hollingsworth, S. Tretiak and V. I. Klimov, Phys. Rev. Lett. , 186802 (2002)
- (16) W. Nomura, T. Yatsui, T. Kawazoe, and M. Ohtsu, J. Nanophotonics , 011591, (2007)
- (17) C. W. Chen, C. H. Wang, Y. F. Chen, C. W. Lai, and P. T. Chou, Appl. Phys. Lett. , 051906 (2008)
- (18) W. L , I. Umezu, and A. Sugimura, Jpn. J. Appl. Phys. , 6592 (2008)
- (19) D. G. Kim, S. Okahara, M. Nakayama and Y. G. Shim, Phys. Rev. B , 153301 (2008)
- (20) D. G. Kim, K. Okazaki and M. Nakayama, Phys. Rev. B , 045322 (2009)
- (21) C. H. Wang, C. W. Chen, Y. T. Chen, C. M. Wei, Y. F. Chen, C. W. Lai, M. L. Ho, P. T. Chou and M. Hofmann, Appl. Phys. Lett. , 071906 (2010)
- (22) K. Tai, W. L , I. Umezu, and A. Sugimura, Appl. Phys. Express. , 035202 (2010)
- (23) D. W. Pohl, W. Denk and M. Lanz, Appl. Phys. Lett. , 651 (1984)
- (24) A. Harootunian, E. Betzig, M. Isaacson, and A. Lewis, Appl. Phys. Lett. , 674 (1986)
- (25) U. D rig, D. W. Pohl, and F. Rohner, J. Appl. Phys. , 3318 (1986)
- (26) E. Betzig, M. Isaacson, and A. Lewis, Appl. Phys. Lett. , 2088 (1987)
- (27) E. Betzig, J. K. Truatman,T. D. Harris, J. S. Weiner and R. L. Kostelak, Science , 1468 (1991)
- (28) E. Betzig and J. K. Trautman, Science , 189 (1992)
- (29) K. Karrai and R. D. Grober, Appl. Phys. Lett. , 1842 (1995)
- (30) E. Betzig, P. L. Finn, and J. S. Weiner, Appl. Phys. Lett. , 2484 (1992)
- (31) R. Toledo-Crow, P. C. Yang, Y. Chen, and M. Vaez-Iravani, Appl. Phys. Lett. , 2957 (1992)
- (32) R. D. Grober, T. D. Harris, J. K. Trautman and E. Betzig, Rev. Sci. Instruments , 626 (1994)
- (33) Al. L. Efros, V. A. Kharchenko and M. Rosen, Solid State Commun. , 281 (1995)
- (34) P. Guyot-Sionnest and M. A. Hines, Appl. Phys. Lett. , 686 (1998)
- (35) V. I. Klimov, D. W. McBranch, C. A. Leatherdale and M. G. Bawendi, Phys. Rev. B , 13740 (1999)
- (36) P. Guyot-Sionnest, B. Wehrenberg and D. Yu, J. Chem. Phys. , 074709 (2005)
- (37) N. Belman, S. Acharya, O. Konovalov, A. Vorobiev, J. Israelachvili, S. Efrima and Y. Golan, Nano Lett. , 3858 (2008)
- (38) J. J. Li, Y. A. Wang, W. Guo, J. C. Keay, T. D. Mishima, M. B. Johnson and X. Peng, J. Am. Chem. Soc. , 12567 (2003)
- (39) A. R. Kortan, R. Hull, R. L. Opila, M. G. Bawendi, M. L. Steigerwald, P. J. Carol and L. E. Brus, J. Am. Chem. Soc. , 1327 (1990)
- (40) J. W. Haus, H. S. Zhou, I. Honma and H. Komiyama, Phys. Rev. B 47,1359 (1993)
- (41) D. Schooss, A. Mews, A. Eychmuller and H. Weller, Phys. Rev. B 49,17072 (1994)
- (42) D.J. Ben Daniel and C. B. Duke, Phys. Rev. , 683 (1968)
- (43) L. E. Brus, J. Chem. Phys. , 5566 (1983)
- (44) J. C. Miklosz and R. G. Wheeler, Phys. Rev. 153, 913 (1967)
- (45) J. O. Dimmock and R. G. Wheeler, J. Appl. Phys. 32,2271 (1961)
- (46) A. N. Nethercot, Phys. Rev. Lett. 33,1088 (1974)
- (47) J. D. Jackson, Classical Electrodynamics, John Wiely and Sons Inc.(1999)
- (48) B. C. Carlson and G. S. Rushbrooke, Mathematical P. Camb. Philos. Soc. 46, 626 (1950)
- (49) W. P. Wolf and R. J Birgeneau, Phys. Rev. , 376 (1967)
- (50) G. D. Scholes, Annu. Rev. Phys. Chem. , 57 (2003)
- (51) C. Crutchet, A. Franceschettti, A. Zunger and G. D. Scholes, J. Phys. Chem. C , 13336 (2008)
- (52) R. Baer and E. Rabani, J. Chem. Phys. , 184710 (2008)
- (53) G. D. Scholes and D. L. Andrews, Phys. Rev. B , 125331 (2005)
- (54) G. Allan and C. Delerue, Phys. Rev. B , 195311 (2007)
- (55) Al. L. Efros, Phys. Rev. B , 7448 (1992)
- (56) P. Michler, A. Imamoglu, M. Mason, P. Carson, G. Strouse and S. Buratto, Nature , 968 (2000)
- (57) M. Dahan, T. Laurence, F. Pinaud, D. Chemla, A. Alivisatos, M. Sauer and S. Weiss, Opt. Lett. , 825 (2001)
- (58) J. Zhang, X. Wang and M. Xiao, Opt. Lett. , 1253 (2002)
- (59) G. Schlegel, J. Bohnenberger, I. Potapova and A. Mews, Phys. Rev. Lett. , 137401 (2002)
- (60) X. Wang, L. Qu, J. Zhang, X. Peng and M. Xiao, Noano Lett. , 1103 (2003)
- (61) Y. Matsumoto, R. Kanemoto, T. Itoh, S. Nakanishi, M. Ishikawa, and V. Biju, J. Phys. Chem. C , 1345 (2007)
- (62) B. Fisher, H. Eisler, N. Stott and M. Bawendi,J. Phys. Chem. B , 143 (2004)
- (63) V. T. Forster: In modern quantum chemistry, Academic Press (1965)
- (64) E. A. Jares Erijman and T. M. Jovin, Nature Biotechnol. , 1387 (2003)
- (65) F. Muller, S. Gotzinger, N. Gaponik, H. Weller, J. Mlynek and O. Benson, J. Phys. Chem. B , 14527 (2004)
- (66) D. L. Dexter, J. Chem. Phys. , 836 (1953)
- (67) D. Beljonne, C. Curutchet, G. D. Scholes and R. J. Silbey, J. Phys. Chem. B , 6583 (2009)
- (68) L. Guo, T. Krauss, C. Poitras, M. Lipson, X. Teng and H. Yang, Appl. Phys. Lett. , 061104 (2006)