Spin excitations of the correlated semiconductor FeSi probed by THz radiation
Abstract
By direct measurements of the complex optical conductivity of FeSi we have discovered a broad absorption peak centered at frequency that develops at temperatures below K. This feature is caused by spin-polaronic states formed in the middle of the gap in the electronic density of states. We observe the spin excitations between the electronic levels split by the exchange field of T. Spin fluctuations are identified as the main factor determining the formation of the spin polarons and the rich magnetic phase diagram of FeSi.
pacs:
71.27.+a, 78.20.CiThe origin of the narrow gap ( meV) that develops in the density of electronic states of FeSi at low temperatures poses a real challenge to both theorists and experimentalists for last five decades Aeppli and Fisk (1992); Riseborough (2000). Due to the anomalous transfer of spectral weight from the gap region to high energies (up to ) Schlesinger et al. (1993); Degiorgi et al. (1994); Mena et al. (2006) FeSi was put in line with the Kondo insulators Ce3Bi4Pt3, SmB6, YbB12 etc. At the same time, the crossover from an activated to a Curie-Weiss behavior of the magnetic susceptibility Jaccarino et al. (1967) was successfully explained within a spin-fluctuation model suggesting thermally induced magnetic moments of Fe Takahashi (1997). Finally, the distinct -symmetry of electronic states above and below the gap Fu and Doniach (1995) makes it important to consider carefully the effects of strong electron correlations Anisimov et al. (1996); Mazurenko et al. (2010); Figueira and Franco (2007); Franco et al. (2009).
The interest to FeSi has been renewed after recent high resolution photoemission experiments, which show no sign of a Kondo resonance favoring a simple itinerant semiconductor picture with bands renormalized due to correlation effects Zur et al. (2007); Klein et al. (2008). Ellipsometric studies in a broad spectral range supports this assumption Menzel et al. (2009); the collapse of the gap is caused by a temperature-induced transition from a low-temperature semiconductor to a high-temperature semimetal. However, this conclusion is at variance with the results of dc-transport and magnetic studies Sluchanko et al. (2000, 2002); Corti et al. (2003) which assign the onset of the metallic state below 80 K to the formation of a narrow many-body resonance (width meV) within the gap. The tiny but finite residual intensity at the Fermi level was also found in low-energy photoemission spectra Arita et al. (2008). Hence, it is particularly important to identify the intra-gap features that are responsible for the anomalous ground state properties of FeSi and to compare them with the prediction of existing theories Anisimov et al. (1996); Mazurenko et al. (2010); Figueira and Franco (2007); Franco et al. (2009); Jarlborg (2007).
In this Letter we report on the first direct measurements of the complex optical conductivity of FeSi in the low-frequency range , supplemented by broad-range experiments in an unprecedented large spectral range from 10 Hz to Hz. We identify a spin-polaronic resonance in the middle of the energy gap that is split by the exchange field T. Excitations between these electronic levels lead to an anomalous contribution to around . From the comparison between the intra-gap excitation parameters of FeSi, SmB6 and YbB12 Gorshunov et al. (1999); Sluchanko et al. (2000); Gorshunov et al. (2006) we conclude that the low-temperature optical properties of these compounds cannot be accounted for within the Kondo insulator model.
Single crystals of FeSi under investigation were grown by Czochralski technique. The samples were cut and subsequently polished by abrasive diamond powder. The fragility of the crystals constituted a limit of how thin the samples could be polished (about 35 to 50 m). In order to remove the surface defects induced by polishing, the specimens were etched in the mixture of hydrofluoric, nitric and acetic acids taken at the ratio of 2:3:2. Note, of polished crystals exceeds that of etched samples by more than two orders of magnitude (Fig. 2), we limited our optical studies to thoroughly etched samples.
A quasioptical THz spectrometer based on backward wave oscillators Gorshunov et al. (1999) was employed to measure the transmission and phase spectra in the spectral range from 8 to 40 cm-1 at temperatures K. From these quantities the complex optical conductivity is calculated. Additional infrared reflection measurements were conducted with a Bruker IFS 113V () complemented by a spectrometric ellipsometer (Woollam VASE, up to ). The microwave conductivity was measured by cavity-perturbation technique at fixed frequencies 9.5, 35 and 100 GHz using Gunn diodes as radiation sources. Radiofrequency investigations ( MHz) were carried out utilizing a HP Impedance Analyzer HP4191A. Standard four-probe technique was applied to obtain used as reference data at zero frequency. The Kramers-Kronig analysis of the infrared reflectivity spectra was performed by utilizing the directly measured values of and below and above the infrared range. Eventually we obtained a very wide panorama of the optical conductivity () and of the dielectric function .
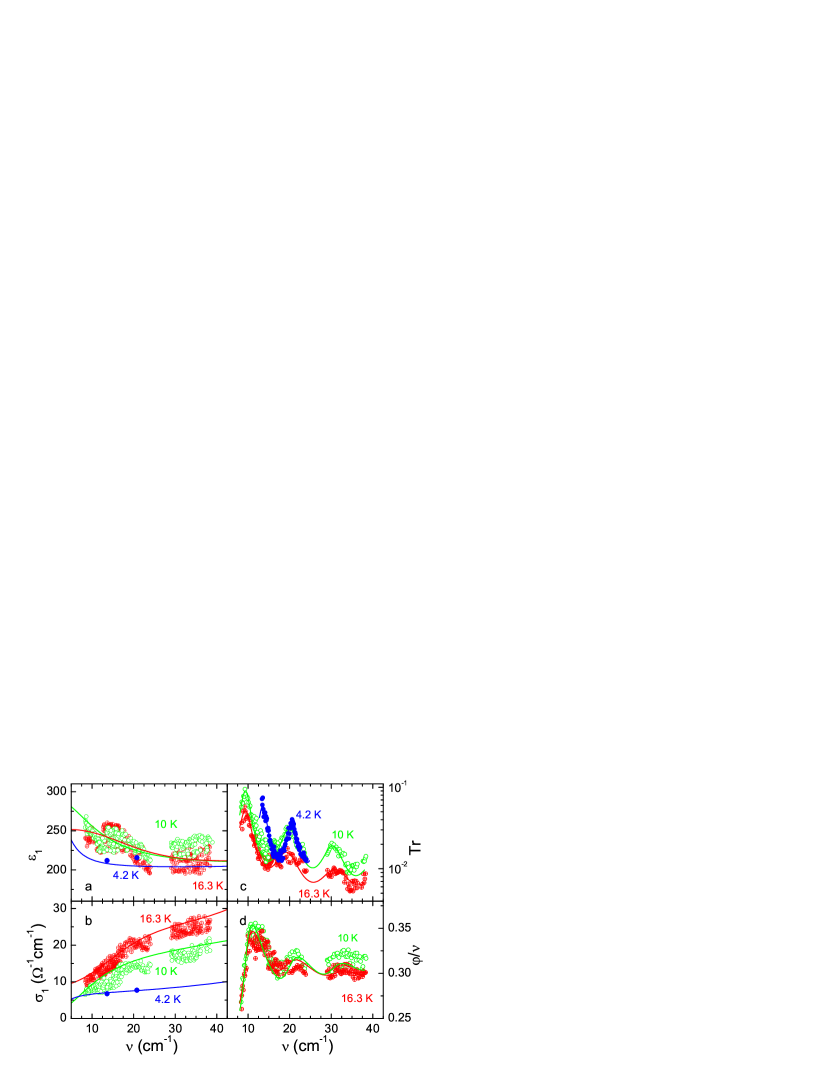
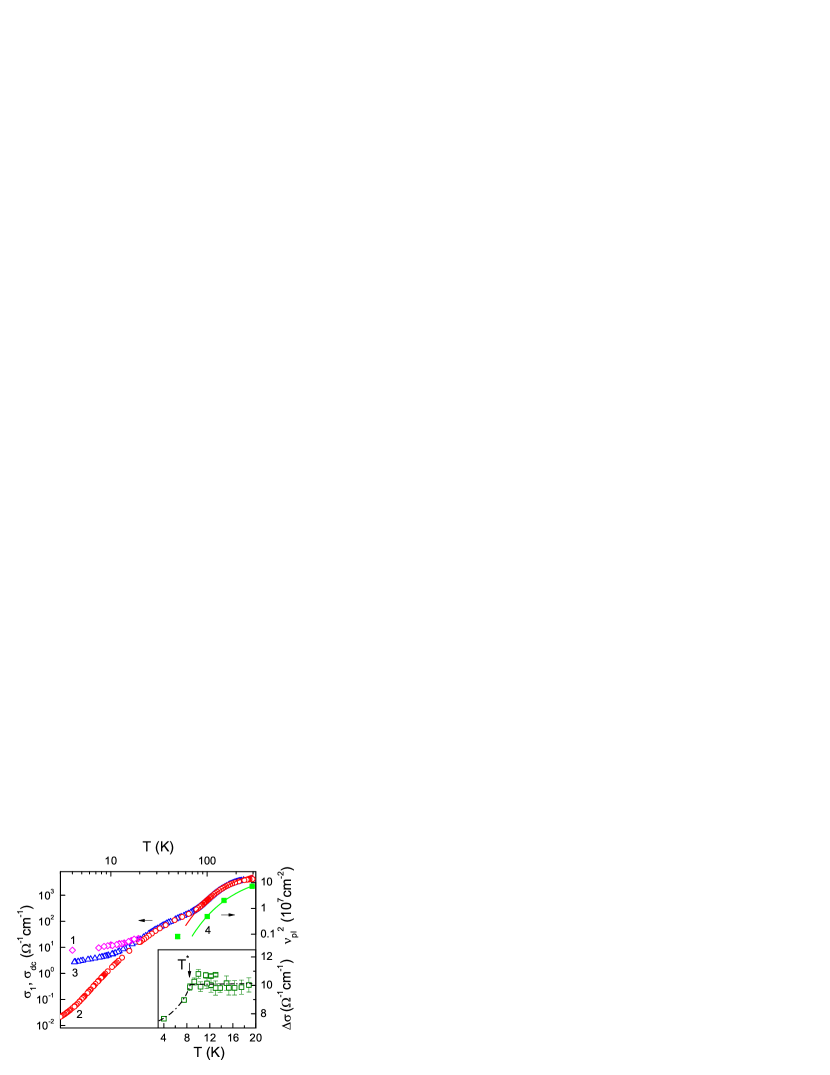
Figure 1 presents the spectra of and directly calculated Gorshunov et al. (1999) from the frequency dependent transmission (panel c) and phase shift (panel d). Due to the large refractive index of and relatively low absorption the interference within these very thin samples causes well resolved fringes. The dispersion of the ac-conductivity in the terahertz range from 17 to 40 cm-1 [Fig. 1(b)] is small compared to that caused by the tails of optical conductivity expected from interband transitions or infrared optical phonons Yu and Cardona (2010). The optical conductivity decreases even further when falls below 20 K [Fig. 1(b)]. The comparison of with the dc data is plotted in Fig. 2. At low temperatures the terahertz conductivity saturates at a rather high value of approximately ; about two orders of magnitude above the conductivity. Note the rather large difference between the conductivity of etched and polished sample (curves 2 and 3 in Fig. 2). It demonstrates that surface defects can mask the intrinsic properties of FeSi in optical, transport and photoemission studies.
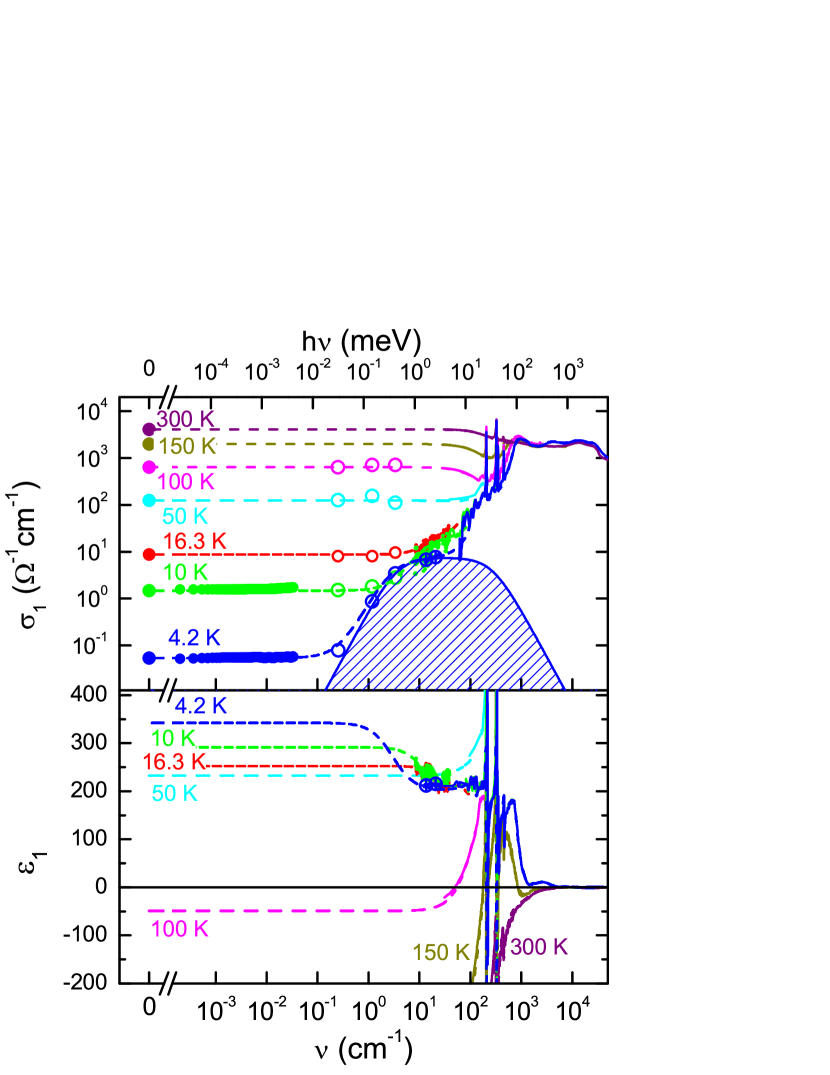
An essential information about low-energy electrodynamics of FeSi can be extracted from the wide-range spectra of () and () plotted in Fig. 3. The evolution of () shows that the Drude contribution becomes gradually weaker as the temperature is lowered; below 100 K no Drude roll-off can be resolved in the gap any more. Correspondingly the low-frequency dielectric constant becomes positive at K; this provides evidence that the compound enters an insulating state at low temperature. Most important for the present Communication, when drops below 20 K () exhibits a wide step-like feature between 0.1 and 10 cm-1 that is accompanied by a corresponding step in .
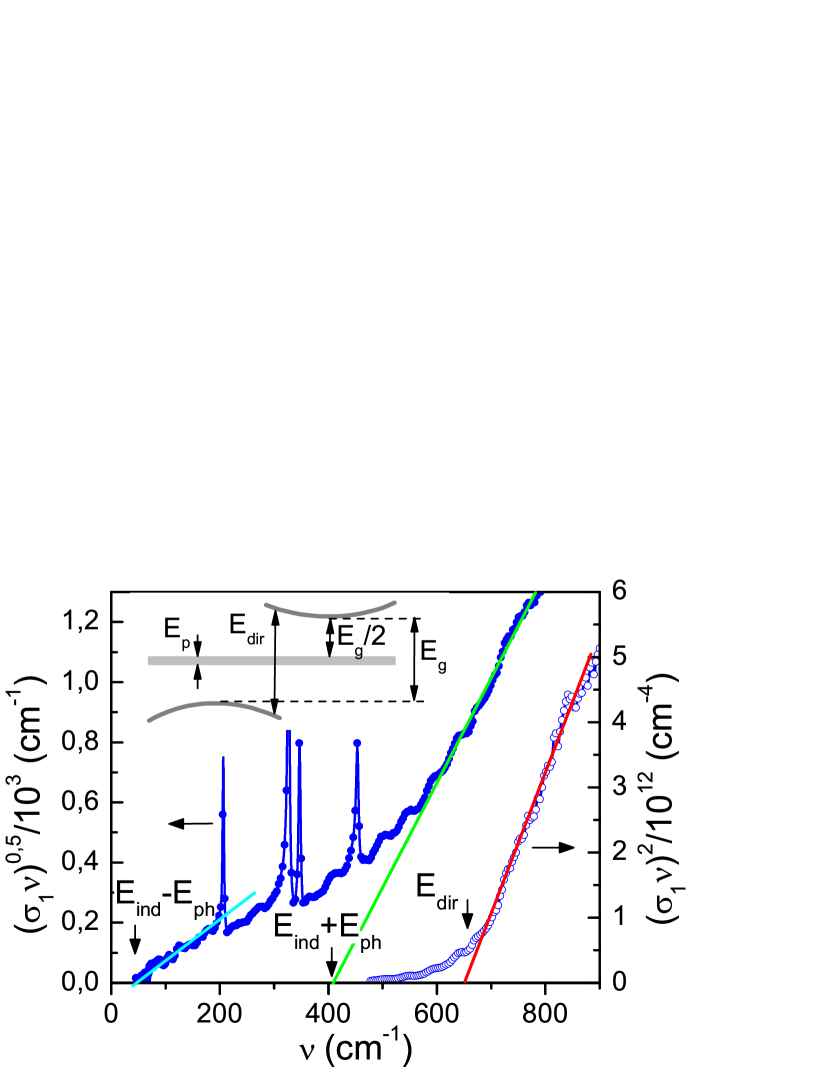
Applying the scaling relations Yu and Cardona (2010) and (here is the characteristic phonon energy), we obtain the direct and indirect energy gaps at =4.2 K as depicted in Fig.4. The value of (corresponding to 81 meV) confirms previous reports Schlesinger et al. (1993); Menzel et al. (2009). However, combining (5.5 meV) with (51 meV) results in a rather low value of (28.4 meV), which is only half of the energy gap meV reported previously based on transport measurements Schlesinger et al. (1993); Sluchanko et al. (2000); Corti et al. (2003) (Fig.2). Note also that the obtained characteristic phonon frequency agrees very well the mode () that shows the largest broadening with increasing temperature due to strong electron-phonon interaction Racu et al. (2007).
In order to clarify the discrepancy between transport gap ( meV) and indirect optical gap ( meV) we fit the conductivity and dielectric data, and , by the sum of Drude and Lorentz terms Dressel and Grüner (2002):
| (1) |
where , and are plasma frequency and scattering rate of charge carriers, , , and are eigenfrequency, dielectric contribution and damping (for th Lorentzian), respectively. The fits are shown by dashed lines in Fig. 3. The number of Lorentz contributions was chosen minimal to describe the dispersion due to optical phonons and interband transitions; the estimated parameters of the features agree well with previous attempts Schlesinger et al. (1993); Menzel et al. (2009). The Drude contribution to the fit yields a plasma frequency that follows the activation law with meV for K (Fig. 2). This observation proves that charge carriers are thermally excited from the lower to the upper band. The energy gap of FeSi eventually becomes irrelevant but its size does not change with increasing temperature. Along these lines, the lower value of meV corresponds to a finite density of states inside the gap rather than to a shift of bands. This suggestion is supported by the broad absorption identified in the terahertz conductivity for K (Fig. 3). Comparing the Lorentzian parameters listed in Tab. 1 we see that and increase with lowering temperature while stays approximately constant ( meV). Note that the enormous increase of the damping from meV to 35 meV when the temperature is reduced from 16 to 4.2 K rules out the assignment of this broad feature to excitations from extrinsic defects or impurity band.
In order to obtain a better insight into the origin of the anomalous terahertz contribution to the optical response, let us consider the excess conductivity plotted in the inset of Fig. 2. At temperatures K is approximately constant; but below K it drops rapidly down to . It is important to note that the value of is very close to the “freezing” temperature of interacting quasiparticles K found previously from transport and magnetic studies Glushkov et al. (2004). These quasiparticles (i.e. spin polarons) correspond to the states of the many-body resonance (of width meV), which appears at the Fermi level below 80 K due to on-site Hubbard repulsion Sluchanko et al. (2000). This now explains the smaller value of the indirect gap that defines the position of this resonance in the middle of the energy gap (see inset in Fig. 4).
| (K) | (cm-1) | (cm-1) | |
|---|---|---|---|
| 4.2 | |||
| 10 | |||
| 16.3 |
We can conclude that in FeSi due to strong on-site Coulomb repulsion below K a many-body resonance appears in the electronic density of states right in the middle of the energy gap Sluchanko et al. (2000). The exchange field of T splits the band, and spin excitations between the resultant electronic levels cause the anomalous terahertz contribution to the optical conductivity of FeSi. The inherent resonance width meV corresponds to the binding energy of spin polaronic states Sluchanko et al. (2000) The extremely large damping meV) is an estimate of the spin-fluctuation rate.
This approach allows us to interpret the terahertz feature in the spectra: since the energy of the mode is extremely low (), we probe excitation within the intra-gap many-body resonance. Using the oscillator strength (Tab. 1) and effective mass , we can estimate the particles concentration that contribute to the terahertz absorption at K. The remarkable agreement of with the effective concentration of the many-body states Sluchanko et al. (2000); Glushkov et al. (2004) strongly supports a spin-polaronic ground state of FeSi. The terahertz absorption can then be associated with intra-gap excitations between the electronic levels split by the exchange field T, which agrees well with the value of T previously estimated from magnetic studies Sluchanko et al. (2002). The very large damping meV at low temperatures indicates strong spin fluctuations that cause transitions between the excited spin states and the ground state with a relaxation time s. Both, the low concentration and the large damping below 10 K make it difficult to detect this feature in photoemission experiments Klein et al. (2008); Arita et al. (2008).
Furthermore, our finding gives us now the possibility to distinguish also between different types of intra-gap excitations observed in the far infrared spectra of other strongly correlated electron systems identified as Kondo insulators Aeppli and Fisk (1992); Riseborough (2000). Similar features have been observed in the spectra of SmB6 Gorshunov et al. (1999); Sluchanko et al. (2000) and YbB12 Gorshunov et al. (2006) and are ascribed to exciton-polaronic states that appear in the gap due to charge fluctuations. The parameters of the Lorentz terms extracted for SmB6 (, and Gorshunov et al. (1999); Sluchanko et al. (2000)) and YbB12 (, and Gorshunov et al. (2006)) characterize the exciton-polaronic complexes that arise from the coupling of itinerant electrons to soft valence fluctuations Kikoin and Mishchenko (1995). The characteristic times of charge fluctuations ( s for SmB6 and YbB12) and spin fluctuations ( s for FeSi) are significantly different because of the different origin of the ground states. Further theoretical treatments are required to thoroughly understand this novel aspect of strongly correlated electron systems.
Acknowledgements.
The authors are grateful to Prof. A.A.Menovsky for the grown FeSi single crystals. This work was supported by RAS Programme “Strongly Correlated Electrons” and Federal Programme “Scientific and Educational Human Resources of Innovative Russia”.References
- Aeppli and Fisk (1992) J. Aeppli and Z. Fisk, Comments Condens. Matter Phys., 16, 155 (1992).
- Riseborough (2000) P. S. Riseborough, Adv. Phys., 49, 257 (2000).
- Schlesinger et al. (1993) Z. Schlesinger, Z. Fisk, H.-T. Zhang, M. B. Maple, J. DiTusa, and G. Aeppli, Phys. Rev. Lett., 71, 1748 (1993).
- Degiorgi et al. (1994) L. Degiorgi, M. B. Hunt, H. R. Ott, M. Dressel, B. J. Fenstra, G. Grüner, Z. Fisk, and P. Canfield, Europhys. Lett., 28, 341 (1994).
- Mena et al. (2006) F. P. Mena, J. F. DiTusa, D. van der Marel, G. Aeppli, D. P. Young, A. Damascelli, and J. A. Mydosh, Phys. Rev. B, 73, 085205 (2006).
- Jaccarino et al. (1967) V. Jaccarino, G. K. Wertheim, J. H. Wernick, L. R. Walker, and S. Arajs, Phys. Rev., 160, 476 (1967).
- Takahashi (1997) I. Takahashi, Journal of Physics: Condensed Matter, 9, 2593 (1997).
- Fu and Doniach (1995) C. Fu and S. Doniach, Phys. Rev. B, 51, 17439 (1995).
- Anisimov et al. (1996) V. I. Anisimov, S. Y. Ezhov, I. S. Elfimov, I. V. Solovyev, and T. M. Rice, Phys. Rev. Lett., 76, 1735 (1996).
- Mazurenko et al. (2010) V. V. Mazurenko, A. O. Shorikov, A. V. Lukoyanov, K. Kharlov, E. Gorelov, A. I. Lichtenstein, and V. I. Anisimov, Phys. Rev. B, 81, 125131 (2010).
- Figueira and Franco (2007) M. Figueira and R. Franco, Eur. Phys. J. B, 58, 1 (2007).
- Franco et al. (2009) R. Franco, J. Silva-Valencia, and M. Figueira, Eur. Phys. J. B, 67, 159 (2009).
- Zur et al. (2007) D. Zur, D. Menzel, I. Jursic, J. Schoenes, L. Patthey, M. Neef, K. Doll, and G. Zwicknagl, Phys. Rev. B, 75, 165103 (2007).
- Klein et al. (2008) M. Klein, D. Zur, D. Menzel, J. Schoenes, K. Doll, J. Röder, and F. Reinert, Phys. Rev. Lett., 101, 046406 (2008).
- Menzel et al. (2009) D. Menzel, P. Popovich, N. N. Kovaleva, J. Schoenes, K. Doll, and A. V. Boris, Phys. Rev. B, 79, 165111 (2009).
- Sluchanko et al. (2000) N. E. Sluchanko, V. V. Glushkov, S. V. Demishev, M. V. Kondrin, K. M. Petukhov, N. A. Samarin, V. V. Moshchalkov, and A. A. Menovsky, EPL (Europhysics Letters), 51, 557 (2000a).
- Sluchanko et al. (2002) N. E. Sluchanko, V. V. Glushkov, S. V. Demishev, A. A. Menovsky, L. Weckhuysen, and V. V. Moshchalkov, Phys. Rev. B, 65, 064404 (2002).
- Corti et al. (2003) M. Corti, S. Aldrovandi, M. Fanciulli, and F. Tabak, Phys. Rev. B, 67, 172408 (2003).
- Arita et al. (2008) M. Arita, K. Shimada, Y. Takeda, M. Nakatake, H. Namatame, M. Taniguchi, H. Negishi, T. Oguchi, T. Saitoh, A. Fujimori, and T. Kanomata, Phys. Rev. B, 77, 205117 (2008).
- Jarlborg (2007) T. Jarlborg, Phys. Rev. B, 76, 205105 (2007).
- Gorshunov et al. (1999) B. Gorshunov, N. Sluchanko, A. Volkov, M. Dressel, G. Knebel, A. Loidl, and S. Kunii, Phys. Rev. B, 59, 1808 (1999).
- Sluchanko et al. (2000) N. E. Sluchanko, V. V. Glushkov, B. P. Gorshunov, S. V. Demishev, M. V. Kondrin, A. A. Pronin, A. A. Volkov, A. K. Savchenko, G. Grüner, Y. Bruynseraede, V. V. Moshchalkov, and S. Kunii, Phys. Rev. B, 61, 9906 (2000b).
- Gorshunov et al. (2006) B. Gorshunov, P. Haas, O. Ushakov, M. Dressel, and F. Iga, Phys. Rev. B, 73, 045207 (2006).
- Yu and Cardona (2010) P. Y. Yu and M. Cardona, Fundamentals of Semiconductors (Springer, 2010).
- Racu et al. (2007) A.-M. Racu, D. Menzel, J. Schoenes, and K. Doll, Phys. Rev. B, 76, 115103 (2007).
- Dressel and Grüner (2002) M. Dressel and G. Grüner, Electrodynamics of Solids (Cambridge University Press, 2002).
- Glushkov et al. (2004) V. V. Glushkov, I. Voskoboinikov, S. V. Demishev, I. Krivitskii, A. A. Menovsky, V. V. Moshchalkov, N. Samarin, and N. E. Sluchanko, JETP, 99, 394 (2004).
- Kikoin and Mishchenko (1995) K. A. Kikoin and A. S. Mishchenko, J. Phys.: Condens. Matter, 7, 307 (1995).