The current star formation rate of K+A galaxies
Abstract
We derive the stacked 1.4 GHz flux from FIRST (Faint Images of the Radio Sky at Twenty Centimeters) survey for 811 K+A galaxies selected from the SDSS DR7. For these objects we find a mean flux density of Jy. A similar stack of radio-quiet white dwarfs yields an upper limit of 43 Jy at a 5 significance to the flux in blank regions of the sky. This implies an average star formation rate of 1.6 0.3 M⊙ year-1 for K+A galaxies. However the majority of the signal comes from 4% of K+A fields that have aperture fluxes above the noise level of the FIRST survey. A stack of the remaining galaxies shows little residual flux consistent with an upper limit on star formation of 1.3 M⊙ year-1. Even for a subset of 456 ‘young’ (spectral ages 250 Myr) K+A galaxies we find that the stacked 1.4 GHz flux is consistent with no current star formation. Our data suggest that the original starburst has been terminated in the majority of K+A galaxies, but that this may represent part of a duty cycle where a fraction of these galaxies may be active at a given moment with dusty starbursts and AGNs being present.
Subject headings:
galaxies: starburst — galaxies: evolution — radio continuum: galaxies1. Introduction
K+A galaxies, also known as post-starburst galaxies (PSG), show spectra of a strong Balmer absorption series superposed over a K-giant dominated spectrum typical of early-type galaxies, implying the recent termination ( Gyr) of a significant episode of star formation in an otherwise quiescent stellar population (Dressler & Gunn, 1983; Couch & Sharples, 1987). These objects may be the best examples of galaxies transitioning from the ‘blue cloud’ (of star-forming objects) to the ‘red sequence’, and have often been identified as possible progenitors of the lenticular population in clusters (Yang et al., 2004, 2008), rejuvenated early-type galaxies (e.g., Panuzzo et al. 2007) or the descendants of the blue galaxies observed in intermediate redshift clusters (Zabludoff et al., 1996; Poggianti et al., 1999).
The mechanism by which star formation is initiated and/or quenched in these galaxies is still unclear. The majority of local K+A galaxies lie in the general field rather than clusters (Blake et al., 2004; Goto, 2007; Vergani et al., 2010) and the processes that trigger and halt star formation may differ in these environments. At the same time, in the intermediate redshift clusters where K+A galaxies were originally discovered, a significant fraction of current star formation is obscured by dust (Duc et al., 2002; Saintonge et al., 2008; Dressler et al., 2009; Haines et al., 2009). Dusty starbursts tend to have strong Balmer absorption but only weak OII emission as the young stars and HII regions that produce the emission lines tend to lie in regions of high extinction while the longer lived A-stars can migrate out of their native molecular cloud: this would be a viable model to explain the K+A spectral class (Poggianti & Wu, 2000). Therefore it is still unclear whether K+A galaxies are truly “red and dead,” although the 24m observations of Dressler et al. (2009) in Abell 851 imply that star formation has largely ceased in these objects.
Obscured star formation may also be detected via radio emission at 20 cm (1.4 GHz), which is produced by synchrotron radiation from high energy cosmic rays originating in supernova shells and yields a measure of the massive star formation rate (Condon, 1992; Kennicutt, 1998). Although Smail et al. (1999) found evidence of recent star formation in 5 K+A galaxies, other studies find little evidence of ongoing star formation within small samples (Miller & Owen, 2001; Goto, 2004). However, Buyle et al. (2006) found that most K+A have substantial gas reservoirs, similar to those of spirals of the same luminosity, and suggest that K+A galaxies may be observed during a hiatus in an episodic star formation history or that current star formation may be obscured.
In this Letter we use a stack of radio images to further test the current star formation rate and/or AGN activity in spectroscopically selected K+A galaxies. A description of the data and the analysis is provided in the next section, while we interpret and discuss our results in section 3. We adopt the latest WMAP cosmological parameters with , and H km s-1 Mpc-1.
2. FIRST radio stacking of the SDSS DR7 K+A sample
We select a sample of 811 K+A galaxies from the Data Release 7 of the SDSS (York et al., 2000; Abazajian et al., 2009) using an updated catalog of Goto (2007). Only objects classified as galaxies with a spectroscopic signal-to-noise per pixel are considered. The selection criteria of K+A galaxies are equivalent widths of H Å, H Å and [OII] Å, where emission lines are negative. Galaxies of redshift are excluded from the sample due to the Å sky feature. The selected sample of K+A galaxies have redshifts ranging .
We then use data from the FIRST survey (Becker et al., 1995) to derive a mean radio image of K+A galaxies. Typical detection limits for a single FIRST image are 1 mJy, which, for the mean redshift from our SDSS DR7 sample of K+A galaxies, would only allow us to detect star formation rates in excess of 30 M⊙ yr-1.
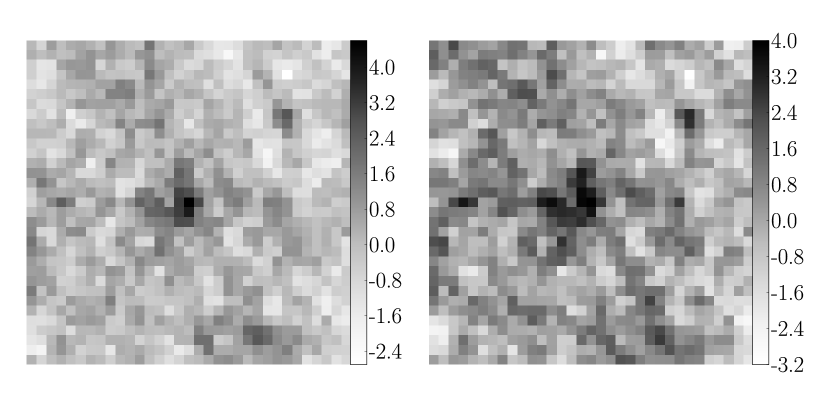
For each of the 811 K+A galaxies covered by the survey we cut out a square from the FIRST database. We use the median stacking method of White et al. (2007) to create the resulting image of 811 K+A galaxies shown in the left panel of Fig. 1. We then measure the flux from the combined image in an aperture equivalent to three FIRST beams from which we derive an average K+A flux of Jy.
To assess the significance of this result, we need to estimate the level of noise in the image. As FIRST is a survey, the image cutouts may not be fully cleaned of artifacts, such as side-lobes from distant radio sources. To do this, we use a Monte Carlo simulation with a sample of known radio-quiet objects, 8495 white dwarfs from the SDSS (Eisenstein et al., 2006). We create 10,000 stacks of 811 randomly selected white dwarfs (equivalent to the stack of K+A galaxies) and measure the flux in the same fashion to derive the mean flux from a supposedly radio-quiet sample.
This procedure allows us to estimate the level of noise present in the stacked image and therefore to determine the significance of our detection for K+A galaxies. A histogram of the fluxes from our Monte Carlo simulation is shown in Fig. 2. Since we know that these sources are radio quiet, we can estimate a significance flux for sources to be considered real. We find this flux to be Jy. Our K+A stack is found to have a significant detection above the 5 noise level.

We can now compute the absolute luminosity at 1.4 GHz using our chosen cosmology and the average redshift of the K+A galaxies ().
| (1) |
where is the luminosity distance, is the flux density, is the color correction and the bandwidth correction (Morrison et al., 2003). We assume that the radio emission is dominated by synchrotron radiation such that (Condon, 1992). This yields our measurement of radio power, which we can convert to a SFR using
| (2) |
from Yun et al. (2001), which assumes a Salpeter initial mass function between 0.1 and 100 solar masses. This yields a star formation rate of M⊙ yr-1 for our average K+A galaxy at .
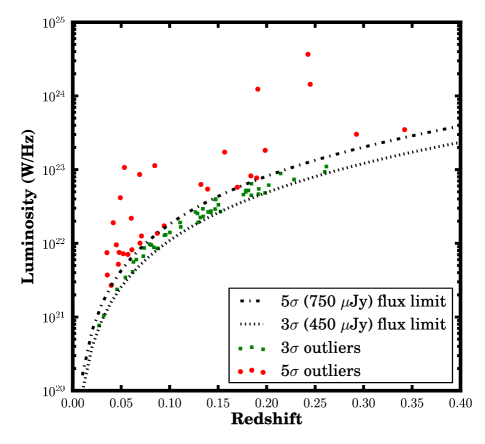
However 79 of our sources are measured to have 1.4 GHz fluxes above the 3 noise level of the FIRST survey. The FIRST beam has an RMS of 0.15 mJy and we find 79 galaxies (10%) have aperture fluxes in excess of 3 (450 Jy) within an aperture of 3 beamsizes, 31 of which have fluxes in excess of 5 (750 Jy).
In Fig. 3 we show the redshift–luminosity distribution of the targets with aperture fluxes above the and limits. Visual inspection of these individual outlier frames have shown that for the 31 galaxies above the 5 limit, about 80% look like clear individual detections (i.e., centrally concentrated, likely to be associated with our optical target, not in a frame that is significantly noisy), while for the 48 that are above the 3 limit but less than the 5 limit, only about 10% of these are clear detections. Overall only about 4% of our sample of 811 galaxies show evidence of significant ongoing radio activity, either from star formation or AGN activity.
Removing all sources with measured fluxes in excess of 5, we create a subsample of 780 galaxies. Stacking this subsample yields a mean flux of 36 Jy, which is well below the 5 detection limit of 47 Jy found from a Monte Carlo simulation creating stacks of 780 white dwarfs. We can place an upper limit on the SFR of M⊙ yr-1 for this subsample with .
When star formation ceases in a galaxy, we expect it to decrease exponentially to low levels, rather than an abrupt truncation, unless some ‘catastrophic’ event has removed all the available fuel or ionized the gas and prevented further star formation. Evidence for a rapid shutdown of star formation in these galaxies has been presented by Brown et al. (2009). We therefore carry out the same analysis on a subsample of ‘young’ K+A galaxies and attempt to detect residual star formation in these objects.
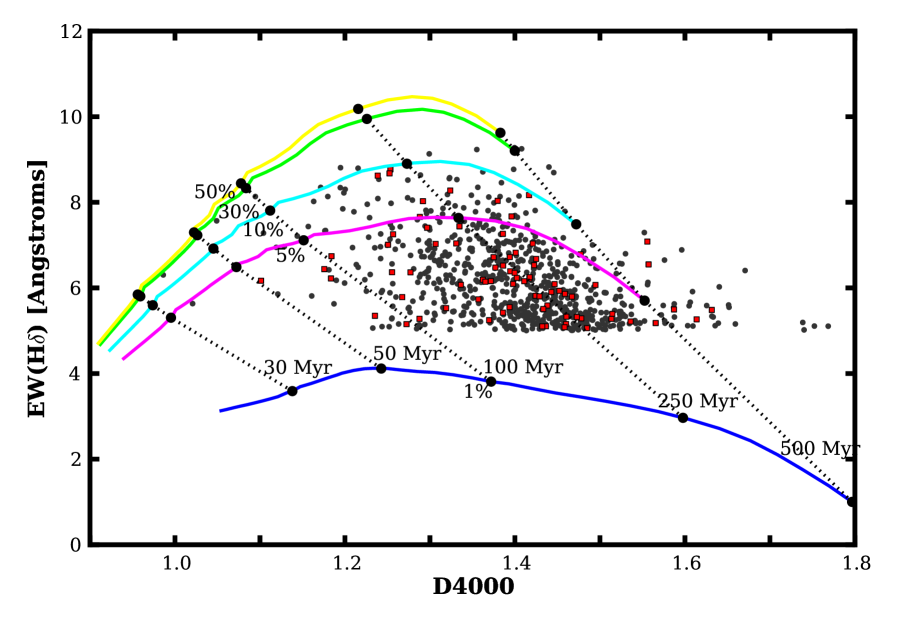
In Fig. 4, we plot H and D4000 from SDSS spectra and overplot models calculated with GALAXEV (Bruzual & Charlot, 2003). We plot the galaxies with significant 1.4 GHz detections as red squares, the rest as gray dots. We adopt a Salpeter initial mass function (IMF) and solar metallicity as initial conditions. The model galaxies evolved over 10 Gyr with an exponentially decreasing star formation rate ( = 1 Gyr). At 10 Gyr, we added an instantaneous starburst (delta function) of mass 1, 5, 10, 30 and 50% (relative to the old stellar population) after which the SFR returns to zero. The dotted lines demarcate the values of the spectral indices observed 30, 50, 100, 250 and 500 Myr after the burst. These are the same models used by Yagi et al. (2006) and Goto et al. (2008).
We then select the 456 K+A galaxies with burst ages less than 250 Myr and an average redshift of and stack these galaxies in the same fashion as the complete sample. The stacked image is shown in the right panel of Fig. 1 from which we measure a mean flux of 61 Jy. The Monte Carlo simulation with white dwarfs gives a 5 detection limit of 59 Jy. Our younger sample of K+A galaxies is found to be at the detection limit, giving a SFR of M⊙ yr-1. This is consistent with a rapid decline of star formation in these galaxies as shown by Brown et al. (2009).
3. Discussion
We have found an average star formation rate of only M⊙ yr-1 from stacking radio observations of 811 general field K+A galaxies in the local universe.
However, much of this signal appears to originate from 4% of active galaxies. Based on the definition of Sadler et al. (2002), which requires radio power above W Hz-1 and the absence of emission lines, this sample is approximately equally split between star forming galaxies and AGN (with the latter more prominent at higher redshifts because of selection effects).
For the remainder of the sample, we find an upper limit on the SFR of 1.4 M⊙ yr-1. Even a subsample of spectroscopically young galaxies does not show a significant detection of residual star formation.
Our results are in good agreement with previous work. Goto (2004) did not detect evidence of star formation from VLA observations in 36 galaxies drawn from the SDSS DR1 (Goto et al., 2003) but he was able to set an upper limit of M⊙ yr-1 for 15 of the nearest K+A galaxies. Miller & Owen (2001) found that only 2 out of 15 K+A galaxies in his sample show signs of obscured star formation. Nevertheless, Melnick & de Propris (2012) find that most K+A galaxies in this sample exhibit significant excess above the predicted stellar component at m from WISE data, suggesting that dust heated by some unknown source is present in these objects.
Buyle et al. (2006) pointed out that K+A galaxies contain significant amounts of gas and therefore the current quiescent star formation may only be temporary, while Poggianti & Wu (2000) proposed a model where star formation continues in K+A galaxies but is hidden by dust. However, Dressler et al. (2009) detected no 24 m emission for K+A galaxies in Abell 851.
Another possible contribution to the radio flux is that K+A galaxies may host an AGN. Most K+A galaxies have significant bulges (Yang et al., 2008) and therefore should contain a supermassive central black hole (e.g., Ferrarese & Merritt 2000). In the general field, K+A galaxies are often involved in mergers and interactions (Blake et al., 2004; Goto, 2005; Yang et al., 2008) and show inverted color gradients indicative of central star formation (Yang et al., 2008), which is expected if mergers drive gas to the center (Hernquist, 1989).
Liu et al. (2007) find evidence of a weak AGN in a nearby K+A galaxy. However, Shin et al. (2011) find only a few AGNs in a subset of our sample and they argue that these active nuclei are not related to the quenching of the previous starburst. Brown et al. (2009) argue that AGN feedback is only important among the more massive K+A galaxies. Vergani et al. (2010) find no evidence for AGN in their sample of COSMOS K+A galaxies using deep VLA and XMM imaging of the COSMOS field and only a small number of star forming objects, in agreement with our results. On the other hand Georgakakis et al. (2008) argued for a weak correlation between AGN and K+A galaxies in the EGS field.
Snyder et al. (2011) present a model where K+A galaxies originate from gas-rich mergers and the duration of the Balmer-line strong phase is shorter than the commonly assumed 1 Gyr by about a factor of 3. In this framework the 4% of ‘active’ galaxies that we find may be the tail end of the distribution, while other objects are already heading towards the red sequence. In this case, this might yield a constraint on the activity timescale, assuming a 0.3 Gyr duration for the K+A phenomenon. If the 4% of active galaxies represent the last gasp of activity before the AGN returns to a dormant state, the period of visible QSO activity may be estimated to be about 20 Myr, which is broadly consistent with current estimates (e.g., see review by Martini (2004)).
Another plausible explanation is that we are actually observing galaxies undergoing a series of starbursts and feedback episodes, as in the cycle postulated by Hopkins et al. (2008) to account for the tightness of the red sequence within a hierarchical formation framework. In which case we would be observing galaxies in the ‘on’ and ‘off’ phase of such a cycle.
Shioya et al. (2002) present a model where truncated spirals evolve through the e(a) (galaxy with strong H and modest OII emission), a+k and finally k+a phase before settling on the red sequence. If we are observing galaxies at random along their spectrophotometric transformation, and given the Gyr duration of the most visible k+a phase, the timescale for evolution of these galaxies on to the red sequence is long, Gyr, which is consistent with the above simulations. Only low mass objects can then truly evolve on to the red sequence in reasonable times.
A series of questions remain unanswered for future studies. Do K+A galaxies host on-going dusty starbursts? This appears unlikely in the light of our results, but the detection of powerful far infrared excesses by Melnick & de Propris (2012) points to the existence of extra sources of flux that are heavily obscured. What is the role of the AGN (if any) in modulating the rapid onset and decline of star formation? Do these objects contain cold gas and possibly re-initiate star formation? Future papers by our group will attempt to address some of these issues.
References
- Abazajian et al. (2009) Abazajan, K. et al. 2009, ApJS, 182, 543
- Becker et al. (1995) Becker, R. H., White, R. L., & Helfand, D. J., 1995, ApJ, 450, 559
- Blake et al. (2004) Blake, C. et al. 2004, MNRAS, 355, 713
- Brown et al. (2009) Brown, M. I. J. et al. 2009, ApJ, 703, 150
- Bruzual & Charlot (2003) Bruzual, G., & Charlot, S. 2003, MNRAS, 344, 1000
- Buyle et al. (2006) Buyle, P., Michielsen, S., De Rijcke, D., Pisano, D. J., Dejonghe, H. & Freeman, K. 2006, ApJ, 649, 163
- Cohen et al. (2007) Cohen, A. S., Lane, W. M., Cotton, W. D., Kassim, N. E., Lazio, T. J. W., Perley, R. A., Condon, J. J. & Erickson, W. C. 2007, AJ, 134, 1245
- Condon (1992) Condon, J. J. 1992, ARA&A, 30, 575
- Cordey (1987) Cordey, R. A. 1987, MNRAS, 227, 695
- Couch & Sharples (1987) Couch, W. J. & Sharples, R. M. 1987, MNRAS, 229, 423
- Dressler & Gunn (1983) Dressler, A. & Gunn, J. E. 1983, ApJ, 270, 7
- Dressler et al. (2009) Dressler, A., Rigby, J., Oemler, A., Fritz, J., Poggianti, B. M., Rieke, G. & Bai, L. 2009, ApJ, 693, 140
- Duc et al. (2002) Duc, P. A. et al. 2002, A&A, 382, 60
- Eisenstein et al. (2006) Eisenstein, D. J., et al., 2006, ApJS, 167, 40
- Ferrarese & Merritt (2000) Ferrarese, L. & Merritt, D. J. 2000, ApJ, 539, L9
- Georgakakis et al. (2008) Georgakakis, A. et al. 2008, MNRAS, 406, 420
- Goto et al. (2003) Goto, T. et al. 2003, PASJ, 55, 771
- Goto (2004) Goto, T. 2004, A&A, 427, 125
- Goto (2005) Goto, T. 2005, MNRAS, 357, 937
- Goto (2007) Goto, T. 2007, MNRAS, 381, 187
- Goto et al. (2008) Goto, T. , Yagi, M. & Yamauchi, C., 2008, MNRAS, 391, 700
- Haines et al. (2009) Haines, C. P. et al. 2009, ApJ, 704, 126
- Hernquist (1989) Hernquist, L. 1989, Nature, 340, 687
- Hopkins et al. (2008) Hopkins, P. F. et al. 2008, ApJS, 175, 390
- Kennicutt (1998) Kennicutt, R. C. 1998, ARA&A, 36, 189
- Liu et al. (2007) Liu, C. T., Hooper, E. J., O’Neil, K., Thompson, D., Wolf, M. & Lisker, T. 2007, ApJ, 658, 249
- Melnick & de Propris (2012) Melnick & de Propris, MNRAS, in preparation
- Miller & Owen (2001) Miller, N. A. & Owen, F. N. 2001, ApJ, 554, L25
- Martini (2004) Martini, P., 2004, Coevolution of Black Holes and Galaxies, 169
- Morrison et al. (2003) Morrison, G. E. et al. 2003, ApJS, 146, 267
- Panuzzo et al. (2007) Panuzzo, P. et al. 2007, ApJ, 656, 206
- Parma et al. (2007) Parma, P., Murgia, M., de Ruiter, H. R., Fanti, R., Mack, K.-H. & Govoni, F. 2007, A&A, 470, 875
- Poggianti et al. (1999) Poggianti, B. M. et al. 1999, ApJ, 518, 576
- Poggianti & Wu (2000) Poggianti, B. M. & Wu, H. 2000, ApJ, 529, 157
- Sadler et al. (2002) Sadler, E. M. et al. 2002, MNRAS, 329, 227
- Saintonge et al. (2008) Saintonge, A., Tran, K.-V. H. & Holden, B. P. 2008, ApJ, 685, L113
- Shin et al. (2011) Shin, M.-S., Strauss, M. A. & Tojeiro, R. 2011, MNRAS, 410, 1583
- Smail et al. (1999) Smail, I. et al. 1999, ApJ, 525, 609
- Shioya et al. (2002) Shioya, Y., Bekki, K., Couch W. J., De Propris, R. 2002, ApJ, 565, 223
- Snyder et al. (2011) Snyder et al. 2011, ApJ, 741, 77
- Vergani et al. (2010) Vergani, D. et al. 2010, A&A, 509, 42
- White et al. (2007) White, R. L., Helfand D.J., Becker R.H., Glikman E. & de Vries W., 2007, ApJ, 654, 99
- Yagi et al. (2006) Yagi, M., Goto, T. & Hattori., T., 2006 ApJ, 624, 152
- Yang et al. (2004) Yang, Y., Zabludoff, A., Zaritsky, D., Lauer, T. R. & Mihos, C. 2004, ApJ, 607, 258
- Yang et al. (2008) Yang, Y., Zabludoff, A., Zaritsky, D. & Mihos, C. 2008, ApJ, 688, 965
- York et al. (2000) York, D. G. et al. 2000, AJ, 120, 1579
- Yun et al. (2001) Yun, M. S., Reddy, N. A. & Condon, J. J. 2001, ApJ, 554, 803
- Zabludoff et al. (1996) Zabludoff, A. I. et al. 1996, ApJ, 466, 104