The UV-Continuum properties of Ly-Selected Galaxies at
Abstract
We report the first space-based very deep near-infrared continuum observations of a uniform sample of galaxies with log(L(L)) erg s-1 selected from narrow-band line searches and with spectroscopically confirmed Ly emission. The 1.4m HST WFC3 observations are deep enough (AB() to measure individual continuum magnitudes at this redshift for all of the objects. We compare the results with continuum-selected samples at the same redshift and find that Ly emission is present in of all galaxies with at . The error in this quantity is dominated by systematic uncertainties, which could be as large as multiplicative factors of three. The Ly galaxies are extended but small (size ), and have star formation rates of approximately . We find a mean at 1400 Å of 0.08, with the seven objects showing a range from 0.026 to 0.26, implying that there is little sign of destruction of the Ly line. All of the properties of the sample appear to be very similar to those of Ly emitters at lower redshifts.
Subject headings:
cosmology: observations — early universe — galaxies: evolution — galaxies: formation — galaxies: high redshift1. Introduction
At all redshifts from to a fraction of galaxies can be detected in the Lyman alpha line of hydrogen (e.g. Cowie and Hu 1998; Deharveng et al. 2008; Hu et al. 2010; Ouchi et al. 2010; Vanzella et al. 2010). The Ly line is easily detected in narrow-band imaging or blind spectroscopic surveys, and Ly emission-line searches have been widely used to find high redshift galaxies. In addition, for the highest redshift galaxies, this line is the only spectroscopic signature that can be used to confirm the redshift of a galaxy selected on the basis of color properties. However, Ly is a difficult line to interpret. Because the line is resonantly scattered by neutral hydrogen, determining its escape path and therefore its dust destruction is an extremely complex problem both theoretically (e.g., Neufeld 1991; Finkelstein et al. 2007) and observationally (e.g., Kunth et al. 2003; Schaerer & Verhamme 2008, Östlin et al. 2009). It is therefore critical to determine the ultraviolet continuum properties of the Ly emitting galaxies (LAEs) in order to understand how to interpret them in terms of physical quantities such as the star-formation rate and to relate them to UV-continuum selected samples at the same redshift (e.g., Bouwens et al. 2010).
Extending this measurement to the highest redshifts possible is of considerable interest because the LAEs may be used as probes of the structure of the intergalactic gas at (e.g., Dijkstra & Wyithe 2010, Tilvi et al. 2010, Dayal et al. 2011, Laursen et al. 2011). Since Ly photons resonantly scatter off of neutral hydrogen, the Ly emission from galaxies scatters from the line of sight as it propagates through the intergalactic medium (e.g. Loeb & Rybicki 1999; Zheng et al. 2010) potentially reducing the strength of the observed Ly. Thus the frequency of Ly emitters relative to the UV continuum-selected galaxy population is potentially a function of the degree of ionization of the intergalactic medium and could be used to probe the epoch of reionization of the universe, at redshift (e.g. Stark et al. 2010, 2011).
Here we extend the measurement of the UV-continuum properties of the LAEs to , the highest redshift where substantial samples of these objects exist, using very deep near-infrared continuum observations of a uniform sample of LAEs obtained with the WFC3 camera on HST. These are the first observations deep enough to measure individual continuum magnitudes at this redshift for all the objects in this population and we find that their UV-continuum properties and the fraction of Ly emitters relative to UV-continuum selected samples are very similar to that seen at lower redshift. The observations show no indication that the onset of reionization is at .
2. Observations
We obtained (rest frame ) continuum detections for a sample of 7 Ly emitters (LAEs) at in a 600 arcmin2 region centered on the massive galaxy cluster Abell 370. The sample was drawn from Hu et al.’s (2010) Ly spectroscopic atlas of 88 and 30 galaxies. The Hu et al. Ly emitters were chosen based on their narrow-band excess and their broad-band colors in very deep images obtained with the Suprime camera on the Subaru 8m telescope. They were then spectroscopically confirmed using the DEIMOS spectrograph on the Keck 10m telescope. They form a sample of objects with Ly rest frame equivalent widths above 20Å and log(L(L)) erg s-1 in the selected redshift interval. These objects have narrow Ly emission lines (velocity widths 150 – 300 ) and, as we shall show below, while they are small, they are marginally spatially extended in the present observations. We therefore assume that they are powered by star formation and not by an active galactic nucleus.
We used the WFC3 camera on with the F140W filter to obtain observations of all of the objects in the A370 field of that survey. Each of the galaxies was observed for 2 orbits using the F140W filter of the WFC3 camera on HST (Mackenty et al. 2010). A four point dither pattern was used and repeated 3 times, giving a total exposure time of 4235s for each field. We used the combined drizzled images together with the calibration produced by the HST pipeline, but then removed a further background determined from the median average of the fields. The measured FWHM for faint stars in the images is 0.22 arcseconds. As we shall discuss below, the galaxies are small so, given the high spatial resolution of the HST images, we used diameter magnitudes and corrected these to approximate total magnitudes using an offset of 0.15 magnitudes computed from the enclosed energy curves of the instrument. We measured the noise in the images by measuring the fluxes in random blank sky positions and found a noise level of 28.75 for the corrected diameter magnitudes.
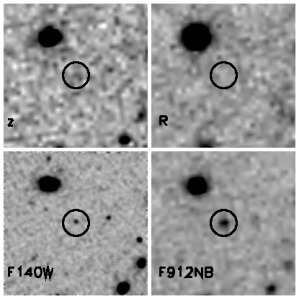
All of the galaxies in the sample were detected; a typical example is shown in Figure 1. The faintness of the image, even in a very deep z band exposure such as that shown ( AB), illustrates the difficulty of making accurate continuum measuruments from the ground. The observed continuum magnitudes and other quantities are listed in Table 1. The first detected galaxy, HCM6A (Hu et al. 2002), is a member of the sample and since this galaxy lies in the strong-lensing region of A370, for this object we also give the values corrected for lensing amplification (quantities in parentheses in Table 1). All of the remaining galaxies lie far outside the strong lensing region and have negligible amplification.
| Name | RA(2000) | Dec(2000) | Redshift | ) | maga | Rest EWb |
|---|---|---|---|---|---|---|
| (erg s-1) | (AB) | (Å) | ||||
| HC023927-013523 | 39.863293 | -1.589833 | 6.450 | 42.73 | ||
| HC023939-013432 | 39.914417 | -1.575667 | 6.549 | 42.76 | ||
| HC023939-013451 | 39.914791 | -1.581028 | 6.531 | 42.90 | ||
| HC023949-013121 | 39.956711 | -1.522667 | 6.564 | 42.99 | ||
| HCM6A | 39.978001 | -1.559111 | 6.559 | 43.41(42.75c) | ||
| HC024001-014100 | 40.007500 | -1.683388 | 6.545 | 42.72 | ||
| HC024004-012252 | 40.017708 | -1.381278 | 6.502 | 42.62 | ||
| HC123607+620838 | 189.033004 | 62.14394 | 5.640 | 42.95 | ||
| HC123558+621017 | 189.045471 | 62.17144 | 5.672 | 42.58 | ||
| HC123613+620748 | 189.056106 | 62.12994 | 5.635 | 42.95 | ||
| HC123651+621936 | 189.215240 | 62.32683 | 5.675 | 42.96 | ||
| HC123652+622152 | 189.216751 | 62.36460 | 5.689 | 42.92 | ||
| HC123717+621759 | 189.324677 | 62.29974 | 5.663 | 42.91 |
Note. — () Continuum magnitude in the AB system at () and (). () Rest-frame equivalent width of the Ly line calculated assuming a flat-fν spectrum for the continuum at wavelengths between Ly and (rest-frame; ) or (rest-frame; ). () Values corrected for lensing amplification.
For a comparison sample at chosen in the same way and with comparably deep continuum magnitudes, we took Hu et al.’s sample of six spectroscopically confirmed objects in the GOODS-N field, using published F850LP data obtained with the ACS on the (Giavalisco et al. 2004) to define our continuum magnitudes. The magnitudes and errors are the auto mags from the catalog of Giavalisco et al. (2004); they also provide a good representation of the total magnitude. The rest-frame wavelength corresponding to the pivot wavelength of this filter is 1350Å. While the F140W filter has no response at the Ly line, the F850LP filter has 10% of peak response at (Ly for ). However, the emission-line contribution to the continuum fluxes is small () even for the highest equivalent width (EW 140Å) galaxies. The properties of these objects are also listed in Table 1.
3. Discussion
The LAE galaxies at both and are extremely compact (Figure 2). For each redshift sample we formed a stack by summing all the images, centering on the peak flux. For the objects we excluded HCM6A, which is lensed, and HC023949013121, which lies close to a bright galaxy. A comparison of the stacked continuum images of the two samples with the point spread function (PSF) determined from faint spectroscopically confirmed stars in the two fields, shows that images at both redshifts are extended: the deconvolved FWHM is at and at , corresponding to sizes between 0.5 and 1 kpc. This is very similar to values measured for Ly emitters (LAEs) at (Bond et al. 2009, 2010), where both the UV continuum and the Ly emission are seen to be sub-kpc. The sizes are smaller than those found by Taniguchi et al. (2009) at but the Taniguchi measurements were made in a bandpass containing the Ly line and it is possible that this could be increasing the measured size in their sample if the Ly emission is more extended. The UV size measurements provide a reference for future measurements of the Ly sizes, which will allow us to measure the extent of the Ly scattering region in galaxies. Such measurements are difficult but may be possible with ground-based adaptive optics or space-based narrow-band measurements.

Figure 3 shows our primary result. For both samples we plot the ratio of Ly luminosity to continuum luminosity redward of Ly (or equivalently the rest-frame equivalent width of the Ly line, to which the ratio is approximately proportional [Dijkstra & Westra 2010]) as a function of Ly luminosity. Following Stark et al. (2010), we have assumed in computing the equivalent width. Adopting as suggested in Taniguchi et al. (2009) would increase the equivalent widths by a multiplicative factor of 1.4 for the systems and 1.1 for the systems. However, we note that we focus less on the Ly equivalent width than on the UV continuum luminosity, which is less sensitive to the assumed since the wavelength difference is smaller. Here too we assume in comparing the two redshifts. The sample has identical median and mean values of 0.07 for the Ly to UV continuum luminosity ratio, while the sample has a median value of 0.05 and a mean value of 0.08. Both are very similar to that expected from a galaxy undergoing constant star formation. For a Salpeter initial mass function, the latter value is almost irrespective of metallicity (Charlot & Fall 1993; Schaerer & Verhamme 2008). This value is shown as the solid black line in Figure 3. There is little sign of evolution with redshift, therefore, and, for this sample, little sign of destruction of the line relative to the continuum. The observed values catter above and below the average values by multiplicative values of roughly three. The high values may correspond to younger age, top-heavy IMF or particular escape geometry (e.g. Finkelstein et al. 2007).
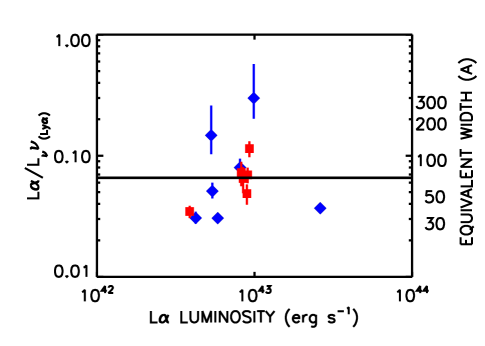
The high value of the Ly to UV continuum ratio is likely to be, at least in part, a selection effect: if there is a range in the amount of destruction of Ly relative to the continuum, then the most luminous Ly emitters will be those with the least destruction, which may then have near-standard ratios. In particular, objects without Ly detections at the rest-frame EW limit of should not be analyzed with this result, which holds only for objects in the LAE samples. However, the result does imply that many objects with little Ly destruction do exist and that, for these luminous Ly-selected objects, we can convert between Ly and UV continuum luminosities. At first sight this may seem inconsistent with the blue asymmetric profiles seen in these Ly emitters (Hu et al. 2010). However, these profiles may be intrinsic to the galaxy and produced by scattering in outflows (Verhamme et al. 2006) rather than being a consequence of Ly scattering in the surrounding intergalactic gas.
Our measured ratio of Ly luminosity to UV continuum luminosity can be combined with the ‘conventional’ Kennicutt (1998) relation between the star formation rate and the UV luminosity to obtain , where is in erg s-1 and, again, the value is for a Salpeter initial mass function. The effects of metallicity may change this relation by as much as 0.2 dex (Schaerer & Verhamme 2008) and it is also dependent on the exact star formation history. However, it can be seen from the Ly luminosities in Table 1 that typical star formation rates, with no extinction correction, are in the range of 5–10 M☉ yr-1, where we have used the relationship above in computing the SFRs. The UV continuum-selected galaxies without detected Ly may have much more substantial Ly destruction and for these the conversion rate from Ly luminosity to SFR may be larger than the relation given above.
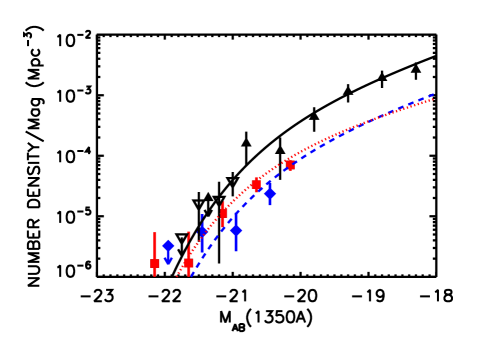
We can also now test whether the Ly emitters are comparable in continuum luminosity to samples obtained using continuum color-selection. From the full LAE sample of Hu et al. (2010) we constructed continuum luminosity functions of the Ly-selected sample at both and , using the accessible volumes computed for each object in Hu et al. We converted Ly luminosity to a UV continuum luminosity at 1350Å (rest-frame) using the constant star-formation value of 0.065 for the ratio of Ly luminosity to UV continuum light redward of Ly, and assuming the continuua are roughly constant in from 1350Å to 1850Å. These luminosity functions are shown in Figure 4, where we compare them with continuum luminosity functions determined from color-selected samples (Ouchi et al. 2009; Bouwens et al. 2010). The Ly-selected objects have high continuum luminosities (or equivalently star formation rates), comparable to the brightest continuum-selected objects at these redshifts. Our UV continuum luminosity function is lower by a factor of 5 than those derived by Shimasaku et al. (2006) and Kashikawa et al. (2006) whose results would imply that all UV continuum-selected objects at this redshift would also be LAEs. Both of these results may be due in part to the extreme difficulty of measuring accurate continuum magnitudes from ground-based data, particularly when the Ly lines lie within the continuum bandpass. However, the difference is also due in part to the high Ly luminosity functions calculated in these papers, which are about a factor of two above that of Hu et al. (2010). Hu et al. (2010) argue that the difference between their Ly LF and the previous determinations is a consequence of using a fully spectroscopically confirmed sample which eliminates some of the photometrically selected objects but Kashikawa et al. (2011) argue against this interpretation. It is unclear therefore which is the better Ly LF to choose, but we note that using the higher Kashikawa et al. (2011) Ly LF would result in a very large fraction of UV continuum-selected galaxies having Ly emission at near the case B ratio. This would be a rather surprising result, given that we expect at least some destruction owing to scattering in the IGM.
We can also use the luminosity functions to estimate the fraction of UV continuum sources that have strong Ly emission. This fraction rises rapidly at low redshifts (from 5% at to % at ; Cowie, Barger & Hu 2010) but above it has been less clear whether it continues to increase or drops again (Stark et al. 2010, 2011; Zucca et al. 2009; Hayes et al. 2010). Above a UV continuum magnitude of the Ly sample comprises of the color-selected continuum sample at . For the corresponding number is above , where the errors are formal statistical errors. These fractions are very similar to those found at by Shapley et al. (2003) for sources with similar rest-frame Ly equivalent widths (above 20Å), which would suggest very little high-redshift evolution. It would represent a drop from the values at - 6.1 found by Stark et al. (2011) who argue that nearly all continuum-selected objects at these redshifts are LAEs with rest-frame EW . However, we caution that the present numbers have substantial systematic uncertainties. The uncertainty in the UV to Ly conversion ratio can result in significant changes: thus if the true conversion was 0.03 (0.13), the second lowest (second highest) value observed in the sample, the normalization would rise (fall) to approximately 0.6 (0.1). In addition, as we have discussed above, other measurements of the Ly luminosity function at these redshifts (Kashikawa et al. 2006, 2011; Ouchi et al. 2008, 2010) have been a factor of two higher than Hu et al.’s and using these luminosity functions would increase the LAE fraction by this amount. It is also possible that the UV continuum samples we are comparing with may still contain spurious objects, including red stars and lower redshift red galaxies, which would also increase the LAE fraction, and that there may be substantial uncertainties owing to cosmic variance in these continuum luminosity functions.
The present results show that LAEs at have remarkably similar properties to those at lower redshifts. They are small, have moderately high star formation rates, and have substantially complete escape of the Ly photons. Other properties such as the shape and widths of the Ly lines also appear invariant (e.g. Ouchi et al. 2010, Hu et al. 2010). The results also show that the continuum luminosities are comparable to the brightest values seen in color-selected continuum samples, suggesting that even the strongest star-forming galaxies at these redshifts may show Ly in emission. We also find that the LAEs are a significant fraction of the UV-continuum selected objects at these redshifts, similar, within the systematic uncertainties, to values seen at lower redshifts. The observations show no sign that any effects associated with reionization are being seen at .
References
- (1)
- (2) Bond, N. A., Gawiser, E., Gronwall, C., Ciardullo, R., Altmann, M., & Schawinski, K. 2009, ApJ, 705, 639.
- (3)
- (4) Bond, N. A., Feldmeier, J. J., Matković, A., Gronwall, C., Ciardullo, R., & Gawiser, E. 2010, ApJ, 716, L200.
- (5)
- (6) Bouwens, R., et al. 2010, arXiv:1006.4360.
- (7)
- (8) Cowie, L. L., Barger, A. J. & Hu, E. M. 2010, ApJ, 711, 928.
- (9)
- (10) Deharveng, J.-M., et al. 2008, ApJ, 680, 1074.
- (11)
- (12) Charlot, S., & Fall, S. M. 1993, ApJ, 415, 580.
- (13)
- (14) Dayal, P., Maselli, A., & Ferrara, A. 2011, MNRAS, 410, 830.
- (15)
- (16) Dijkstra, M. & Westra, E. 2010, MNRAS, 401, 2343.
- (17)
- (18) Dijkstra, M., & Wyithe, J. S. B. 2010, MNRAS, 408, 352
- (19)
- (20) Finkelstein, S. L. et al. 2007, ApJ, 660, 1023.
- (21)
- (22) Giavalisco, M., et al. 2004, ApJ, 600, L93.
- (23)
- (24) Hayes, M., Schaerer, D., Ostlin, G., Mas-Hesse, J. M., Atex, H., & Kunth, D. 2010, arXiv:1010.4796.
- (25)
- (26) Hu, E. M., Cowie, L. L, McMahon, R. G., Capak, P., Iwamuro, F., Kneib, J.-P., Maihara, T., & Motohara, K., 2002, ApJ, 568, L75 (erratum 576, L99).
- (27)
- (28) Hu, E. M., Cowie, L. L., Barger, A. J., Capak, P., Kakazu, Y., & Trouille, L. 2010, ApJ, 725, 394.
- (29)
- (30) Kashikawa, N., et al. 2006, ApJ, 648, 7.
- (31)
- (32) Kashikawa, N., et al. 2011, arXiv:1104.2330.
- (33)
- (34) Kennicutt, R. C., Jr. 1998, ARAA, 36, 189.
- (35)
- (36) Kunth, D. et al. 2003, ApJ, 597, 263.
- (37)
- (38) Laursen, P., Sommer-Larsen, J., & Razoumov, A. O. 2011, ApJ, 728, 52.
- (39)
- (40) Lehnert, M. D. et al. 2010, Nature, 467, 940.
- (41)
- (42) Loeb, A., & Rybicki, G. B. 1999, AJ, 524, 527.
- (43)
- (44) Mackenty, J. W., Kimble, R. A., O’Connell, R. W., & Townsend, J. A. 2010, SPIE, 7731, 27.
- (45)
- (46) Neufeld, D. A. 1991, ApJ, 370, L85.
- (47)
- (48) Östlin, G. et al. 2009, AJ, 138, 923.
- (49)
- (50) Ouchi, M, et al. 2008, ApJS, 176, 301.
- (51)
- (52) Ouchi, M, et al. 2009, ApJ, 706, 1136.
- (53)
- (54) Ouchi, M., et al. 2010, ApJ, in press.
- (55)
- (56) Schaerer, D., & Verhamme, A. 2008, A&A, 480, 369.
- (57)
- (58) Shapley, A. E., Steidel, C. C., Pettini, M., & Adelberger, K. L. 2003, ApJ, 588, 65.
- (59)
- (60) Shimisaku, K. et al. 2006, PASJ, 58, 313.
- (61)
- (62) Stark, D. et al. 2010a, MNRAS, 408, 1628.
- (63)
- (64) Stark, D. P., Ellis, R. S. & Ouchi, M. 2011, ApJ, 2011, 728, L2.
- (65)
- (66) Taniguchi, Y. et al. 2009, ApJ, 701, 915.
- (67)
- (68) Tilvi, V. et al. 2010, ApJ, 721, 1853.
- (69)
- (70) Vanzella, E. et al. 2010, arXiv:1011.5500.
- (71)
- (72) Verhamme, A., Schaerer, D., & Maselli, A. 2006, A&A, 460, 397.
- (73)
- (74) Zheng, Z., Cen, R., Trac, H., & Miralda-Escudé, J. 2010, ApJ, 716, 574.
- (75)
- (76) Zucca, E., et al. 2009, A&A, 508, 1217.
- (77)