Discovery Of Cold, Pristine Gas Possibly Accreting Onto An Overdensity Of Star–Forming Galaxies At Redshift 11affiliation: Based on observations obtained with European Southern Observatories Very Large Telescope, Chile, and with the NASA/ESA Hubble Space Telescope, obtained at the Space Telescope Science Institute, which is operated by the Association of Universities for Research in Astronomy, Inc. (AURA) under NASA contract NAS 5-26555. .
Abstract
We report the discovery of large amounts of cold ( K), chemically young gas in an overdensity of galaxies at redshift located in the Great Observatories Origins Deep Survey southern field (GOODS–S). The gas is identified thanks to the ultra–strong Mg II absorption features it imprints in the rest–frame UV spectra of galaxies in the background of the overdensity. There is no evidence that the optically–thick gas is part of any massive galaxy (i.e. ), but rather is associated with the overdensity; less massive and fainter galaxies ( mag) have too large an impact parameter to be causing ultra–strong absorption systems, based on our knowledge of such systems. The lack of corresponding Fe II absorption features, not detected even in co–added spectra, suggests that the gas is chemically more pristine than the ISM and outflows of star–forming galaxies at similar redshift, including the galaxies of the overdensity itself, and comparable to the most metal–poor stars in the Milky Way halo. A crude estimate of the projected covering factor of the high–column density gas ( cm-2) based on the observed fraction of galaxies with ultra–strong absorbers is . A broad, continuum absorption profile extending to the red of the interstellar Mg II absorption line by is possibly detected in two independent co–added spectra of galaxies belonging to the overdensity, consistent with a large–scale infall motion of the gas onto the overdensity and its galaxies. Overall, these findings provides the first tentative evidence of accretion of cold, chemically young gas onto galaxies at high redshift, possibly feeding their star formation activity. We suggest that the fact that the galaxies are members of a large structure, as opposed to field galaxies, might play a significant role in our ability to detect the accreting gas.
1 Introduction
The history of gas accretion in galaxies is a major outstanding question that is essentially unconstrained by the empirical investigation. Do galaxies evolve by transforming into stars the mass of gas present in their hosting halo at the time of its formation? Or do they continue accreting substantial amounts of gas from the environment to feed star formation?
Theoretically, an interesting recent development is the realization that most of the baryonic mass in galaxies of all masses is supposed to accrete as relatively cold gas, namely gas that was never shock–heated to the halo virial temperature (e.g. Birnboim & Dekel 2003; Keres et al. 2005; Dekel & Birnboim 2006; Keres et al. 2009; Dekel et el. 2009a and references therein). Current hydro–dynamical simulations show that halos with mass below the threshold value acquire their gas primarily by cold accretion, with hot accretion remaining relatively unimportant in providing gas for star formation. More massive halos do acquire an atmosphere of hot coronal gas in the simulations which subsequently cools and contributes to star formation, but cold accretion remains nonetheless the dominant mode of gas acquisition, even in this case, at high redshift (e.g. ), while hot accretion starts to compete only at .
Observationally, there has been scant evidence for galactic-scale accretion so far, cold or otherwise, with powerful and ubiquitous outflows powered by star formation being the only bulk–motions of gas in the proximity of galaxies that have been unambiguously detected at low and high redshift (e.g. Steidel et al. 1996; Franx 1997; Pettini et al. 2001; Shapley et al. 2003; Tremonti et al. 2007; Weiner et al. 2009; Nestor et al. 2010). Rauch et al. (2008) reported detection of Lyman– emission around galaxies at that they interpret as possible evidence of accreting H I gas onto these systems. Steidel et al. (2010) find evidence of possible gas inflows around relatively massive galaxies at but conclude that this is not necessarily evidence of cold accretion and other explanations are possible, and, in fact, more likely. Indirect evidence of accretion of chemically pristine gas is reported by Cresci et al. (2010), who interpret the inverse gradient of the metallicity of the nebular gas in star–forming galaxies at as evidence that the metallicity of the central regions is being diluted by accreting cold flows.
It is not straightforward, however, to interpret the absence of evidence of accretion as evidence of the absence of accretion. On the one hand, we do not have much insight on the relative covering factor of high–column density inflowing gas, i.e. observable in relatively low S/N absorption systems, versus the outflowing one. For example, the simulations predict the geometry of the cold gas to be largely filamentary over scales ranging from kpc to Mpc (Dekel et al. 2009a), in particular before they enter the “sphere of influence” of the accreting galaxy (the circum–galactic medium, or CGM, in recent parlance). At closer galactocentric distance, which is where current observations are probing the ISM, the smooth accreting flow is expected to break into a lumpier distribution of cold gas, especially around more massive halos (Keres & Hernquist 2009; Dekel et al 2009b), that in turn feeds clumpy, unstable disks. If this is a fair description of reality, then the total cross section of high–column density accreting gas, especially in the proximity of the star–forming regions, should be relatively small, as suggested in recent works (Fumagalli et al. 2011; Ceverino et al. 2010; Kimm et al. 2010; Dekel, private communication), which calculate that the covering factor of gas with cm-2 around halos is %, and that of gas with cm-2 is %.
On the other hand, there is the distinct possibility that we do not fully understand the inherent bias and limitations of the current observations of the circum–galactic medium of distant galaxies, as far as the detection of gas accretion is concerned. For example, the observations by Steidel et al. (2010) probe the gas along sight lines toward, and in some cases in the proximity ( kpc) of, regions of powerful star formation, with the UV–bright regions of the galaxies providing the back–illumination to study the gas in absorption. The galaxies are selected to be star–forming ones with moderate or no dust obscuration. These selection criteria might preferentially yield samples of galaxies oriented along the least obscured line sight from the observer toward their center, thus biasing their studies to finding strong signature of outflows with high covering factor.
In general, outflows from star–forming galaxies cover large solid angles (Tremonti et al. 2007; Martin 2006), and it is possible that their interactions with the inflowing gas, as well as the sensitivity of the observations, conspire against the detectability of inflows, because the strength of the interstellar absorption is generally very strong and broad in velocity space, and can completely dilute and hide the signal of the inflow (Kimm et al. 2010). Unfortunately, the simulations do not yet provide firm predictions on the observability (with current technology) of the inflowing of gas and how this interacts with the outflowing one, especially in the volumes at small impact parameters from the galaxies’ centers that have been targeted by the observations so far.
Until we gain firmer theoretical guidance on the effective cross section of the accreting gas and its observability in the proximity of galaxies, an important first step would be to constrain the abundance of gas at large galactocentric distance that can plausibly feed accretion. Indeed, staying well clear of the regions directly affected by the outflows seems a promising strategy, since the gas must reach the accreting galaxies from large distances, and in this way one would eliminate the inherent complications of having to disentangle and interpret the kinematics of gas that participates in inflows as well as outflows. The challenge of such a strategy is to overcome the small cross section of high–column density gas, if this is to be detected by means of absorption spectroscopy. This might appear to be a daunting task, especially if the theory is right that, at large separations from galaxies, the accreting flows exhibit filamentary geometry. Cosmological simulations, however, suggest, at least qualitatively, that the projected cross section of gas accreting onto large cosmic structures is proportionally larger than in the case of isolated galaxies. The simulations also show that the covering fraction of the gas increases with the halo mass. Thus, targeting the relatively common “overdensities” of galaxies, nearly ubiquitous in any redshift survey as “spikes” in the galaxies’ redshift distribution, might currently be our best hope to gain some insight into the issue of “cold accretion” since they might provide sufficient cross section of high–column density gas. The most massive among these overdensities typically extend over wide regions of space, with linear size of a few tens Mpc, which means that a relatively large number of bright background galaxies are generally available to back–illuminate the gas and make it visible by means of spectroscopy of the intervening absorption systems.
In this paper we report the discovery of large amounts of cold gas, i.e. K, not directly associated with any galaxies, in a large overdensity of galaxies at located in the GOODS–South field (see Kurk et al. 2009). The gas is detected thanks to the Mg II absorption features it imprints in the individual spectra of background Lyman–break galaxies at , as well in the stacked spectra of other background galaxies. It appears to be chemically more pristine than that observed in the outflows of star–forming galaxies at the same redshift, including those within the same overdensity. We discuss the observed and inferred properties of the gas and the tentative evidence that it accretes onto at least some of the overdensity galaxies. Throughout this paper, when needed, we use a CDM world model with Hubble constant , and . Magnitudes are in the AB scale of Oke & Gunn (1977).
2 Observations and Data Set
The data presented in this paper include spectra of star–forming galaxies in the GOODS–S field, selected from the GOODS HST/ACS imaging survey (Giavalisco et al. 2004a) using a number of criteria based on rest–frame UV colors aimed at selecting star–forming galaxies at (see Giavalisco et al. 2004b; Vanzella et al. 2005, 2006, 2008). The ACS mosaic in the GOODS–S field covers an area of roughly , or about Mpc (proper) at , and has been the target of a number of programs of follow–up spectroscopic observations of HST–selected galaxies using a number of telescope and spectrometer combinations, including VLT with VIMOS and FORS2 (Vanzella et al. 2005, 2006, 2008; Popesso et al. 2009; Balestra et al. 2010) and Keck with DEIMOS and LRIS (Stern et al., in preparation ); in this work we focus on the spectra obtained with FORS2, which we will refer to as the “GOODS survey”. These include three Lyman–break galaxies (LBGs) at where we have discovered absorption features, the subject of our discussion here, that we identify as due to Mg II at . These spectra were obtained as part of our program of spectroscopic identifications of Lyman–break galaxy candidates selected from the ACS images (Giavalisco et al. 2004b; Vanzella et al. 2009). Acquisition, reduction and analysis of the spectra have already been presented in the papers above, and we will not discuss them further here.
Other spectroscopic data include the spectra of star–forming galaxies at obtained during the “Galaxy Mass Assembly ultra–deep Spectroscopic Survey” (GMASS) survey (Cimatti et al. 2008; Kurk et al. 2009), which have been selected from the GOODS Spitzer/IRAC 4.5 µm images to satisfy the flux limit , essentially a mass–limit selection criterion approximately corresponding to , with a small dependence on the spectral type. The redshift of these galaxies extends up to with % of them having , and include the redshifts of galaxies that belong to a large overdensity at , which are distributed over a substantial portion of the ACS mosaic, as we will discuss later (Vanzella et al. 2008; Kurk et al. 2009). In the following, we will refer to these redshift as “the GMASS survey”. Including GMASS and GOODS, there are 97 spectroscopic redshifts and 194 photometric redshifts (Dahlen et al. 2010) in the range , which roughly defines the overdensity, satisfying the above mid–IR flux limit criterion, crudely % spectroscopic completeness in that redshift interval.
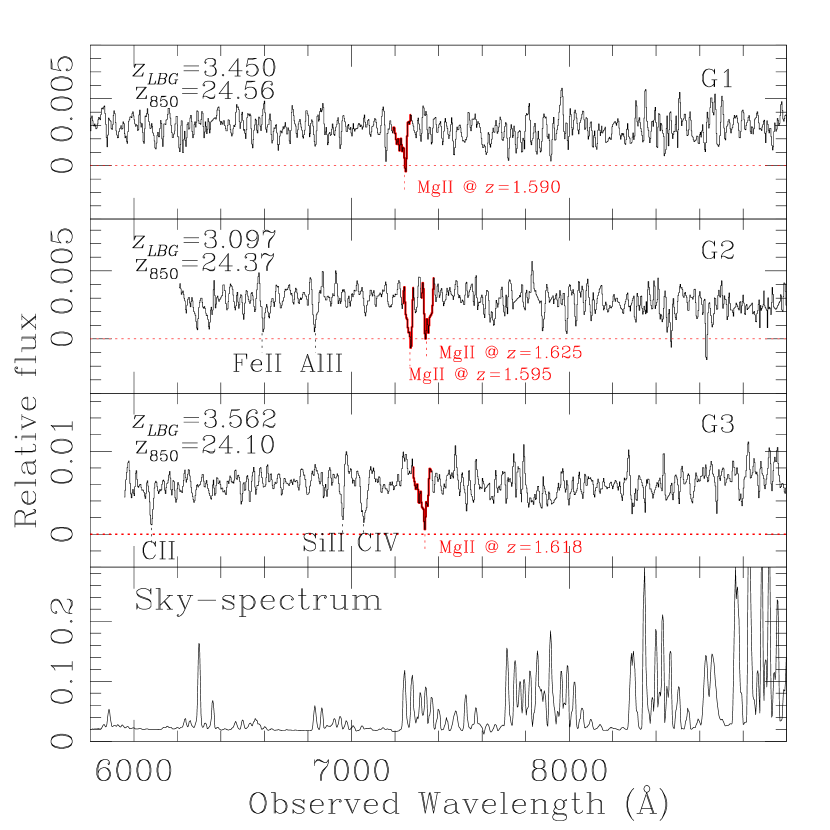
Figure 1 shows the observed 2–D GOODS spectra of three Lyman–break galaxies, out of a total of 21 with that we have analyzed, in which we have detected the presence of absorption features, all of the them around Å, that do not match any known strong feature at their redshift. These Lyman–break galaxies have originally been selected as “B–band” dropouts from the GOODS HST/ACS photometry (Giavalisco et al. 2004b) and marked for follow–up spectroscopy as part of our investigation of galaxies at very high redshift (see Vanzella et al. 2008, 2009 for a discussion of the data reduction and analysis). Figure 2 shows the optimally–extracted spectra of the three LBG with the intervening absorption features marked in red and labeled with the redshift of the trough, if identified as Mg II. The magnitude and redshift of the LBG are also shown, as well as some of their spectroscopic feature.
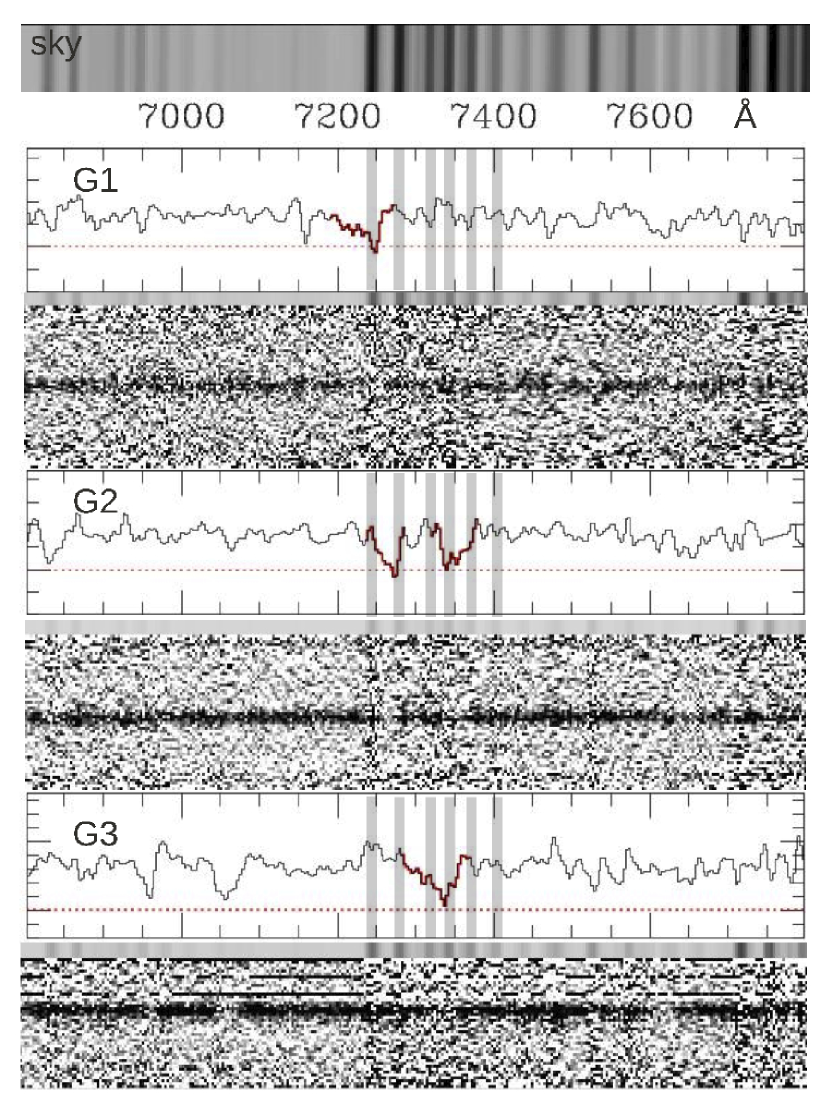
The dispersion of these spectra is , corresponding to a resolution of Å, or about 454 in the observed frame, at the wavelength of the features. The pixel scale along the dispersion direction is Å.
While all four absorption features have wavelength within the range of the band of weak night sky lines located at Å, there is no evidence that the features themselves might be due to noisy sky removal. Both the 2–D and extracted spectra show that no similar features are observed in spectral regions affected by much stronger night sky lines, where the continuum of the three LBG is observed without spurious “absorption lines.” In general, the four LBG absorption features have FWHM consistent with kinematic broadening being comparable to the spectral resolution, except the absorption feature in the spectrum of G3 (see below), which is considerably broader.
Galaxy J033220.85-275038.9 (G1 from now on) has apparent magnitude mag and redshift , measured from a spectrum with quality flag in the quality classification system by Vanzella et al. (2009). The quality flag values A, B and C, correspond to redshift identifications that are “unambiguous”, “likely” e.g. when based on one line only or on a spectral break, and “uncertain”, respectively. As discussed in Vanzella et al. (2009) and Vanzella et al. (2008), we assigned QF=B to G1 because only one strong emission line, interpreted as Lyman–, is observed in its spectrum; the asymmetric profile of the line, the dimming of the continuum in correspondence of the Lyman- forest and the presence of a strong spectral break in an otherwise blue continuum, as shown by its ACS broad–band colors, make the redshift identification of this galaxy secure. An absorption line is detected with central wavelength located at Å, observed equivalent width Å and Å (from a fit to a single gaussian line profile). Although the spectrum has relatively low S/N, the 2–D spectrum shows that the absorption feature is broader than the night sky line adjacent to it. The extracted spectrum suggests that the line possibly has an asymmetric profile, with the blue wing broader than the red one.
Galaxy J033226.18-275211.3 (or G2) has magnitude mag, and in Vanzella et al. (2009), we reported its redshift measure as having and listed the tentative value . Since this source shows two absorption systems at around , we have re-analyzed both our FORS2 spectrum and the VIMOS spectrum of this galaxy acquired by Popesso et al. (2009) in an attempt to make a better measure of its redshift. Using the spectrum of cB58, a lensed LBG whose apparent magnitude is unusually bright (Pettini et al. 2003), as a template, a cross–correlation analysis yields from the FORS2 spectrum and from the VIMOS one. In the former case, the redshift is mostly determined by C IV, Fe II and Al II absorption lines (these two visible in the portion of the spectrum plotted in Figure 2), while in the latter by Ly, C II, and C IV features. Two absorption lines inconsistent with known strong features at are observed with central wavelength at and Å, the latter possibly showing evidence of a barely resolved doublet. The 2–D spectrum shows that in both cases the absorption feature is broader than adjacent night sky lines. The observed equivalent width of the features is and Å, respectively, while the width from best fits to single-gaussian line profiles are Å and Å, respectively. The velocity difference between the two absorption lines is , too large to believe that one intervening galactic system (a galaxy and its circum galactic medium) might be responsible for producing both of them.
Galaxy J033226.76-275225.9 (G3), with mag and redshift , has quality flag QF=A. Some of the low–ionization metal absorption lines used to determine its redshift are visible in the figure. An absorption line is observed with central wavelength located at Å and with equivalent width and line width and Å, respectively (again, the width comes from a best fit to a single gaussian line profile). As in the case of G1, it is possible that the profile of this line is asymmetric, with the bluer part broader than the red one. Finally, also in this case the 2–D spectrum does not show any evidence of an anomalous subtraction of the sky emission, and the feature appears to be significantly broader than the night sky emission lines close to it.
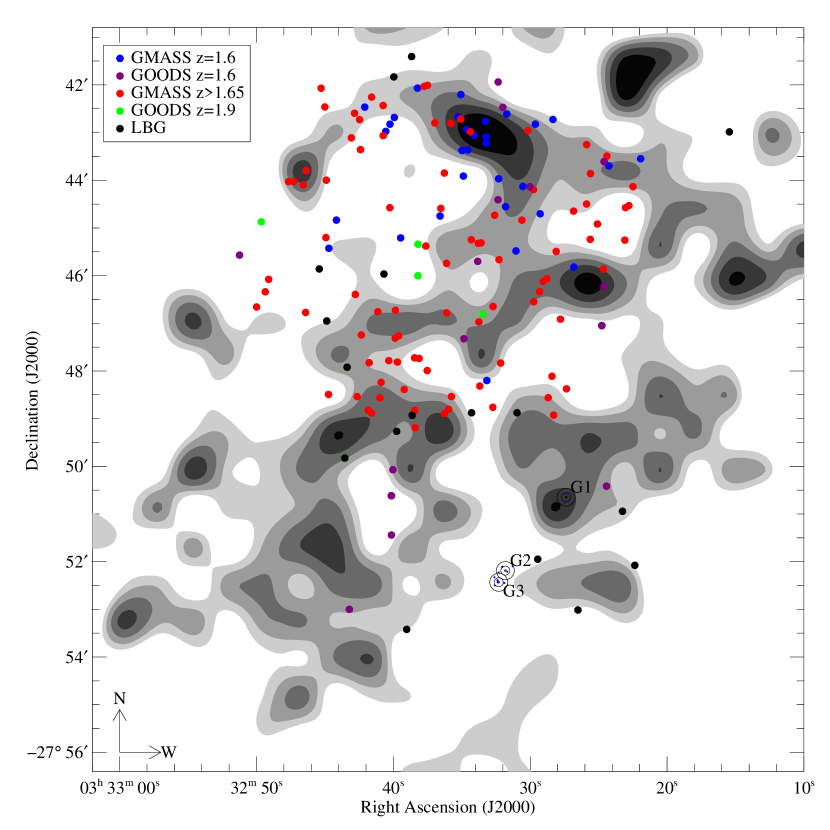
The three Lyman–break galaxies are fairly typical in their variety of spectral properties. Galaxy G1 has strong Lyman– in emission and weak interstellar absorption lines, while G2 and G3 have stronger interstellar absorption features and weak or absent Lyman–, as very frequently observed in what are termed “emitters” and “absorbers” LBGs (see Steidel et al. (1996); Shapley et al. (2003); Vanzella et al. (2009) and discussion therein). On the plane of the sky the three LBGs are roughly aligned along a straight line, oriented approximately at °; the angular separations between the centroids of the –band images of G1 and G2, G1 and G3, and G2 and G3 are 116.3, 132.6 and 16.5 arcsec, respectively (see Figure 7 and 8). At redshift the corresponding projected distances between the line–of–sight (LOS) to G1 and G2, G1 and G3 and G2 and G3 are , and kpc (physical), respectively. In velocity space, the absorption feature of G1 and the bluer of the two features of G2 are separated by , while the redder one and the feature of G3 have . The separation between the absorption lines of G1 and G3 is , the same as that the velocity difference between the two features observed in the spectrum of G2.

3 Large Amounts Of K Gas In The Overdensity At
The three LBGs discussed above share the common property of having absorption features, all located approximately at the same wavelength, Å, that do not match any known strong spectral feature at their redshifts. These “spurious” lines all match, however, the rest–frame wavelength of Mg II absorption at the redshift of the intervening galaxy overdensity at . Since no other feature is observed in the spectrum of any of the galaxies that would confirm this interpretation, we have obtained a stacked spectrum by averaging each candidate Mg II absorption line after shifting its central wavelength to the common rest–frame wavelength Å. We found that it makes no difference in the result if the spectra are scaled or not before the average is computed, which is reasonable since the galaxies have similar continuum intensity. Thus, the spectrum of galaxy G2 enters twice in the stack, albeit each time with a different wavelength shift, since there are two candidate Mg II absorption lines in it. Such stacked spectrum is shown in Figure 3 (top spectrum).
The stacked absorption feature has rest–frame equivalent width Å and appears barely resolved into a doublet. We have fit the feature to a two–component Gaussian line profile using a chi–square procedure to measure the central wavelength of each component, finding best–fit values Å for the blue one and Å for the red, respectively (we left the central wavelength and line width of both components as free parameters finding the reduced chi–square of the best fit to be ). Each component has rest equivalent width Å, and their width, Å, is consistent with kinematic broadening comparable to the spectral resolution, i.e. in the rest–frame. No Mg I absorption line is observed in the stacked spectrum, although none is be expected given the S/N if the ratio of the equivalent width of this line to that of Mg II is similar to what observed the galaxy spectra discussed below, i.e. .
Since the individual intervening absorption lines in the LBG spectra are detected at relatively low significance level, in the range , we have further investigated their significance using Monte Carlo simulations. Specifically, we have created a large number of random realizations (5,000) of the three LBG spectra by altering each spectrum, pixel by pixel, with a gaussian variate with zero mean and variance from that spectrum’s error array. To include the uncertainty of the esitmate of the value of the continuum in the simulations we have used all pixels in the spectral range Å, which is were the continuum is measured with a linear fit (excluding the absorption line). We have then fitted a gaussian profile to each intervening absorption feature, leaving the centroid as a free parameter. For each random realization of the three spectra we have also obtained the stack of the four absorption features, following the same procedure adopted for the original spectra. The distributions of the wavelength of the centroid and of the equivalent width of each absorption line in the 5,000 realizations of the three LBG spectra are plotted in Figure 4, which shows that in essentially all cases the lines are reproduced with the same centroid wavelength and equivalent width as those measured in the real spectra, within the scatter. In the case of the absorption line in G1’s spectrum, the centroid of a fraction of the realizations is found at significantly lower wavelength than that of the majority of the realizations, at Å, consistent with the lower S/N ratio of this feature compared to the other three. In all the other cases the distributions of the centroid wavelength are well defined bell–shaped curves. The distributions of the equivalent width of each of the four absorption lines from the simulations, as well as that of their stack, the latter reproduced in Figure 5, are also well defined bell–shaped curves with width and peak value consistent with the observations.
Finally, we also used to simulations to assess the robustness of the detection of a doublet in the stack of the four absorption lines. In general, a two–component gaussian line profile provides a similarly good or better fit to the simulated data than the single gaussian one, but this is to be expected given the low S/N of the spectra and the larger number of free parameters of the two–component gaussian profile relative to the single one. If we count how often the double–gaussian model is consistent with the Mg II doublet, however, we find that only 562 of the 5,000 (%) realizations have flux and width ratio of the two components within 50% from each other and with centroid separation in the range Å around 2800 Å, too few to suggest the doublet is real, but too many to rule out its existence. In conclusion, the Monte Carlo simulations show that the detection of the four intervening absorption lines in the three LBG spectra is robust, but remain inconclusive on the nature the marginally resolved doublet profile of the stacked absorption line. In other words, given the quality of the data the Monte Carlo simulations cannot confirm or recject the fact the the stacked absorption line is marginally resolved into a doublet, as the data, taken at face vakue, suggest. We note, however, that this feature has a very close morphological similarity with the Mg II absorption doublet in the co–added spectrum of the seven GOODS galaxies at (spectrum b) of Figure 3), which is also marginally resolved111The identification of this feature as the Mg II doublet seems beyond question. The Fe II absorption lines and the Fe II∗ emission line are clearly detected in the stacked spectrum. The Fe II and Mg I absorption lines are marginally detected if considered individually, but the fact all these these features are simultaneously observed as absorption features at the correct wavelength provides further evidence that that the identification of the spectral features is correct.. The two co–added spectra have comparable S/N characteristics , S/N and per resolution element, respectively, thus suggesting that the doublet profile of the stack of the four LBG absorption lines is real. Clearly, spectra with higher S/N are necessary to solve this issue.


Figure 3 also compares the co–added spectrum of the four Mg II absorbers to those of star–forming galaxies in the overdensity as well as at , where the Mg II and other absorption features, such as the Fe II, are produced in the galaxies’ ISM, including outflows, and the gas is illuminated by the UV light from massive stars located in the galaxies themselves. As in the case of the LBG, we have found that the stacked spectra are insensitive to scaling the continuum of the individual spectra prior to calculating their average. The most striking difference between the stacked spectrum of the LBG and those of the galaxies is the systematic presence of Fe II absorption in the latter, while none is detected in the former. Finally, we point out that the Mg II and Fe II absorption lines in the stacked spectrum of the 16 GOODS overdensity galaxies (spectrum c) in Figure 3) are clearly systematically blueshifted by relative to the systemic redshift, which is traced by the nebular emission lines (in all cases the individual galaxy spectra are placed in the rest frame using the redshift of the [O II] emission line). This is evidence that the gas participates in outflows, very likely powered by the activity of star formation. The blueshifting signature of the outflows is not observed in the and co–added spectra, because in this case the redshift of the individual galaxies are measured from the Mg II and Fe II absorption features themselves, since the [O II] line is outside of the available spectral range.
There is a hint that the Mg II absorption in the stacked spectrum of the overdensity galaxies also includes a broader, asymmetric component that extends to the red of the doublet, with maybe even additional narrow discrete components (marked by short vertical segments) over–imposed onto it. If real, this would be the signature of gas located in front of the galaxies and moving toward them, since the putative absorbing gas cloud is back–illuminated by the galaxies starlight and its absorption feature is redshifted relative to the primary one. A similar kinematical structure is observed in neither of the two Fe absorption features, which are both detected with relatively higher S/N and whose wavelength is located in a spectral region where the night sky emission is significantly fainter. It is not observed in the stacked spectrum of the four LBG absorption systems, whose S/N is lower and which are observed in the same spectral region as that of the galaxies, thus subject to the same night sky emission. In view of the implications that such evidence, if confirmed, would have, we will discuss it with more detail in the next section.
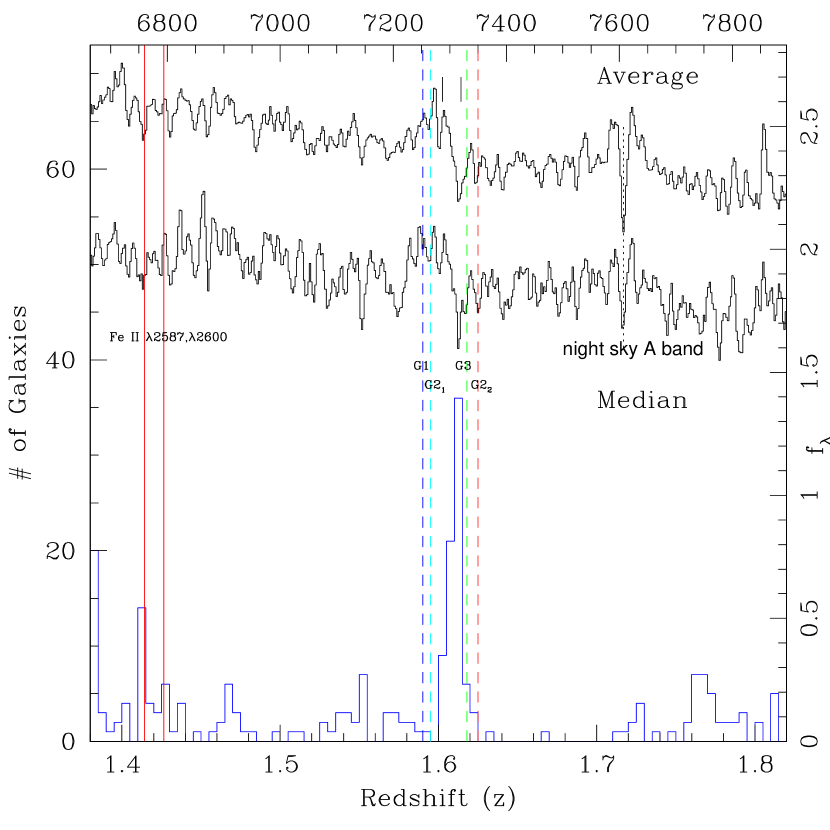
We have further investigated the presence of “intra–overdensity” gas using the deeper GMASS spectra. Specifically, we have co–added together the spectra of galaxies with redshift , namely in the background of the overdensity but distributed along the same line of sight. We have selected a total of 92 “background” galaxies from the GMASS survey, which have apparent magnitude mag, and have visually inspected each one of their spectra for the presence of intervening absorption lines, finding none. Based on the S/N of the spectra, however, we estimate that we would have identified absorption features comparable to the ones we found in the GOODS LBG spectra (if they were there) only in galaxies with mag, namely 84 out of 92 (the GMASS spectra are significantly deeper than the GOODS ones). We have subsequently co–added the spectra of the 92 galaxies in the observed frame with no registration to any common wavelength, with the the idea that if there is a Mg II trough at in correspondence with the overdensity, this should give rise to an absorption feature in the combined spectrum approximately at the wavelength Å, even if absorption features in the spectra of the individual galaxies might not have sufficient S/N for detection. Figure 6 shows the stacked spectrum (average top; median bottom), which has the equivalent of hours of integration time, plotted together with the redshift histogram of galaxies (GOODS and GMASS) in the field. We have obtained stacks with and without scaling each individual spectrum and found the results to be insensitive to the weighting scheme.
The figure shows that the peak redshift of the overdensity coincides with a well–detected absorption feature in the co–added spectrum, marked by a short vertical segment (right segment). The feature is present in both the mean spectrum and in the median one, suggesting that it is not due to a few galaxies but rather is representative of the average. The area of the absorption feature and its equivalent width are times larger than those of the weakest features in its proximity (regardless of whether these weak features are noise or signal in this very deep spectrum), while its width, Å, or , is times larger. The central wavelength of the feature is Å, corresponding to Mg II observed at . Another weaker feature also seems detected at Å (left short vertical segment), at velocity separation from the first. The central wavelengths of the four Mg II absorption features in the LBG spectra are marked with vertical dashed lines and labeled with the name of the galaxies. Additional weak absorption features are observed in the stacked spectrum at the wavelengths expected for Mg II at the redshifts of two of them, namely G21 at and G22 at , both observed in the spectrum of G2. Since none of these absorption features are detected in the individual spectra of the background galaxies, it is difficult to constrain the strength of the absorption systems from the equivalent width in the stacked spectrum, because we do not know how many galaxies contribute to the absorption and how much.
The displacement of these possible discrete absorption features by from the strong absorption feature in correspondence of the peak of the overdensity redshift distribution, bears a striking similarity with the velocity difference of four LBG Mg II absorption systems from the same redshift. We wonder if the fact that we have not found strong Mg II absorption in individual spectra at the peak redshift of the overdensity is indication of some physical mechanism that reduces the covering factor of dense gas clouds inside the overdensity itself. While we cannot address this issue here, we note that the broad absorption feature of the GMASS co–added spectrum at the overdensity redshift peak would tend to prevent detection of weak, discrete absorptions at that redshift.
In any case, the existence of discrete absorption lines, including those in the LBG spectra, together with the broad one in the co–added spectrum would imply that the spatial distribution of the gas is patchy, with denser clouds embedded in a more diffuse distribution, and consistent with a relatively smaller covering factor for the high–column density gas (e.g. atomic hydrogen column density cm-2, see below). The velocity width of the Mg II main absorption feature, , in the stacked spectrum is comparable to the redshift width of the overdensity, or , suggesting that the kinematical broadening due to the motion of the gas is significantly less. More generally, the equivalent width of strong, saturated lines such as, very likely, the four LBG Mg II absorption systems and those in the co–added spectrum, has a very weak dependence on the column density of the absorbing trough, while it gives an approximate indication of the velocity spread along the LOS. In the low S/N spectra of the four LBG Mg II absorbers the line width shows that the absorbing gas has a velocity spread that is, crudely, less than a few hundred along the LOS, consistent with the kinematics inferred from the absorption feature in the co–added spectrum.
Finally, we also note that a number of other absorption features in the stacked spectrum are observed at the wavelengths of Mg II absorption lines at the redshifts of many of the peaks of the galaxy redshift distribution. We will present further analysis of this composite spectrum (as well as other ones) in a separate work.
On the left of Figure 6, two solid vertical lines mark the expected position of the Fe II and Fe II absorption lines at the same redshift of the Mg II absorption feature. There is no detected absorption in the composite spectrum at the expected central wavelength of the Fe lines that is as strong as the Mg II absorption, suggesting that the contribution to the latter by the IGM of individual galaxies is negligible. One weak feature is observed at from the expected wavelength of Fe II , but none is present at the wavelength of Fe II , with the closest feature being observed at from it. We emphasize that the lack of detection of the feature is even more significant than that of the one, since it is stronger (stronger oscillator strength). Finally, that fact that two observed absorption features both coincide with spikes in the galaxy redshift distribution at suggests that they are related to Mg II gas associated with those overdensities, and not to Fe II gas associated with the one.
In conclusion, the analysis of the GMASS composite spectrum of galaxies at , i.e. in the background of the overdensity, provides additional, independent evidence of absorption by a Mg II trough associated with the galaxy overdensity whose chemical enrichment in terms of Fe and Mg relative abundance is qualitatively similar to that observed in the four LBG absorption systems. There is also evidence that the typical velocity fields of the gas within the overdensity is a few and that the spatial distribution of the gas is patchy and consistent with high–column density clouds having a relatively small covering factor.
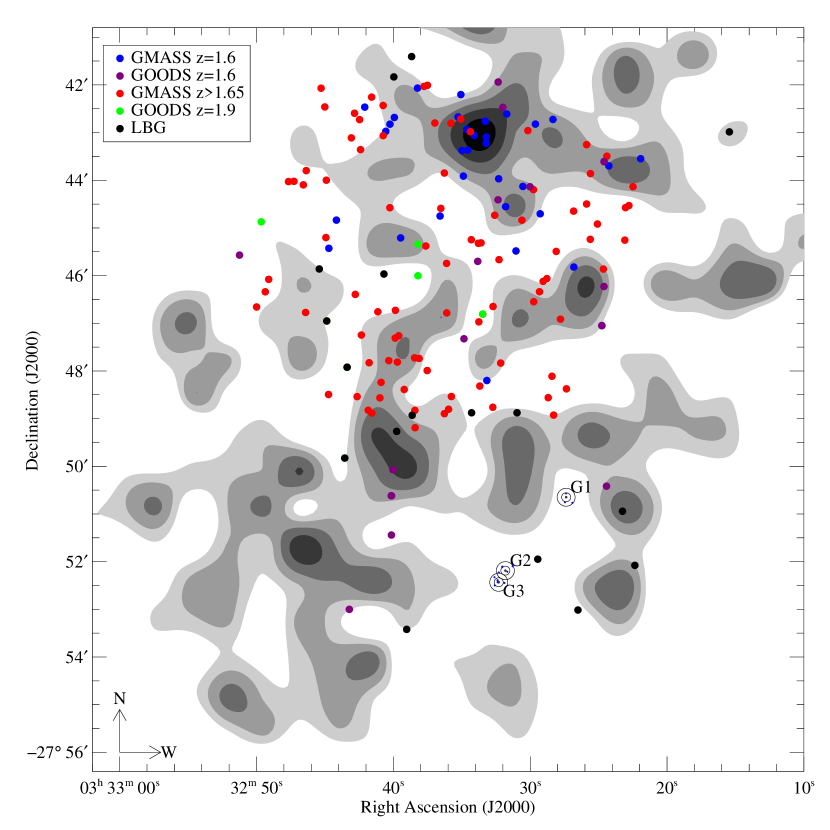
Figures 7 and 8 show the position on the plane of the sky of the galaxies from the GOODS and GMASS spectroscopic samples, plotted together with surface density contours of galaxies with photometric redshift in the range , i.e. candidate members of the overdensity. To assess the robustness of the photometric redshifts is tracing large–scale structures, we used two independent photo–z catalogs in the GOODS–South field, one made by Dahlen et al. (2010) and the other by Guo et al. (2011, in preparation; see also Cassata et al. 2010 for a brief description of this catalog); both take advantage of the 12–band GOODS panchromatic photometric catalog (UBVizJHK plus the four IRAC bands at 3.6, 4.5,5.8 and 8.0 m). As the figures show, most of the large density peaks are observed at the same position in both catalogs, although the morphology of the regions with lower density contrast varies between the two catalogs. In particular, galaxy G1 is in the background of a relatively over–dense region in Figure 7, and of an under–dense one in Figure 8. As noted before, galaxies G1, G2 and G3 are approximately aligned along a line and are on the outside of the region where most of the GMASS spectroscopically identified galaxies, either belonging to the overdensity or in the background, are located. The spatial extension of the overdensity, however, seems to be much larger than this region, covering at least all of the extent of the GOODS field, approximately 10 arcmin by 16 arcmin, or 13.3 Mpc by 21.2 Mpc at (comoving), and perhaps more.
In summary, from intervening Mg II absorption features in the spectra of three LBG at and in the average stacked spectrum of 92 galaxies at (not including the LBG) we have identified gas apparently associated with a large overdensity of galaxies at , whose spatial distribution extends at least over the same projected linear size of the overdensity, namely Mpc, and with a likely patchy distribution of column density. From both the spectra of the LBG and that of the 92 galaxies there is no evidence of corresponding Fe II absorption, a feature that has approximately equal strength in the spectra of the outflows from star–forming galaxies at similar redshift, including the galaxies in the overdensity, suggesting that the “intra–overdensity” gas is chemically more primitive than that of the galaxies’ ISM, as we shall discuss below.
4 The Nature Of The Four LBG Absorption Systems
The top of Figure 9 shows the redshift of the four LBG intervening Mg II absorption systems as well as the redshift distribution of galaxies in the field. It is clear that the four Mg II absorbers are all located in the tails of the overdensity.222We note that the Kurk et al. (2009) suggest the presence of sub–structure within the overdensity, with one smaller group of galaxies centered around redshift and a larger one at , corresponding to a velocity separation . Two factors likely contribute to the fact that the redshift of the absorbers apparently “avoid” those of most galaxies in the overdensity. The first is a selection effect introduced by the band of night–sky emission lines at Å, the spectral region where Mg II falls for most galaxies in the overdensity. These lines bias the observations against the detection of absorption features in relatively faint spectra, such as our sample of LBG (note that the absorber of G1 and the first absorber of G2 are observed to the blue of the sky–line band, while the second absorber of G2 and that of G3 are observed at the wavelength of weaker lines of the band). The second factor is the relatively limited size of the sample of background galaxies that are available to us, which include the 21 GOODS galaxies and the 84 GMASS ones that have adequate S/N for detection of intervening absorption systems. Hints of the presence of discrete features to the blue and to the red of the redshift distribution peak are also present in the co-added spectrum of the GMASS galaxies in the background of the overdensity shown in Figure 6, as we have observed in the previous section. In that spectrum, no discrete features can be detected in the proximity of the peak, however, because of the presence of broad absorption lines. Thus, while it is possible that some physical reasons might be responsible for the lack of discrete absorption features at small velocity separation from the peak of the galaxy redshift distribution, our current data do not allow us to address the issue at this time.
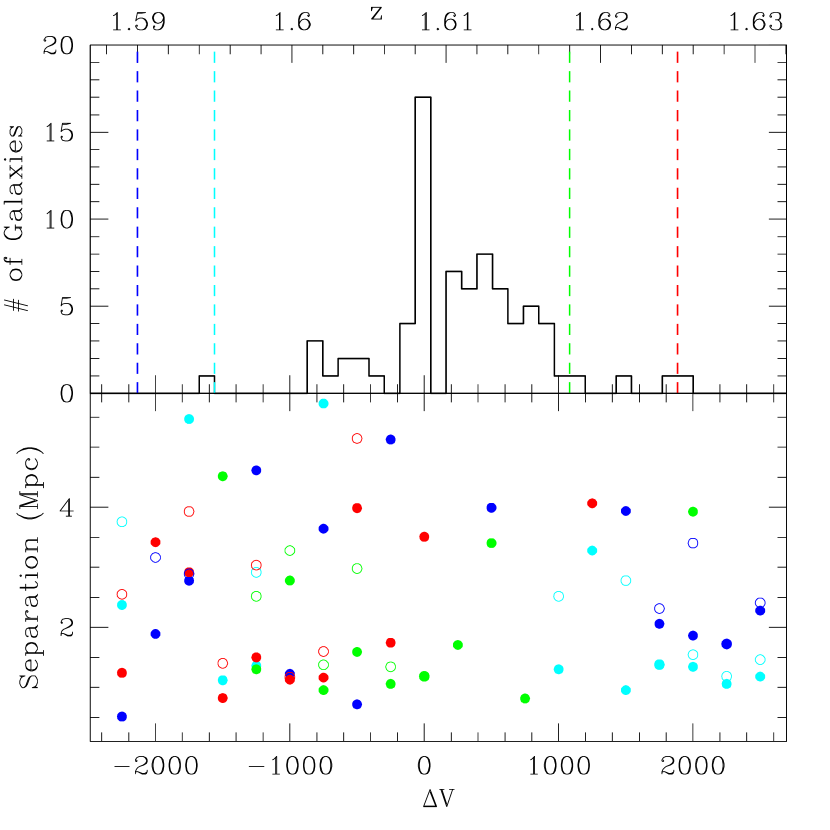
The bottom of Figure 9 shows the shortest and second–shortest impact parameter from the LOS of each absorber to that of the whole (GOODS and GMASS) spectroscopic sample as a function of the velocity separation. While for any given Mg II absorber there is at least one galaxy with velocity separation of or less, the impact parameter in each case is kpc. In fact, in the range , where the spectroscopic sample is on average % complete over the square degree of the GOODS–South field down to mag (the approximate limit if the spectroscopic observations), there are no spectroscopically–identified galaxies (or galaxies that satisfy the selection criteria for the spectroscopic observation, i.e. ) with impact parameter to the LOS of any of the absorbers (at ) shorter than kpc.
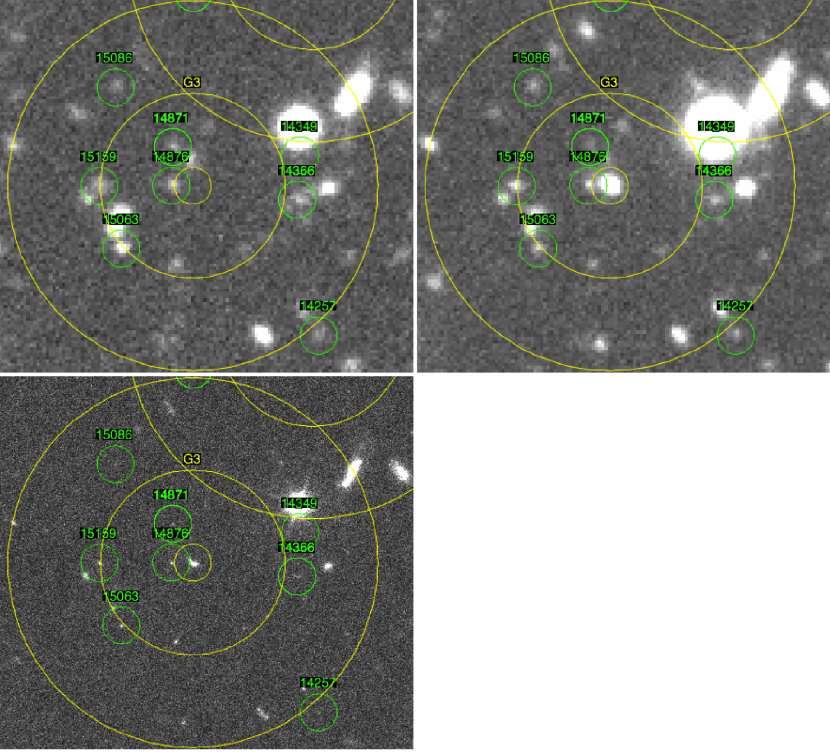
We have also used photometric redshifts to look if galaxies either lacking redshift identification or fainter than the spectroscopic sample’s limiting flux might be plausibly responsible for the observed Mg II absorption systems. Down to the flux limit mag of the spectroscopic sample, no galaxy with photometric redshift in the range in either of the two lists that we have considered has impact parameter shorter than 220 kpc from any of the three LBG. We have looked for fainter galaxies both in the ACS image, as well as in the ultra–deep images in the U and R band recently obtained by Nonino et al (2009) with VLT/VIMOS. The sensitivity of the GOODS ACS images (v2.0) has been discussed elsewhere (e.g. see Lee et al. 2009 and Dahlen et al. 2010); here we simply point out that the depth of the images translates into stellar mass sensitivity (see Table 1) significantly smaller than that of galaxies thought to be capable of producing ultra–strong Mg II absorption systems, as we shall discuss below. Figures 10, 11, and 12 show the images of the regions around the three LBG. In each case the LBG is at the center of the concentric circles, which have a radius of 10, 50 and 100 kpc at (1.18, 5.9 and 11.8 arcsec, respectively). Galaxies with photometric redshift in the range in either the Dahlen’s or Guo’s photo–z catalog are also shown at the center of 10–kpc circles with their GOODS v2.0 ID labeled. Table 1 summarizes relevant properties of these galaxies.
| LBG | IDaaID in the GOODS–South v2.0 ACS source catalog. | bbPeak and weighted photometric redshift from Dahlen et al. (2010). | bbPeak and weighted photometric redshift from Dahlen et al. (2010). | ccPeak and weighted photometric redshift from Guo et al. (2010). | ccPeak and weighted photometric redshift from Guo et al. (2010). | dd–band magnitude, in the AB system (see Giavalisco et al. 2004 and Dahlen et al. (2010)). | eeImpact parameter to the sight line to the LBG at , in kpc. | ffStellar mass from SED fitting to spectral population synthesis model by Guo et al. (2010). | |
|---|---|---|---|---|---|---|---|---|---|
| G1 | |||||||||
| 10520 | 2.16 | 1.976 | 1.60 | 1.434 | 27.13 | 46.4 | 9.3 | ||
| 10479 | 1.59 | 1.583 | 0.01 | 0.265 | 26.48 | 27.82 | 54.8 | 6.4 | |
| 10764 | 1.27 | 1.592 | 1.00 | 1.058 | 27.15 | 25.48 | 67.0 | 8.2 | |
| 10075 | 1.58 | 1.525 | 0.01 | 1.153 | 26.87 | 26.37 | 85.5 | 7.4 | |
| G2 | |||||||||
| 14131 | 1.60 | 1.600 | 1.73 | 1.769 | 25.40 | 24.75 | 23.3 | 9.1 | |
| 14526 | 1.91 | 1.911 | 1.57 | 1.531 | 26.58 | 25.71 | 47.6 | 8.4 | |
| 14524 | 1.90 | 1.999 | 0.05 | 1.678 | 27.29 | 25.13 | 52.1 | 7.5 | |
| 14771 | 1.60 | 1.800 | 1.84 | 1.501 | 27.29 | 25.87 | 67.4 | 8.2 | |
| 13771 | 1.60 | 1.495 | 0.89 | 1.098 | 26.48 | 25.73 | 85.7 | 7.5 | |
| G3 | |||||||||
| 14876 | 1.69 | 1.746 | 1.84 | 1.762 | 26.03 | 25.02 | 11.6 | 9.0 | |
| 14871 | 1.60 | 1.649 | 1.63 | 1.534 | 27.71 | 29.01 | 23.7 | 7.8 | |
| 15159 | 1.73 | 1.797 | 1.70 | 1.725 | 25.64 | 24.12 | 50.5 | 9.3 | |
| 15063 | 1.59 | 1.481 | 1.23 | 1.107 | 26.37 | 26.87 | 51.5 | 7.7 | |
| 14366 | 1.11 | 1.246 | 0.93 | 0.876 | 26.08 | 24.44 | 56.9 | 8.2 | |
| 14349 | 2.07 | 2.211 | 1.64 | 1.748 | 27.34 | 25.19 | 60.3 | 9.4 | |
| 15086 | 1.60 | 1.996 | 0.62 | 0.606 | 26.90 | 24.67 | 67.7 | 7.1 |
The three Lyman–break galaxies are not detected in the U–band images, since these probe the SED beyond their Lyman limit (they have been selected as B–band dropouts). This is very useful, because it gives us unrestricted visibility at , down to the sensitivity limit of the image, to check the possible presence of faint galaxies, undetected at redder wavelengths because overlapping with the isophotal area of the LBG, which could be responsible for the Mg II absorption. We found that, in all cases, no source is detected in the U band at the positions of the LBG down to mag arcsec-2 1– surface brightness limit (Nonino et al. 2009).
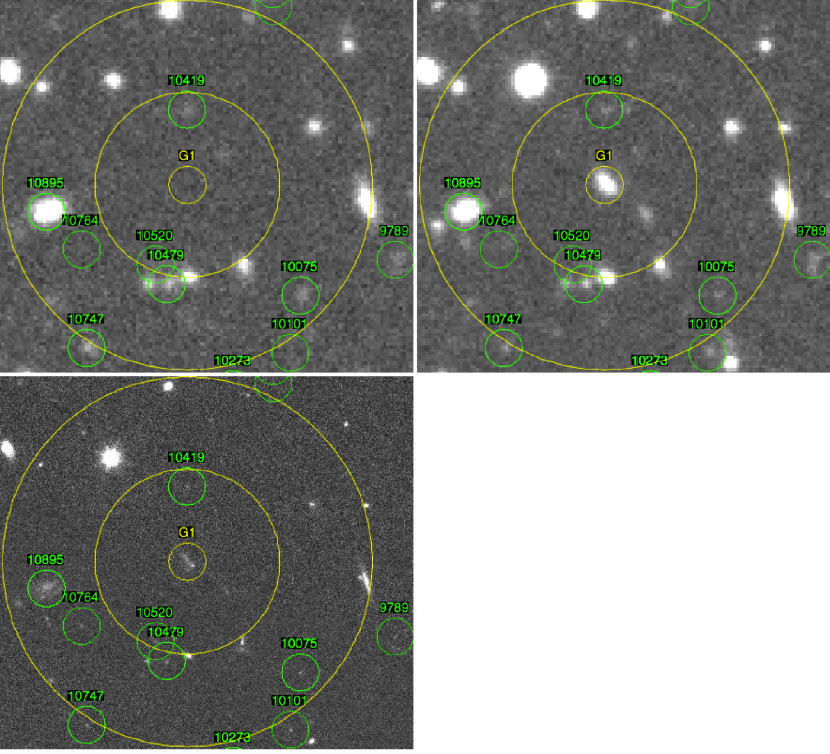
In the case of G1 there are no galaxies in the range with impact parameter closer than 10 kpc, at the redshift of the Mg II absorption system, from the LOS to the LBG. The closest galaxy to G1, which has photometric redshift and is also undetected in the U (it is barely detected in the band, but clearly visible in the R one), is very likely a close companion of the LBG itself. There is a very faint galaxy within the 50 kpc radius, , with mag which, if located at the redshift of the absorber, would correspond to rest–frame 3300 Å absolute magnitude . In the Guo et al.’s catalog this galaxy has peak and weighted photometric redshift and , respectively, and stellar mass . Another two faint galaxies, with mag and with mag, are located in close proximity of the 50 kpc radius; the former barely enters in the selected photo–z window, while for the latter the two measures of the photo–z are widely discrepant. As we shall discuss in the next section, none of the galaxies around G1 is a good candidate for being the host of the Mg II absorbing trough.
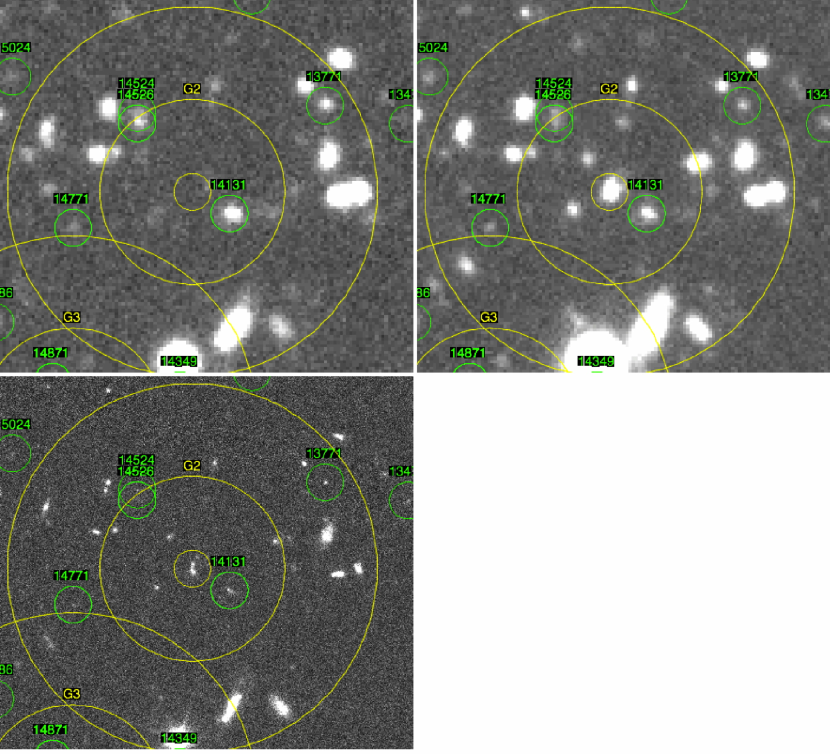
Galaxy G2 has one galaxy within the 10 kpc circle and two galaxies inside the 50 kpc one, which all have high photometric redshifts (), are undetected in the U band and, thus, are likely spatially associated with it. The only galaxy inside the 50 kpc circle with , , has mag and stellar mass . As we will see below, its mass seems too small by at least one order of magnitude to be able to host an ultra–strong absorber, given the impact parameter. Also, even if this galaxy were responsible for one of the two absorption systems of G2, it would be very unlikely causing the other one, given the large velocity separation between them. The fact that the second absorber would then remain without a galaxy identification argues in favor of the interpretation that these LBG absorption systems are not caused by gas associated with individual galaxies.
Galaxy G3 has two galaxies around it with relatively small impact parameter, one just outside the 10 kpc circle () and the other at about 25 kpc (). The former has mag, mag and , the latter mag, mag and . Again, as it will be clearer in the next section, both galaxies seem too small and faint to qualify as likely candidate hosts of the absorbing trough.
Finally, we note that while there is no strong bias against early–type galaxies in the GMASS flux limit selection criterion, the spectroscopic identification of these galaxies requires substantially higher sensitivity than star–forming galaxies with the same apparent magnitude because of the lack of emission lines in their spectra. As a result, it is possible that, using only the spectroscopic sample, massive and passively–evolving galaxies at located in close proximity to the LOS to the four LBGs, and thus potentially capable to host gas responsible for the absorption systems, might have eluded identification. There is no evidence of the presence of such galaxies around G1, G2 or G3 based on the deep URz images discussed here.
5 The Nature Of The Absorbing Gas
The properties of the gas responsible for optically–thick Mg II QSO intervening absorption systems, and for the strong interstellar absorption in the outflows of starburst galaxies, provide a very useful reference to infer the nature of the gas responsible for our LBG Mg II absorption systems, as well as the Mg II absorption observed in the co–added GOODS and GMASS spectra.
5.1 Gas Responsible For QSO Mg II Intervening Absorption Systems
A vast body of work on QSO absorption systems has characterized the properties of the gas capable to give rise to strong intervening Mg II absorption features observed in their spectra. The main results that concerns this work is that this low–ionization species is a tracer of a warm medium, K, associated with atomic hydrogen, and that strong Mg II absorption systems, traditionally defined as those observed with rest–frame equivalent width Å, originate in optically–thick H I gas having column density cm -2. It must be emphasized that this is a lower limit to the column density of atomic hydrogen; it is very likely that the column density of the H I gas responsible for strong Mg II absorption is much higher than this value (see Steidel & Sargent 1992). At relatively low redshift (e.g. ) a key property of strong Mg II absorption systems is that the gas responsible for them is often found to be part of the extended gaseous halos around massive, bright galaxies, roughly with and , with little or no dependence on the spectral and morphological type (e.g. Steidel et al. 1998, 2001; Churchill et al. 2005). Chen et al. (2010) find that the extent of the Mg II absorbing gas around galaxies depends strongly on their stellar mass and more weakly on the specific star–formation rate SSFR, and suggest that this is naturally explained if gas exchange to and from galaxies, i.e. outflows and inflows, are the mechanisms that provide the gas responsible for the absorption.
The distribution of impact parameters, i.e. the distance from the line sight to the QSO (the location of the absorbing clouds) to the center of the gas host galaxies, for strong Mg II absorption to take place has been found to be in the range kpc, with covering factor in the range , depending on how the sight line to the QSO is selected. For example, if Mg II gas is known to be present at a particular redshift because of the strong absorption system observed in a QSO’s spectrum, then there is a very high probability (%) that a bright galaxy will be found nearby the LOS to the QSO as the likely host of the gas (Steidel et al. 1994). The converse case does not seem to be true. Namely, the spectra of QSOs whose LOS has impact parameter to a known bright galaxy in the above range have been observed to have strong intervening Mg II absorption systems at the redshift of the galaxy only roughly % of times (Tripp & Bowen 2005). Recently, Gauthier, Chen & Tinker (2009, 2010) and Bowen & Chelouche (2010) found evidence that the covering factor around the so–called Luminous Red Galaxies at , essentially galaxies photometrically selected for having very low specific star–formation rate (passively evolving), is significantly smaller, -15%. They suggest that either the halos of these galaxies are too hot to retain or accreted cold gas, or these passively evolving galaxies simply do not have the cool (i.e. K) outflows to fill their halos with Mg II absorbing clouds.
Ultra–strong absorbers, i.e. Å, have also been observed in the spectra of QSO, as well as star–forming galaxies where the gas is back–illuminated by the galaxies’ own UV light (Nestor et al. 2005, 2007; Tremonti et al. 2007). They are between 2 and 3 orders of magnitude rarer than weaker ones. These are generated by gas that resides either inside the galaxies or in the outflows ejected from starburst ones. Nestor et al. find that ultra–strong Mg II absorption systems can also be caused by gas in dwarf galaxies which are aligned along the LOS to the QSO, i.e. with the LOS intersecting their optical light profile. In other words, to have sufficient column density to give rise to to ultra–strong absorption, the gas hosted by dwarf galaxies needs to be located at very small impact parameter (less than a few kpc).
Nestor et al. (2005) and Rao et al. (2006) find evidence that a substantial fraction of ultra–strong absorbers, perhaps %, are also damped Lyman–alpha (DLA) absorbers, implying that the H I gas column density exceeds the value cm -2. Conversely, every DLA is also a Mg II absorber (e.g. Rao & Turnshek 2000). Although Mg II absorption can be generated by gas with column density up to orders of magnitude smaller than that of DLA, e.g. for Å, at least the most metal–rich DLA have Mg II absorption with equivalent width in the range Å (see Nestor et al. 2007), and as many as % of all DLA have Å. Rubin et al. (2010b) find that ultra–strong Mg II absorbers ( Å in their sample) produced in the outflows from star–forming galaxies at , which have stellar mass and star-formation rate in the same range as the galaxies in our GOODS and GMASS samples (see their Figure 8 and Kurk et al. 2009), have atomic hydrogen column density cm-2. Note that the equivalent width of these absorbers is smaller than the average equivalent width of our four Mg II LBG absorption systems (both components of the doublet), namely Å; the smallest equivalent width among the four of them, one of the two in G2’s spectrum, has Å. It is also smaller or comparable to the equivalent width of the individual components of the doublet estimated above.
Cases of optically–thick absorption systems (not necessarily Mg II systems) that are at least strong, i.e. Å, for which an association with an individual bright galaxy could not be made are rather rare. Examples include Tripp et al. (2005), who reported of a sub–DLA absorber with and remarkably low metallicity () for which no galaxy could plausibly provide the gas to explain the absorption (the nearest galaxy is a sub- with impact parameter kpc, while the closest galaxy has kpc); and Fumagalli et al. (2010), who looked for the galaxies responsible for two QSO DLA by imaging the area around the QSO at wavelengths below its Lyman limit, so that the QSO’s light is suppressed, offering unrestricted visibility along the line of sight, and for one case they found no galaxy host.
In summary, the conclusion from all these works is that strong and ultra–strong Mg II absorption systems ( Å) require large H I column density, especially ultra–strong absorbers, whose column density reaches the threshold value required for DLA. These conditions are thought to be encountered in the gas flows that are being exchanged to and from massive galaxies, either outflows, which are commonly observed in star–forming galaxies at high redshift, or inflows, for which there has been no direct evidence so far. In the case of the outflows, their large spatial extent, physical conditions and geometry naturally explain many of the observed properties of the absorbers, including the proximity of the line of sight to a bright galaxy ( kpc) and the inverse correlation between equivalent width and impact parameters (see Steidel et al. 2010). The case for the inflow is much less clear. The gas is expected to come from large separations from the galaxies, along what the theory predicts to be filamentary streams. Thus, a high column density does not necessarily require spatial proximity to a bright galaxy. The overall covering factor is expected to be fairly small, however, revised to % around a halo (Kimm et al. 2010; A. Dekel, private communication) from early estimates of –25% (Dekel et al. 2009). This is consistent with the paucity of inflow kinematic signature in most absorbers, as well as with the rarity of absorbers with no galaxies responsible for them.
The equivalent width of our four “LBG” Mg II systems qualifies them as ultra–strong absorbers; however, differently from most “QSO” Mg II absorption systems, intervening bright galaxies do not appear to be directly responsible for them, as we have seen in Section 4. Also, note that given the relatively low S/N ratio of our spectra, we cannot detect absorption lines significantly weaker than ultra–strong. Thus, from the spectra of our galaxies we do not have information on the presence and/or location of gas capable of generating weaker absorption.
Finally, we conclude with a crude estimate of the mass of the H I gas associated with the absorbing trough observed in the LBG spectra, as well as of the mass associated with the overdensity as a whole. Indeed, the resolved nature of galaxies as probes of absorption systems lends itself to some interesting inferences on the properties of the trough, such as a lower limit to the mass of the gas. The large equivalent width of the four absorption features and their minimum light intensity consistent with zero indicate that the absorbing gas covers the full angular extent of the LBG. Hence, making an educated assumption on the average H I column density associated with the Mg II gas based on the known properties of similar Mg II absorbers that we have discussed, a lower limit to the mass of the H I gas clouds is
where is the physical size at subtended by the angular diameter of a LBG at , i.e. the optically–bright (rest UV) part of the galaxy that mostly contributes to the observed spectra, which is typically 5–7 kpc (Giavalisco et al. 1996; Ferguson et al. 2004; Ravindranath et al. 2006). The absorber’s H I mass, however, is almost certainly larger, since it is very unlikely that it has the same angular extent of the LBG.
In turn, a crude lower limit to the total mass of the gas can be derived from the linear extent of the overdensity, a few Mpc, and the covering factor of the high–column density gas, , namely the ratio of number of observed absorbers (4) to the total number of spectra analyzed and potentially of sufficient quality to reveal the presence of ultra–strong absorption systems (21+84=105). We find
5.2 The Metal Enrichment Of The “Intra–Overdensity” Gas
The lack of the Fe II interstellar absorption lines, which generally have strength similar to the Mg II ones in star–forming galaxies (see Leitherer et al. 2010; Rubin et al. 2010a,b; see also Nestor et al. 2010 and Tremonti et al. 2007), in both the stacked spectrum of the four LBG absorption systems (Figure 3, top) and in the GMASS stack of the background galaxies (Figure 6), is the key piece of evidence that the “intra–overdensity” gas is not directly associated with, and is chemically older than, the ISM and/or the outflows of galaxies in the overdensity.
In principle, the under–abundance of Fe II could be due to depletion of Fe by dust. While both iron and magnesium are prone to dust depletion, in cold (e.g. K) and dense gas Fe can be significantly more depleted than Mg (Savage & Sembach 1996). The physical conditions for preferential depletion of Fe over Mg could be encountered in the ISM in galactic disks. However, the lack of massive, luminous galaxies ( and ) at with small ( kpc) impact parameter from the LOS to the absorbers argues against this interpretation. The few galaxies whose impact parameter would be in the plausible range to qualify as potential absorbers (assuming they have the right redshift) are not sufficiently massive. In this situation it is more likely that the absorption arises in the space between galaxies, at large impact parameter ( kpc) from any bright one or around the overdenisty as a whole. In both cases the gas is likely to have temperature K due to photoionization heating from the UV background and density similar to that of other ultra–strong Mg II absorbers, such as the gas in the outflows (see Steidel et al. 2010). In these physical conditions, the relative depletion of Mg and Fe should be similar. Moreover, such regions (i.e., low-density outer gaseous halos of galaxies or intergalactic gas clouds) generally contain little dust (e.g., Tripp et al. 2002, 2005). A more likely explanation, therefore, is that the Fe under–abundance reflects the nucleosynthetic history of the gas. Magnesium is an –element that is rapidly produced in Type II SNe, while Fe is more slowly produced in Type Ia SNe, so Fe can be under–abundant compared to Mg (e.g., McWilliam 1997). This suggests that the absorbing gas is relatively “chemically young,” or at least younger than the gas in galactic outflows. The signal-to-noise and spectral resolution of the stacked spectrum are not adequate to support a detailed quantitative analysis, but the redshift is high enough to bring a number of additional metal lines into the optical band, so future follow-up studies will be valuable for constraining the nature of the absorbing gas.
To compare the chemical composition of our “intra–overdensity” gas to that of the ISM of galaxies we need to translate the observed equivalent width ratio into an abundance ratio. Unfortunately, this is not possible, because the lines are almost certainly saturated, and thus the equivalent width is not a tracer of the gas column density. In addition, we also lack the knowledge of the H I column density, as well as of the ionization correction. Since no absorption by Fe is detected, however, and since in saturated lines the column density is underestimated, the ratio of equivalent width of Fe II to Mg II provides a crude limit to the elemental abundance ratio, if both species are contained in the same gas and partake of the same kinematics:
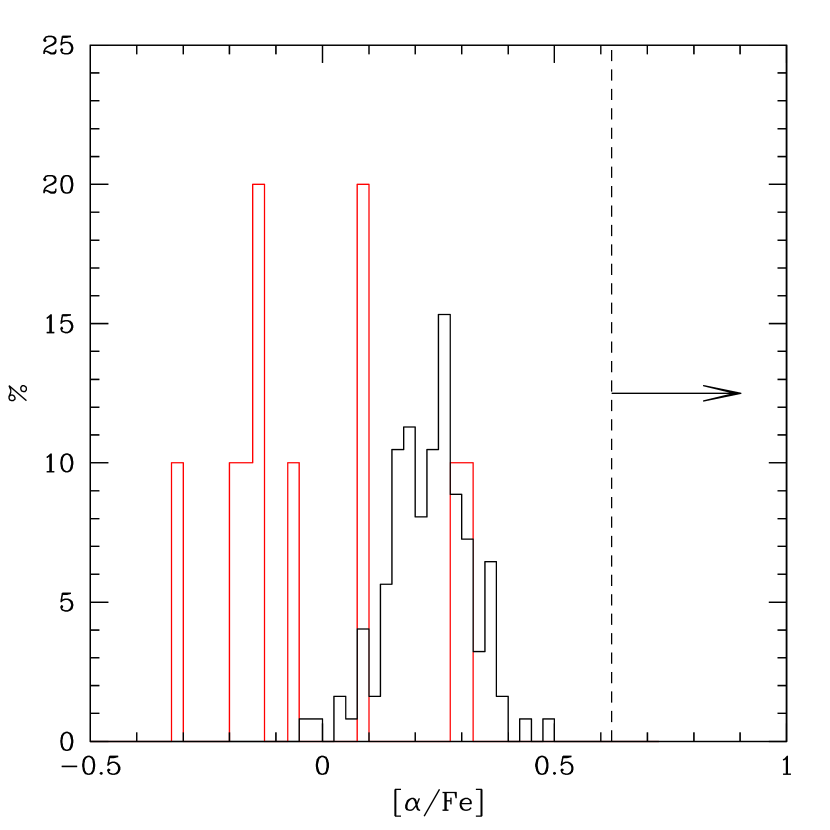
We can then compare this lower limit to measures of the abundance ratio of –elements to iron–peak in galaxies, and in particular to bright ellipticals, since these systems are more enriched in magnesium relative to iron than other galaxy types (see, e.g. Thomas et al. 2010; Jorgensen 1997; Worthey, Faber & Gonzales, 1992). Figure 13 shows the distribution of the ratio for early–type galaxies with velocity dispersion (red histogram, Sansom & Northeast 2008) and (black histogram, Thomas et al. 2005) and the lower limit to the abundance ratio of Mg and Fe in our gas estimated above. As the figure shows, the chemical enrichment pattern of our gas appears to significantly differ from that observed in the galaxies. Stars in the halo of the Milky Way also have –elements enhanced relative to iron (see Wheeler, Sneden & Truran 1989). Bonifacio et al. (2009) find that the most metal–poor stars in the halo of the Milky Way have (see their Figure 4), which provides an estimate of the elemental ratio in nucleo–synthesis products by Type II SNe. Clearly, being able to measure the ratio for our gas in future spectra with higher S/N will be invaluable to constrain its nature and the nucleo-synthetic history.
We have further investigated the Mg and Fe elemental ratio of the gas using version 8.00 of the photo-ionization code CLOUDY (Ferland et el. 1998) to calculate the column density ratio of Mg II to Fe II if photo–ionized by the metagalactic far–UV background. This is illustrated in Figure 13, where the column density ratio is plotted as a function of the ionization parameter given the QSO spectrum of Haardt & Madau (2005), assuming one–tenth solar metallicity for the gas chemical abundance and using the solar elemental ratio of by Asplund et al. (2009) for three assumed values of the H I column density. We have also repearted the calculation using the QSO+galaxy version of the Haardt & Madau spectrum, finding very similar results. The top abscissa in the figure shows the value of the H I volume density, in cm-3, corresponding to the ionization parameter for the case of column density cm-2. As the curves show, if the H I column density is sufficiently high, e.g. like that of DLAs, most of the gas cloud is shielded from the ionizing effects of the external radiation, and the column density ratio of Mg II and Fe II remains approximately constant over a relatively large range of the ionization parameter (this ratio can actually be lower than the solar value in this case because some of the Mg is in the form of Mg I). For significantly lower column density, e.g. similar to and lower than that of Lyman Limit Systems (LLS), cm-2, then the outer regions of the cloud become increasingly more ionized as the ionization parameter increases and, due to the differences in their ionization potential, the Mg II/Fe II ratio increases with it. The conclusion of this calculation is that if the column density of the gas is indeed as high as we have argued above, then the observed strength of the Mg II and Fe II absorption features is expected to be similar, if their elemental ratio is similar to solar, and similar to what observed in the ISM of star–forming galaxies in the overdensity. Since we do observe Mg II but not Fe II, even if we could have observed it, either in the combined spectrum of the LBG absorption systems or in the combined spectrum of the GMASS background galaxies, the calculation above strongly supports our interpretation that the absorbing gas is chemically younger than the ISM in galaxies. Finally, as a consistency check we have verified that if the spatial size of the absorbing cloud is of the order of kpc, i.e. the size subtended by the angular diameter of galaxies in range of redshift discussed here (e.g. see Ferguson et al. 2004), then a DLA–like column density implies H I volume density of the order of cm cm cm-3, namely in the same range of density expected given the Haardt & Madau spectrum.

5.3 Evidence Of Mg II Gas Accreting On Some Of The Galaxies?
In Section 3 we observed that the Mg II absorption line found in the co–added spectrum of the sixteen GOODS galaxies belonging to the overdensity (spectrum c) of Figure 3) seems to include a broad, asymmetric “red wing” feature extending to the red of the Mg II line, with possible additional discrete lines over–imposed to it (see spectrum c) in Figure 3). At the same time, no similar blue wing is observed in the spectrum. Such an absorption profile can result from gas along the line of sight to most of the galaxies, located in relatively close spatial proximity to them, that is moving toward the galaxies or toward the overdenisty as a whole, i.e. receding from the observer. This gas could also be accreting onto some of the galaxies. In view of the importance that such evidence would play in constraining the nature of the gas that we have identified in the context of cold accretion, we have further investigated this issue taking advantage of the GMASS spectroscopic sample, which is larger than our GOODS one and includes deeper spectra.
We have averaged together the GMASS rest–frame spectra of 33 galaxies belonging to the overdensity (, ) to provide an independent average spectrum of galaxies in the same structure where we have detected our “pristine” Mg II gas, whose equivalent exposure time of hr provides significantly higher sensitivity to gas absorption features than any individual galaxy. As a control spectrum, we have averaged together the 92 GMASS spectra of galaxies at , i.e. in the background of the overdensity this time after shifting each one of them to the rest frame. It makes no difference if the spectra are scaled prior to computing the average. Whenever possible, the redshift of the galaxies is measured from the [O II] nebular emission lines, since this provides a good measure of the systemic redshift. When [O II] is not present in the available spectral range, the redshift is estimated from the Mg II and Fe II absorption lines; 19 of the 33 overdensity galaxies and 1 of the background galaxies have [O II] redshift. We have also experimented with co–adding only galaxies with [O II] emission and those without, finding similar results, as we will discuss later. The 33 co–added spectra are shown in Figure 15 together with the GOODS stack of the overdensity galaxies and the stack of the starburst galaxies, for comparison (the latter two spectra are the same as those shown in 3). Figure 16 zooms in the spectral region around the Mg II absorption in the GMASS and GOODS stacks and also shows the velocity difference of the absorption features relative to the rest–frame wavelength of the Mg II line. Again, possible discrete absorption features to the red of the main interstellar absorption features are marked by vertical segments.

Like the GOODS, the GMASS stack of the overdensity galaxies also shows a discrete absorption feature to the red of the Mg II line, apparently characterized by two minima, at approximately the same wavelength as the redder feature of the two observed in the GOODS stack. In fact, the redder of the two minima, marked by the right vertical segment in Figure 16, coincides (within the resolution of the spectra) with the redder feature of the GOODS spectrum. Overall, the whole absorption feature, i.e. including the two contiguous minima, is detected at the level, similar to the Mg I line. The GMASS stack, however, shows a relatively strong emission line (more on this later) immediately to the red of the strong interstellar Mg II absorption line, roughly at the same wavelength of the bluer of the two discrete absorption features in the GOODS stack, as illustrated in Figures 15 and 16. Overall, although taken individually each absorption feature is detected at low level, their simultaneous presence in both the GMASS and GOODS co–added spectra and the approximated coincidence in wavelength strongly argues in favor of them being real, since the GMASS and GOODS galaxies come from two different samples and cover somewhat different regions of the GOODS–S field (see Figures 7 and 8). No similar absorption features are observed in the co–added spectrum of the 92 background galaxies at . Also, neither the two GMASS stacks nor the GOODS one show any obvious similar absorption feature to the blue of the main Mg II interstellar line.
All these absorption features, both the discrete ones and the broader, continuum one, must be caused by a distribution of intervening Mg II clouds. An obvious interpretation for their redshift relative to the Mg II doublet and for the broad profile of the broad “red wing” absorption profile is that the gas is moving toward the overdenisty and/or at least some of the galaxies contributing to the two stacked spectra. An extended Mg II cloud would produce the broad continuous “red wing” absorption profile observed in their co–added spectrum, while individual, denser clouds embedded in this medium would be responsible for the discrete features. The top horizontal scale in Figure 16 shows the velocity difference relative to the line of the Mg II doublet. Thus, the implied relative velocity of the two discrete features in the GOODS stack (spectrum c) in Figure 15) would be and , respectively. Such values of the velocity are higher than the predictions for accretion of cold gas onto halos, which are about , but they are at least qualitatively consistent with the average relative velocity between gas clouds and galaxies within the much more massive overdensity. We also recall, in this regard, that the redshift of the four intervening LBG absorption systems is displaced by up to relative to the peak of the overdensity.
The broad “red wing” is analogous to the “blue wing” absorption profile observed immediately to the blue of the far–UV interstellar metal absorption lines discussed by Steidel et al. (2010) in the same types of galaxies. In the case of the “blue wing”, the feature originates in gas outflows from the galaxies, while the “red wing” discussed here originates in inflows. Since ultra–strong Mg II absorption traces hydrogen gas with cm-2, we interpret the detection of the “red wing” as evidence of accretion of cold, chemically relatively young gas onto the overdensity. This gas might very well feed star formation in the star–forming galaxies that belong to the overdensity, although there is no direct evidence of this fact.
The broad “red wing” is not as clearly observed in the GMASS stack of the overdensity galaxies as it is in the GOODS one because of the presence of a relatively strong emission line, which is the emission component of a Mg II P–Cygni feature. As noted before, Figure 15 and Figure 16 show the presence of emission lines immediately to the red of the Å component of the Mg II doublet. Emission of Mg II is very rarely seen in starburst galaxies in the local universe that have no AGN activity (e.g. Tololo 1924-416, Kinney et al. 1993), but it appears to be more common at high redshift (Weiner et al. 2009; Rubin 2010a,b,c), where the feature is observed in conjunction with emission lines by fine–structure transitions of Fe II∗ and has a P–Cygni profile. We detect the Fe II∗ fine–structure lines in all our co–added spectra (in fact, they are detected in the majority of the individual spectra), although they do not seem to be present in the spectrum. While observational evidence of these lines is accumulating at high redshift (Weiner et al. 2009; Rubin et al. 2010a,b; Kornei et al. in preparation) very little is known about the physical mechanisms that produce them. Rubin et al. (2010c) and Prochaska, Kasen & Rubin (2011) have proposed that both the Fe II∗ fine structure emission lines and the P-Cygni Mg II feature originate by photon scattering in the outflows that characterize distant star–forming galaxies (Weiner et al. 2009; Steidel et al. 2010), although these lines can also be produced in recombination regions (Kinney et al. 1993) or AGN (Vestergaards & Wilkes 2001). The Fe II∗ lines are very well detected in two of the GMASS stacks and in the GOODS stack shown in Figure 15 (see also the stack of the GOODS spectra of the overdensity galaxies in Figure 3), where the two lines Fe II and Fe II are blended because of the lower spectral resolution. Interestingly, all the Fe II∗ lines and the Mg II emission line are stronger in the GMASS stack of the 33 overdensity galaxies than in the stack of 92 background ones, despite the longer equivalent exposure time of the latter, very likely because for nearly all of them [O II] is outside of the available spectral range, and thus their redshift is determined from the absorption features of Fe II and Mg II. Since these lines are heavily affected by the outflows, their redshift deviates from the systemic one by an random amount, between a few to several hundred km/s (Steidel et al. 2010), and thus the strength of the stack of the Fe II∗ lines, which are at the systemic (Rubin et al. 2010c), is diluted. In comparison, more than half of the redshifts of the overdensity galaxies are measured from the [O II] line.
As noted before, the Fe II∗ lines are not observed in the stacked spectrum of the starburst galaxies by Leitherer et al. (2010) reproduced in Figures 3 and 15. We suggest that this is due to the fact that UV spectroscopic observations of nearby galaxies have mostly focused on bright, relatively isolated regions of star formation, and not on the integrated light of the galaxies. Combined with the relatively small apertures of the space–born spectrometers and the large apparent diameter of the sources, this fact has likely resulted in most of the spectra not sampling the volumes of space affected by the outflows. Some of the Fe II∗ lines also seem weak in the 7–galaxies stacked spectrum at shown in Figure 3, but this is due to the relatively low S/N of the individual spectra and to the small number of galaxies entering this stack.

The fact that the full P–Cygni profile, i.e. both absorption and emission components, is not clearly recognized in our spectra (but it is very well detected in the spectra by Rubin et al. 2010a,c), especially the emission component of the Å transition of the Mg II doublet, should not come as a surprise in our relatively low resolution spectra.333The resolution of the Keck/LRIS spectra Rubin et al al. (2010a,c), where the P–Cygni profile is clearly detected in the spectra of individual galaxies, is higher than that of our spectra. That of the Keck/DEIMOS spectra by Weiner et al. (2009), who also observe the P–Cygni profile for some of the galaxies, is larger. As reported by Rubin et al. (2010a,b,c) both the fine–structure Fe∗ lines and the P–Cygni Mg II feature are observed approximately at the systemic redshift. Thus, the combined effect of the relatively low spectral resolution, the strength and large velocity width of the interstellar absorption, and the fact that a large number of galaxies with different outflow velocities enter the stack (recall that the spectra are put on the rest–frame using the redshift of the [O II] nebular line, which traces the systemic redshift of the galaxies, only when the feature is available in the spectral range) is that the emission component of the P–Cygni profile is diluted by the strong interstellar absorption. Because the generally large velocity of the outflowing gas blue–shifts the absorption component, some of the Mg II P–Cygni emission that is located at the systemic redshift survives, and this is what we are most likely observing. The emission line in the GMASS spectrum seems to exhibit an absorption feature, which, as we noted previously, is observed at the same wavelength as the red absorption feature in the red wing of the GOODS spectrum. This apparent trough could give the GMASS Mg II emission the resemblance of the double–peaked line. The emission component of the Mg II P–Cygni feature is also possibly detected in the GOODS co–added spectrum (see Figures 15 and 16). Finally, we note that a virtually identical spectral morphology of the Mg II P–Cygni profile is observed in the in the HST/FOS UV spectra of Tololo 1924-416 by Kinney et al. (1993), which have similar resolution ().
Subtracting the Mg II emission from the spectrum makes the broad “red wing” absorption profile evident in the GMASS co–added spectrum too, showing that it extends to approximately the same velocity separation from Mg II as the one in the GOODS spectrum, namely . This is illustrated in Figure 16, where the dashed line shows the residual continuum after a gaussian profile has been fitted to the emission line and subtracted. The Figure shows a zoom in of the spectral region around the Mg II doublet in the co–added spectra of the GMASS background galaxies () and of the 33 GMASS and 16 GOODS overdensity galaxies. A linear spline fit to the continuum in two spectral regions that bracket the Mg II doublet ( Å and Å) is also shown for each spectrum to help identify the absorption features. The broad “red wing” absorption feature in the GMASS spectrum of the overdensity galaxies results in part from the removal of the emission line, but also, in large part, from the presence of what look like absorption features immediately to the red of the emission line, marked by a horizontal square bracket in the Figure 16. The discrete absorption lines possibly detected in the GOODS co–added spectrum also are marked in the figure.
We emphasize that no “red wing” absorption feature seems to be present in the co–added spectrum of the GMASS background galaxies, namely spectrum a) in Figure 15, even if the (weak) emission component of the Mg II P–Cygni feature is subtracted. About three times more galaxies are included in this spectrum than in that of the overdensity galaxies. Thus, it seems unlikely that in the stack of the overdensity galaxies the feature is the result of some systematics arising during the averaging procedure. For example, one could imagine that deviations of the measured redshift of the galaxies from their systemic value might produce the feature by broadening the galaxies’ interstellar Mg II absorption line. Random deviations up to several hundred will occur for those galaxies where the [O II] nebular emission line is not available and the redshift is measured from the Mg and Fe interstellar absorption lines, which are typically blushifted relative to the systemic redshift due to the presence of outflows (Steidel et al. 2010). The co-added spectrum of the background galaxies, whose redshift are essentially all measured from the interstellar lines suggests that this is not the case. We have further investigated this possibility by separately co–adding the spectra of the GMASS overdensity galaxies with redshift measured from the [O II] emission line (19 spectra) and of those with redshift measured from the absorption lines (14 spectra), which are reproduced in Figure 17 as spectrum a) and b), respectively. Spectrum a) has a stronger Mg II P–Cygni emission component, but is otherwise qualitatively very similar to the full stack, i.e. spectrum b) of Figure 16, with a clear depression of the continuum right to the red of the emission line. Removing the emission line would result in the same “red wing” absorption profile like the one we have illustrated in 16 for the full–stack spectrum. We also note that a “blue wing” absorption is now possibly observed in spectrum a); this would be the effect of absorption in the outflows, quite similar to what observed in other UV low–ionization metal absorption lines (see Steidel et al. 2010). The “red wing” absorption in spectrum b) seems to be much weaker. The emission component of the Mg II P–Cygni feature is also weaker than in spectrum a), and while removing the feature would result in a broad “red wing” absorption, this would not reach the same extent as in the case of spectrum a). The “blue wing” due to the outflows, if present, also is very weak. Finally, because the redshift of the individual spectra entering in spectrum a) is very close to the systemic one, it can be seen that both the Mg II and Mg I absorption lines are blueshifted, by about 250 , due to the presence of outflows. Obviously, this effect cannot be observed in spectrum b) because the individual spectra are placed in the rest frame using the redshift of the absorption lines themselves.

It is important to realize that, although subtracting the emission component of the Mg II P–Cygni feature is a necessary step if one wants to explore gas accretion in quantitative details, we have little guidance on how to objectively carry out the subtraction procedure at this time; our subtraction of a gaussian fit to the line remains arbitrary. As we have mentioned earlier, the Mg II P–Cygni feature in star–forming galaxies at high redshift is observed in conjunction with the fine structure emission lines of Fe II∗, but not much else is known about these features and their empirical phenomenology and systematics, e.g. how the line strength of the two species depend on each other and on the properties of the galaxies and/or of the outflows. We are only aware of the photon scattering mechanism proposed by Rubin et al. (2010c) and Prochaska, Kasen & Rubin (2011) to explain these lines at this time. We have also checked for the possibility that some of the galaxies in our sample might host an AGN, but none is individually detected in the recently released ultra–deep Chandra X–ray image ( Msec, see Gilli et al. 2011) in the CDFS. With no guidance from either the theory or the observations, it is not possible to go beyond the qualitative and crude analysis discussed here. Rubin et al. (2010b) follow a similar procedure of fitting and subtracting the emission component of the Mg II P–Cygni feature (to derive the equivalent width of the Mg II interstellar absorption) using a five–parameter model that separately accounts for the emission and absorption components. As they discuss, this model does not produce acceptable results for co–added spectra, since it tends to be driven by noise features in the line profiles. Thus, we have decided to avoid the further complication of the model and simply remove the feature after fitting the “local” line profile with a gaussian, since this seems to give comparable results, and our initial goal is to explore the the existence and qualitative aspects of cold gas accretion.
Regardless of the details, however, even a very conservative subtraction of the line from the co–added spectra shown in figures 16 and 17 (such as simply eliminating the local excess flux) results in an obvious “red wing” absorption profile that extends from immediately to the red of the Mg II interstellar feature to from the systemic wavelength of the Mg II line.
The “red wing” absorption profile is observed in both the GMASS and GOODS co–added spectra of galaxies in the overdensity but is not observed in the much deeper stacked spectrum of the 92 background galaxies at in the background, implying that its detection is related to the presence of the overdensity itself. This suggests that the average covering factor of gas around galaxies that belong to the overdensity is substantially larger than that around isolated field galaxies. We plan to return on this issue more quantitatively in a upcoming paper.
6 Discussion And Conclusions
Three key results have emerged from this work. The first is the identification of substantial amount of “cold” gas, i.e. K, in an overdensity of galaxies at that is not directly associated with (i.e. resides in the gaseous halo of) bright galaxies, but rather is either “circum” or “intra” overdensity gas, or both. The gas appears to be chemically younger than the outflows from star–forming galaxies at the same redshift (including the galaxies in the overdensity), which have similar physical conditions (e.g. Tremonti et al. 2007). In other words, the gas is part of the structure and is spatially distributed around and/or within it but it is not part of the galaxies that belong to the structure. This gas has been identified by the Mg II absorption that it imprints in the spectra of background LBG at , by the absorption feature in the co–added spectra of a large number of galaxies in the background of the overdensity, as well as in the co–added spectrum of galaxies within the overdensity.
We can derive a crude estimate of the average covering factor of the high–column density gas from the ratio of detected intervening ultra–strong Mg II absorption systems, i.e. the 4 systems in the spectra of G1, G2 and G3, to the number of spectra that have sufficient S/N to detect such systems, namely the 21 spectra of GOODS LBGs and the 92 spectra of GMASS background galaxies. We find %. This is consistent with recent current theoretical estimates for isolated galaxies hosted in halos, i.e. % at , and given the fact that our spectra are only sensitive to absorption with large equivalent width, probably even consistent with the expected trend of increasing cold gas covering factor with larger mass, i.e. % around halos with at the same redshift (Kimm et al. 2010). The absorption features observed in the co–added spectra of the background galaxies and of the galaxies in the overdensity suggest the presence of both continuous absorption as well as absorption by discrete clouds, consistent with a projected gas distribution where structures capable of higher column density are embedded in a more diffuse medium. Observationally, the probability that gas clouds intersect the line of sight to galaxies should be larger in an overdensity than for background galaxies, since the surface density of the former is enhanced, by about six-fold in our case, than the latter. Kimm et al. (2010) suggest that the low covering factor around isolated galaxies, coupled with the fact that the interstellar absorption lines are strong and broad in velocity space, are the key factors behind the current lack of detections of cold accretion. Thus, while waiting for the sensitivity of 30–meter telescopes, targeting galaxy overdensities seems to be a more efficient way to make some progress.
Essentially no information is available about the spatial morphology of the high–column density gas, i.e. whether filamentary or not, as predicted by the simulations (e.g. Keres et al. 2005; Dekel et al. 2009). Curiously, the three LBG with the intervening Mg II absorption systems are aligned along a straight line and the spatial separation and velocity difference between the four LBG Mg II absorbers are consistent with an elongated distribution of the gas: the velocity difference between G1’s absorber and the first one of G2, , and their projected spatial separation at , kpc, are consistent with them being produced by the same gas mass. A homogeneous cloud would have to be either more massive than , the same mass of an galaxy at the same redshift (Reddy et al. 2009), if roughly spherically symmetric, or be preferentially distributed along the separation between the two absorbers, unless and we have accidentally hit two spots of high column density. Similarly, the projected separation between the second absorber of G2 and that of G3 is Mpc, and their velocity difference is . If this velocity difference were due to pure Hubble flow, then the physical distance between the two troughs would be Mpc, where the Hubble constant at is . But these two alignments can very well be just a fortuitous coincidence. If the geometry of the high–column density gas mass is filamentary, the finite size of the LBG yields a lower limit to the linear mass density along the filament, which is (10 kpc)-1, where is the gas average linear covering factor along the filament (which is different form the average volume covering factor discussed above). If this mass accretes onto some galaxy, as the spectra of galaxies in the overdensity suggest, and is converted into stars, then a lower limit to the star–formation rate that the filament can sustain is
where is the tangential velocity of the gas flow along the filament. This lower limit is in agreement with the star–formation rate of galaxies at (Daddi et al. 2007; Reddy et al. 2009). The main uncertainties here are the width of the putative filaments and the value of . It is very difficult to make more informative statements without knowing more about the large–scale geometry of the gas. The analysis of a larger number of background probes will bring improvement in this area.
All four intervening LBG Mg II absorption systems have redshift located in the wings of the redshift distribution of the overdensity, as if they tended to “avoid” the galaxies. It is possible that this is, at least in part, an observational bias due to the presence of night sky emission lines (albeit week ones) at the wavelengths of Mg II at the redshift of the peak. While one could certainly imagine the possibility of astrophysical processes that suppress high–column density gas clouds inside large concentrations of galaxies, it is hard to reach any conclusion with only four data points. Note, however, that large concentrations of galaxies, such as ours, marked by spikes in the redshift distribution, do not have properties commonly associated with galaxy clusters, although they might evolve into one (e.g. Kurk et al. 2009). Their spatial extent is much larger, by at least by one order of magnitudes, than clusters and thus their galaxy density is lower by about three orders of magnitude; no diffuse X–ray emission is observed from them, as we directly verified in our case using the ultra–deep Chandra X-ray images in the CDFS. In any case, however, the existence of high–column density gas clouds around such structures seems real, with velocity separations that can reach up to , as evidenced not only by the LBG absorption systems, but also by the absorption features observed in the GMASS co–added spectra of both background and overdensity galaxies. The observation of the “red wing” absorption profile seems to suggest that this might very well be gas associated with cold accretion onto the structure.
Information on the kinematics of the absorbing gas is minimal from the current low resolution and, in the case of the four LBG absorption systems, low S/N spectra. Since the absorption lines are very likely saturated, their velocity width mostly reflects the velocity spread of the gas along the line of sight, which is less than a few hundred . While this is certainly consistent with the general idea that the gas in cold streams is expected to be kinematically “cold” (the line broadening contributed by the temperature of the gas, , is small, of the order of ), it offers little insight into the dynamics of the gas, especially since we do not know much about the spatial geometry of the absorbing troughs.
The second key result is that the cold, K gas appears to be chemically more pristine than the ISM and the gas outflows from galaxies at similar redshift, including those galaxies that belong to the overdensity. This evidence comes from the lack of absorption by Fe (i.e. the absorption lines Fe II and Fe II ) in the co–added spectrum of the absorption systems detected in the spectra of G1, G2 and G3, and in the co–added spectrum of the 92 GMASS galaxies in the background of the overdensity. Interstellar absorption lines by Fe II and Mg II typically have similar strength at both low and high redshift, as documented by numerous works (e.g. Leitherer et al 2010; Weiner et al. 2009; Rubin et al 2010a,b) and as illustrated here by the stacked spectra of both local and high–redshift galaxies. All our co–added spectra of galaxies have both Mg an Fe absorption lines with approximately equal strength, but the co–added spectra of the four LBG absorption systems and that of the 92 GMASS background galaxies (non registered to the rest frame) only have Mg II absorption. A crude lower limit to the [/Fe] ratio derived from the ratio between the observed Mg II equivalent width and the upper limit to the Fe II one shows that the gas has a different enrichment pattern than that observed in galaxies. A calculation made with CLOUDY shows that the column density ratio of Mg II to Fe II is expected to be around unity, assuming a medium with one–tenth solar metallicity, solar elemental ratio, DLA–like H I column density and the Haardt & Madau (1997) spectrum of metagalactic ionizing radiation. Thus, our finding suggests that the cold gas we have identified has a deficiency of Fe–peak relative to elements, implying that it is very likely chemically younger and underwent a different enrichment history, than the ISM of galaxies at the same redshift, including the outflows from star–forming ones. A possibility is that this is relatively pristine cosmic gas, pre–enriched by earlier generations of stars than those forming in the galaxies of the overdensity. The overabundance of –elements over iron–peak would result from core–collapse (Type II) supernovae preferentially enriching the IGM relative to Type Ia. Whether this overabundance of –elements over Fe is due to the time delay between the occurrence of Type Ia relative to Type II events or to a top–heavy IMF, or both, cannot be addressed here.
Finally, the third key result of this paper is the possible direct detection of accretion of cold gas on the galaxies of the overdensity or on the overdenisty itself. This evidence, which we regard as tentative at this time, comes from the presence of a broad “red wing” absorption profile in both the GMASS and GOODS co–added spectra of galaxies that belong to the overdensity, i.e. a broad absorption feature that extends for about red–ward of the component of the Mg II doublet. The “red wing” absorption profile is detected, albeit at low significance, in the GOODS co–added spectrum of 16 galaxies of the overdensity. It is detected with better significance in the GMASS co–added spectrum of 33 galaxies (the equivalent of hours of exposure time), but only after the removal of the emission component of a Mg II P–Cygni feature, which therefore needs to be understood and characterized from an empirical point of view.
The emission line from the Mg II P–Cygni feature, together with emission lines from fine–structure transitions of the excited ion Fe II∗, seem to characterize the mid–UV spectra of star–forming galaxies at high redshift, possibly the result of their powerful outflows (see Rubin et al. 2010a,b,c; Prochaska et al. 2011), although their physics and phenomenology remain poorly constrained at the present. They also seem to be very common. We detect the Mg II emission component and the Fe II∗ emission lines in the GOODS and GMASS co–added spectra of galaxies that belong to the overdensity and of galaxies in the background, at .
The Mg II P–Cygni emission component clearly needs to be accounted for and removed when looking for the signature of accretion of gas capable of Mg II absorption, which can manifest itself as an extended absorption feature redshifted relative to the systemic redshift of the wavelengths of the Mg II doublet (the observed doublet is actually very often blueshifted relative to the systemic redshift because of the outflows). The quantitative details of the removal procedure, however, remain unclear, because so little is known about the physical mechanisms responsible for this emission and thus we do not have theoretical guidance on how to model and subtract the feature. Regardless, however, a conservative removal of the emission feature, i.e. simply eliminating the excess flux over the adjacent continuum emission, already yields a “red wing” absorption profile in the GMASS spectrum, which is qualitatively and quantitatively similar to that observed in the GOODS one. Thus, while it seems prudent to regard the detection of accretion as tentative, the simultaneous presence of the “red wing” in both the GMASS and GOODS co–added spectra makes the case compelling.
In summary, we have identified substantial amounts of optically–thick, cold ( K) gas associated with a large overdensity of galaxies at , which is not part of the extended halos of any massive galaxy. The gas is chemically “younger”, namely significantly more depleted of Fe relative to Mg, than the interstellar medium and the outflows of galaxies at the same redshift, including the ones in the overdensity. There is evidence from the co–added spectra of star–forming galaxies that belong to the overdensity that the gas is accreting onto them or onto the overdensity as a whole. Crude estimates of the star formation rate that this accretion can sustain (in fact, lower limits) based on the (scant) information we have on the column density of the gas, its projected spatial distribution, and its kinematics, are consistent with the measures of the galaxies’ star formation rate. We believe this is the most compelling direct observational evidence to date in favor of the so called “cold accretion”. The key, and most uncertain, pieces of information required to test theoretical predictions at this time remain 1) the HI column density of the gas, which is only inferred from the known properties of Mg II absorption systems (either in QSO or the ones in the outflows of star–forming galaxies); 2) a characterization of the geometry and spatial extent of the high–column density gas, both at large scales and in proximity of galaxies; 3) robust kinematical evidence that the gas is moving in bulk motions and accreting onto the galaxies.
Luckily, the prospect for progress seems good, even with available technology and instrumentation. Larger surveys for intervening galaxy Mg II absorption systems in the background of large cosmic structures with denser spatial sampling than presented here can be done within current capabilities by acquiring larger and, to some extent, deeper samples. These will not only provide a much more robust characterization of the accretion kinematics, but will also better constrain the geometry and spatial extent of the gas. Dedicated ultra–deep observations of bright galaxies can even yield direct estimates of the HI column density from the DLA feature that gas (at slightly higher redshift than that discussed here) with cm-2 should imprint in the UV spectra of the galaxies. Another distinct advantage of such an approach is that it offers an independent methodology to investigate gas inflows with radically different selection bias than the more traditional one of studying the circum–galactic medium back–illuminated by the background UV light provided by the galaxy’s own stars (Steidel et al. 2010). This methodology is effective in characterizing the outflows from star–forming galaxies. But we do not understand, at present, if and how the selection bias inherent in such an approach affects the observability of gas inflows, especially in isolated, field galaxies. Our approach of targeting the environment of large structures and using redder portions of the UV SED of star–forming galaxies, where the strong Mg and Fe features are located, appears promising and worth exploring further.
References
- Asplund et al. (2009) Asplund, M.; Grevesse, N.; Sauval, A.J.; Scott, P. 2009, ARA&A, 47, 481
- Balestra et al. (2010) Balestra, I.; Mainieri, V.; Popesso, P.; Dickinson, M.; Nonino, M.; Rosati, P.; Teimoorinia, H.; Vanzella, E.; Cristiani, S.; Cesarsky, C.; Fosbury, R. A. E.; Kuntschner, H.; Rettura, A. 2010, A&A, 512, 12
- Birnboim & Dekel (2003) Birnboim, Y.; Dekel, A. 2003, MNRAS, 345, 349
- Bonifacio et al. (2009) Bonifacio, P.; Spite, M.; Cayrel, R.; Hill, V.; Spite, F.; François, P.; Plez, B.; Ludwig, H.-G.; Caffau, E.; Molaro, P.; Depagne, E.; Andersen, J.; Barbuy, B.; Beers, T. C.; Nordström, B.; Primas, F.2009, A&A, 501, 519
- Bowen & Chelouche (2011) owen, D.V. & Chelouche, D. 2011, ApJ, 727, 47
- Cassata et al. (2010) Cassata, P.; Giavalisco, M.; Guo, Yicheng; Ferguson, H.; Koekemoer, A. M.; Renzini, A.; Fontana, A.; Salimbeni, S.; Dickinson, M.; Casertano, S.; Conselice, C. J.; Grogin, N.; Lotz, J. M.; Papovich, C.; Lucas, R. A.; Straughn, A.; Gardner, Jonathan P.; Moustakas, L. 2010, ApJ, 714, 79
- Ceverino et al. (2010) Ceverino, D.; Dekel, A.; Bournaud, F. 2010, MNRAS, 404, 2151
- Cimatti et al. (2008) Cimatti, A.; Cassata, P.; Pozzetti, L.; Kurk, J.; Mignoli, M.; Renzini, A.; Daddi, E.; Bolzonella, M.; Brusa, M.; Rodighiero, G.; Dickinson, M.; Franceschini, A.; Zamorani, G.; Berta, S.; Rosati, P.; Halliday, C. 2008, A&A, 482, 21
- Cresci et al. (2010) Cresci, G.; Mannucci, F.; Maiolino, R.; Marconi, A.; Gnerucci, A.; Magrini, L. 2010, Nature, 467 811
- Dahlen et al. (2010) Dahlen, T.; Mobasher, B.; Dickinson, M.; Ferguson, H.C.; Giavalisco, M.; Grogin, N.A.; Guo, Y.; Koekemoer, A.; Lee, K–S.; Lee, S–K.; Nonino, M.; Riess, A.G.; Salimbeni, S. 2010, ApJ, 724, 425
- Dekel et al. (2009b) Dekel, A.; Sari, R.; & Ceverino, D. 2009, ApJ, 703, 785
- Dekel et al. (2009a) Dekel, A.; Birnboim, Y.; Engel, G.; et al. 2009, Nature, 457,451
- Dekel & Birnboim (2006) Dekel, A.; Birnboim, Y. 2006, MNRAS, 368, 2
- Ferguson et al. (2004) Ferguson, H.C.; Dickinson, M.; Giavalisco, M.; Kretchmer, C.; Ravindranath, S.; Idzi, R.; Taylor, E.; Conselice, C.J.; Fall, S. M.; Gardner, J.P.; Livio, M.; Madau, P.; Moustakas, L.A.; Papovich, C.M.; Somerville, R.S.; Spinrad, H.; Stern, D. 2004, ApJ, 600, 107
- Ferland et al. (1998) Ferland, G.J.; Korita, K.T.; Verner, D.A.; Ferguson, J.W.; Kingdon, J.B.; Verner, E.M. 1998, PASP, 110, 761
- Fumagalli et al. (2011) Fumagalli, M.; Prochaska, J.X.; Kasen, D.; Dekel, A.; Ceverino, D.; Primack, J.R. 2011, MNRAS, submitted, astro–ph/1103.2130
- Gauthier, Chen & Tinker (2010) Gauthier, Jean-René; Chen, Hsiao-Wen; Tinker, Jeremy L. 2010, ApJ, 716, 1263
- Gauthier, Chen & Tinker (2009) Gauthier, Jean-René; Chen, Hsiao-Wen; Tinker, Jeremy L. 2009, ApJ, 702, 50
- Giavalisco et al. (2004b) Giavalisco, M.; Dickinson, M.; Ferguson, H. C.; Ravindranath, S.; Kretchmer, C.; Moustakas, L. A.; Madau, P.; Fall, S. M.; Gardner, Jonathan P.; Livio, M.; Papovich, C.; Renzini, A.; Spinrad, H.; Stern, D.; Riess, A. 2004, ApJ, 600, 103
- Giavalisco et al. (2004a) Giavalisco, M.; Ferguson, H. C.; Koekemoer, A. M.; Dickinson, M.; Alexander, D. M.; Bauer, F. E.; Bergeron, J.; Biagetti, C.; Brandt, W. N.; Casertano, S.; and 47 coauthors 2004, ApJ, 600, 93
- Giavalisco et al. (1996) Giavalisco, M.; Steidel, C.C.; Macchetto, F.D. 1996, ApJ, 470, 189
- Gilli et al. (2011) Gilli, R.; Su, J.; Norman, C.; Vignali, C.; Comastri, A.; Tozzi, P.; Rosati, P.; Stiavelli, M.; Brandt, W. N.; Xue, Y. Q.; Luo, B.; Castellano, M.; Fontana, A.; Fiore, F.; Mainieri, V.; Ptak, A. 2011, ApJ, 730, 28
- Haardt & Madau (1997) Haardt, F.; Madau, P. 1997, ApJ, 461, 20
- Keres & Hernquist (2009) Keres, D.; Hernquist, L. 2009, ApJ, 700, 1
- Jorgensen (1997) Jorgensen, I. 1997, MNRAS, 288, 161
- Keres et al. (2009) Keres, D.; Katz, N.; Davé, R.; Fardal, M.; Weinberg, D.H. 2009, MNRAS, 396, 2332
- Keres et al. (2005) Keres, D.; Katz, N.; Weinberg, D.H.; Davé, R. 2005, MNRAS, 363, 2
- Kimm et al. (2010) Kimm, T.; Slyz, A.; Devriendt, J.; Pichon, C. 2010, MNRAS, submitted, astro–ph/1012.0059
- Kurk et al. (2009) Kurk, J.; Cimatti, A.; Zamorani, G.; Halliday, C.; Mignoli, M.; Pozzetti, L.; Daddi, E.; Rosati, P.; Dickinson, M.; Bolzonella, M.; Cassata, P.; Renzini, A.; Franceschini, A.; Rodighiero, G.; Berta, S. 2009, A&A, 504, 331
- Leitherer et al. (2010) Leitherer, C.; Tremonti, C.A.; Heckman, T.M.; Calzetti, D., 2010, AJ, in press, astro–ph/1011.0385
- Martin (2006) Martin, C.L. 2006, ApJ, 647, 222
- McWilliam (1997) McWilliam, A. 1997, ARA&A, 35, 503
- Nestor et al. (2010) Nestor, D.B.; Johnson, B.D.; Wild, V.; Ménard, B.; Turnshek, D.A.; Rao, S.; Pettini, M. 2010, MNRAS, in press, astro–ph/1003.0693
- Nestor et al. (2007) Nestor, D.B.; Turnshek, D.A.; Rao, S.M.; Quider, A.M. 2007, ApJ, 658, 185
- Nonino et al. (2009) Nonino, M.; Dickinson, M.; Rosati, P.; Grazian, A.; Reddy, N.; Cristiani, S.; Giavalisco, M.; Kuntschner, H.; Vanzella, E.; Daddi, E.; Fosbury, R. A. E.; Cesarsky, C. 2009, ApJS, 183, 244
- Popesso et al. (2009) Popesso, P.; Dickinson, M.; Nonino, M.; Vanzella, E.; Daddi, E.; Fosbury, R. A. E.; Kuntschner, H.; Mainieri, V.; Cristiani, S.; Cesarsky, C.; Giavalisco, M.; Renzini, A.; GOODS Team 2009, A&A, 494, 443
- Prochaska et al. (2011) Prochaska, J.X.; Kasen, D; Rubin, K 2011, ApJ, in press, astro-ph/1102.3444
- Rauch et al. (2008) Rauch, M.; Haehnelt, M.; Bunker, A.; Becker, G.; Marleau, F.; Graham, J.; Cristiani, S.; Jarvis, M.; Lacey, C.; Morris, S.; Peroux, C.; Rottgering, H.; Theuns, T. 2008, ApJ, 681, 856
- Ravindranath et al. (2006) Ravindranath, S.; Giavalisco, M.; Ferguson, H.C.; Conselice, C.; Katz, N.; Weinberg, M.; Lotz, J.; Dickinson, M.; Fall, S.M.; Mobasher, B.; Papovich, C. 1006, ApJ, 652, 963
- Reddy et al. (2008) Reddy, N.A.; Steidel, C.C.; Pettini, M.; Adelberger, K.L.; Shapley, A.E.; Erb, D.K.; Dickinson, M. 2008, ApJS, 175, 48
- Rubin et al. (2010c) Rubin, K.H.R.; Prochaska, J.X.; Menard, B.; Murray, N.; Kasen, D.; Koo, D.C.; Phillips, A.C. 2010, ApJ, submited, astro-ph/1008.3397
- Rubin et al. (2010b) Rubin, K.H.R.; Weiner, B.J.; Koo, D.C.; Martin, C.L.; Prochaska, J. X.; Coil, A.L.; Newman, J.A. 2010, ApJ, 719, 1503
- Rubin et al. (2010a) Rubin, K.H.R.; Prochaska, J.X.; Koo, D.C.; Phillips, A.C.; Weiner, B.J. 2010, ApJ, 712, 574
- Sansom & Northeast (2008) Sansom, A.E.; Northeast, M.S. 2008, MNRAS, 387, 331
- Savage & Sembach (1996) Savage, B.D.; Sembach, K.R. 1996, ARAA, 34, 279
- Shapley et al. (2003) Shapley, A.E.; Steidel, C.C.; Pettini, M.; Adelberger, K.L. 2003, ApJ, 588, 65
- Steidel et al. (2010) Steidel, C.C.; Erb, D.K.; Shapley, A.E.; et al. 2010, ApJ, 717, 289
- Steidel et al. (1996) Steidel, C.C.; Giavalisco, M.; Pettini, M.; Dickinson, M; AAdekberger, K.L. 1996, ApJ, 462, 17
- Steidel & Sargent (1992) Steidel, C.C.; Sargent, W.L.W. 1992, ApJS, 80, 1
- Thomas et al. (2010) Thomas, D.; Maraston, C.; Schawinski, K.; Sarzi, M.; Silk, J. 2010, MNRAS, 404, 1775
- Thomas et al. (2005) Thomas, D.; Maraston, C.; Bender, R.; Mendes de Oliveira, C. 2005, ApJ, 621, 673
- Tremonti et al. (2007) Tremonti, C.A.; Moustakas, J.; Diamond–Stanic, A.M.; 2007, ApJ, 663, 77
- Tripp et al. (2005) Tripp, T.M.; Jenkins, E.B.; Bowen, D.V.; Prochaska, J.X.; Aracil, B.; Ganguly, R. 2005, ApJ, 619, 714
- Tripp & Bowen (2005) Tripp, T.M. & Bowen, D.V. 2005, in Probing Galaxies through Quasar Absorption Lines, IAU Colloquium 199, March 14-18 2005, Shanghai, People’s Republic of China, edited by Peter R. Williams, Cheng-Gang Shu and Brice Menard. Cambridge: Cambridge University Press 2005, pp. 5–23
- Tripp et al. (2002) Tripp, T. M.; Jenkins, E. B.; Williger, G. M.; Heap, S. R.; Bowers, C. W.; Danks, A. C.; Davé, R.; Green, R. F.; Gull, T. R.; Joseph, C. L.; Kaiser, M. E.; Lindler, D.; Weymann, R. J.; Woodgate, B. E. 2002, ApJ, 575, 697
- Vanzella et al. (2009) Vanzella, E.; Giavalisco, M.; Dickinson, M.; Cristiani, S.; Nonino, M.; Kuntschner, H.; Popesso, P.; Rosati, P.; Renzini, A.; Stern, D.; Cesarsky, C.; Ferguson, H. C.; Fosbury, R. A. E. 2010, ApJ, 695, 1163
- Vanzella et al. (2008) Vanzella, E.; Giavalisco, M.; Dickinson, M.; Cristiani, S.; Nonino, M.; Kuntschner, H.; Popesso, P.; Rosati, P.; Renzini, A.; Stern, D.; Cesarsky, C.; Ferguson, H. C.; Fosbury, R. A. E. 2008, A&A, 478, 83
- Vanzella et al. (2006) Vanzella, E.; Cristiani, S.; Dickinson, M.; Kuntschner, H.; Nonino, M.; Rettura, A.; Rosati, P.; Vernet, J.; Cesarsky, C.; Ferguson, H. C.; Fosbury, R. A. E.; Giavalisco, M.; Grazian, A.; Haase, J.; Moustakas, L. A.; Popesso, P.; Renzini, A.; Stern, D.; GOODS Team 2006, A&A, 454, 423
- Vanzella et al. (2005) Vanzella, E.; Cristiani, S.; Dickinson, M.; Kuntschner, H.; Moustakas, L. A.; Nonino, M.; Rosati, P.; Stern, D.; Cesarsky, C.; Ettori, S.; Ferguson, H. C.; Fosbury, R. A. E.; Giavalisco, M.; Haase, J.; Renzini, A.; Rettura, A.; Serra, P.; The Goods Team 2005, A&A, 434, 53
- Worthey, Faber & Gonzalez (1992) Worthey, Guy, Fabe, S.M.; Gonzalez, J.J. 1992, ApJ, 398, 69
- Weiner et al. (2009) Weiner, B.J.; Coil, A.L.; Prochaska, J.X.; Newman, J.A.; Cooper, M.C.; Bundy, K.; Conselice, C.J.; Dutton, A.A.; Faber, S. M.; Koo, D.C.; Lotz, J.M.; Rieke, G.H.; Rubin, K.H.R., 2009, ApJ, 692, 187