The first observation of optical pulsations from a soft gamma repeater: SGR 0501+4516
Abstract
We present high-speed optical photometry of the soft gamma repeater SGR 0501+4516, obtained with ULTRACAM on two consecutive nights approximately 4 months after the source was discovered via its -ray bursts. We detect SGR 0501+4516 at a magnitude of . We present the first measurement of optical pulsations from an SGR, deriving a period of s, in excellent agreement with the X-ray spin period of the neutron star. We compare the morphologies of the optical pulse profile with the X-ray and infrared pulse profiles; we find that the optical, infrared and harder X-rays share similar double-peaked morphologies, but the softer X-rays exhibit only a single-peaked morphology, indicative of a different origin. The optical pulsations appear to be in phase with the X-ray pulsations and exhibit a root-mean-square pulsed fraction of %, approximately a factor of two greater than in the X-rays. Our results find a natural explanation within the context of the magnetar model for SGRs.
keywords:
stars: neutron – pulsars: individual: SGR 0501+4516.1 Introduction
Soft gamma repeaters (SGRs) derive their name from the manner in which they are usually discovered – the emission of repeated ‘short bursts’ of hard X-rays/soft -rays with durations of 0.10.2 s and luminosities of 10381041 erg s-1. Less frequently, SGRs emit even more energetic (10411043erg s-1) bursts of longer duration (160 s), known as ‘intermediate flares’, and rarer still, ‘giant flares’ (10441047erg s-1, 300600 s), during which, for a fleeting instant, the SGR outshines the entire Galaxy. For a review of SGRs, see Woods & Thompson (2006) and Mereghetti (2008).
As well as periods of bursting/flaring, SGRs also exhibit persistent X-ray emission, from which it has been deduced that SGRs are all isolated neutron stars with relatively long spin periods in the range 29 s, relatively rapid spin-down rates of 10-1010-12 s s-1 and high inferred dipole magnetic field strengths of 10141015 G (however, see Rea et al. 2010). The loss of rotational energy is insufficient to explain the persistent X-ray luminosity and hence an alternative energy source is required. The most-commonly accepted model is the decay of the strong magnetic field. This so-called ‘magnetar’ model can explain both the bursts/flares and the persistent emission of the SGRs, the former via cracking of the neutron-star crust induced by the drifting field, and the latter via internal heating and magnetospheric currents induced by the drifting/twisting field (Thompson & Duncan 1995, Thompson et al. 2002). Alternative theories to the magnetar model do exist, the most prominent being the ‘fall-back disc’ model (van Paradijs et al. 1995, Chatterjee et al. 2000, Alpar 2001). In this model, the persistent X-ray emission from SGRs, and the closely-related Anomalous X-ray Pulsars (AXPs), is powered by the accretion of material left over from the supernova explosion that formed the neutron star.
Only 21 SGRs and AXPs are currently
known111McGill SGR/AXP Online Catalogue:
http://www.physics.mcgill.ca/pulsar/magnetar/main.html, 7 of
which are confirmed as SGRs (although the distinction between SGRs and
AXPs is becoming increasingly blurred, e.g. Rea
et al. 2009). The
discovery of each new source is therefore of considerable scientific
interest. On 2008 August 22, the Swift Burst Alert Telescope
(BAT), observed multiple, short ( ms) bursts of soft
( keV) -rays from a source close to the Galactic plane
(Barthelmy
et al., 2008). The source’s position, and the duration, energy,
and repetition of the bursts, led to the classification of the object
as a soft gamma repeater, SGR 0501+4516 (Barthelmy
et al., 2008); at the
time, this was the first new SGR to be discovered for a
decade. Subsequent observations of the X-ray afterglow allowed the
spin period (Göğüş et al., 2008) and rate of period decrease
(Woods et al., 2008) to be measured, further supporting the source’s
classification as an SGR. Detailed studies of SGR 0501+4516 in the
X-rays have been published by Rea
et al. (2009) and Göğüş et al. (2010). No
radio counterpart of the SGR was detected (Hessels et al., 2008), but a
faint, possibly variable, object coincident with the X-ray afterglow
was discovered in the infrared (Tanvir &
Varricatt, 2008) and optical
(Fatkhullin et al., 2008). In this paper, we present the results of
follow-up, time-resolved optical observations of SGR 0501+4516,
obtained with the aim of understanding the emission processes at work.
2 Observations and data reduction
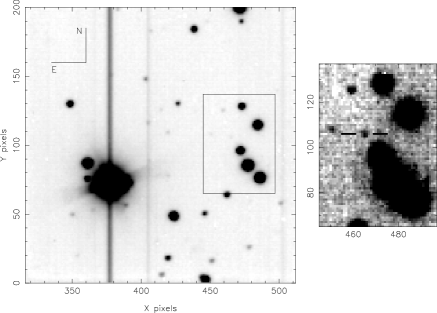
We observed the proposed optical counterpart of SGR 0501+4516 using the high-speed, triple-beam camera ULTRACAM (Dhillon et al., 2007) on the 4.2 m William Herschel Telescope on La Palma. We obtained 10 152 , and frames, each of 0.475 s exposure time (a run length of 1.4 hr), on 2008 December 31, and a further 6836 such frames (a run length of 1.0 hr) 26 hours later on 2009 January 1. ULTRACAM was used in two-windowed mode, giving a dead time between each frame of 0.024 s, where each frame is time-stamped to a relative (i.e. frame-to-frame) accuracy of 50 s and to an absolute accuracy of 1 ms using a dedicated GPS system (Dhillon et al., 2007). Observations of the SDSS standard G 24338 (Smith et al., 2002) were also obtained to flux calibrate the data. Both nights were photometric with seeing of 0.81.2′′ and first-quarter Moon. The sum of the -band frames obtained on 2009 January 1 is shown in Figure 1.
The data were reduced using the standard ULTRACAM data reduction software (Dhillon et al., 2007). All frames were first debiased and then flat-fielded, the latter using the median of twilight sky frames taken with the telescope spiralling. Adopting the same successful approach that we used in our studies of the AXPs 4U 0142+61 (Dhillon et al., 2005) and 1E 1048.15937 (Dhillon et al., 2009), we extracted light curves of SGR 0501+4516 using two different techniques:
2.1 Technique (i)
First, we extracted a light curve of SGR 0501+4516 by shifting each frame to correct for image motion and then adding them into 10 evenly-spaced phase bins using the X-ray epoch, spin period and spin-down rate of Rea et al. (2009). This ephemeris is accurate enough to cover the epoch of our optical observations and is in good agreement with the original X-ray ephemeris reported by Israel et al. (2008). An optimal photometry algorithm (Naylor, 1998) was then used to obtain sky-subtracted counts from SGR 0501+4516 and an 13 comparison star 28′′ to the east of the SGR, the latter acting as the reference for the profile fits and transparency-variation correction (although this correction made only a negligible difference to the light curves). The position of SGR 0501+4516 relative to the comparison star was determined from a sum of all the images, and this offset was then held fixed during the reduction so as to avoid aperture centroiding problems. The sky level was determined from a clipped mean of the counts in an annulus surrounding the target stars and subtracted from the object counts.
2.2 Technique (ii)
A light curve was also obtained using an independent method, where we omitted the phase binning step described in Section 2.1 and simply performed optimal photometry on the 16 988 individual data frames, followed by a search for the X-ray period in a periodogram.
3 Results
3.1 Magnitudes
Figure 1 shows that we have clearly detected an object in the band with magnitude = 24.40.1 at position RA, in excellent agreement with the Chandra X-ray position of SGR 0501+4516 (Göğüş et al., 2010). The source remained undetected in the and bands to 3 limiting magnitudes of and , as expected due to the high hydrogen column density ( cm-2, Rea et al. 2009) at the low galactic latitude of the SGR. The -band magnitude of the source in our observations is fainter than the values of on 2008 August 25 (Fatkhullin et al., 2008) and on 2008 September 2 (Ofek et al., 2008), indicating that the SGR had declined in brightness by approximately one magnitude in the 4 months since ouburst.
3.2 Optical light curves

The first data reduction technique (Section 2.1) resulted in the light curves shown as solid lines in Figures 2a, 2b and 2c. The light curves clearly show a double-peaked pulse profile, with a broad peak around phase 0.15 and a narrower peak around phase 0.55 (where phase 0 is arbitrarily defined as MJD 54701.0 in the X-ray ephemeris of Rea et al. 2009). The fact that the profile exhibits approximately the same morphology, phasing and pulsed fraction on both nights is strong evidence that the optical pulsations are real.
An independent test of the reality of the optical pulsations can be obtained from the second data reduction technique (Section 2.2). Rather than folding the data on the X-ray ephemeris, we can instead determine the pulse period directly from our optical data using a periodogram. The non-sinusoidal nature of the pulsation profile led us to use the Phase Dispersion Minimization (PDM) technique (Stellingwerf, 1978) to construct a periodogram, where the light curve is folded on a set of trial frequencies into 10 phase bins and the normalised variance of the data in each binned light curve is then plotted as a function of frequency. The results are shown in Figure 3c. The deepest trough, and hence most likely period, in the periodogram occurs at s (where the error is given by the width () of a Gaussian fit to the trough), in excellent agreement with the X-ray period of s (Rea et al., 2009). The corresponding light curves are shown as dashed lines in Figures 2a, 2b and 2c and are in good agreement with the solid lines obtained using the first data reduction technique, lending additional confidence to our reduction and analysis techniques.

To test the robustness of the optical period, we constructed periodograms of each night separately (Figures 3a and 3b); the deepest trough on each night is indeed coincident with the X-ray period. We also constructed 1000 randomised light curves from the original 16 988-point light curve by randomly re-ordering the time-series: none of the resulting 1000 PDM periodograms showed a lower trough than the one at 5.7622 s. To check for instrumental artefacts, we calculated the periodograms of the sky, the comparison star, object position and object FWHM – none showed any evidence for a periodicity at 5.7622 s. As a final test, we also calculated a sine-fitting based (Lomb-Scargle) periodogram of the light curve (Press & Rybicki, 1989) – as expected the strongest peak occurs at precisely half the period determined from the PDM periodogram. No other significant signals at shorter or longer periods are present in the periodograms, and there is no evidence for optical bursts in the light curve at levels over 4 above the mean.
3.3 X-ray light curves
The evidence outlined above is conclusive – we have detected optical pulsations from SGR 0501+4516 on the same period as the X-ray pulsations. To compare the optical and X-ray pulse profiles, we show keV data obtained with the Swift X-ray telescope on 2008 December 24 and 2009 January 7 in Figure 2d and keV data obtained with the XMM-Newton X-ray telescope on 2008 August 29 and 2008 September 30 in Figure 2e (see Rea et al. (2009) and references therein). Like the optical light curves, the X-ray data have been referred to the Solar System barycentre and folded on the X-ray ephemeris of Rea et al. (2009), which means that the relative optical/X-ray phasing is correct. The keV X-ray pulse profile has a broad, single-humped morphology centred around phase 0.1, in stark contrast to the double-peaked optical profile. The broad optical peak occurs at approximately the same phase as the keV X-ray peak, with the secondary optical maximum more or less coincident with the X-ray minimum. The harder X-rays between keV, on other hand, look remarkably similar to the optical light curves.
3.4 Infrared light curve
As part of a study of the long-term infrared light curve (Levan et al., in preparation), we also obtained some high-speed -band photometry of SGR 0501+4516. These data were obtained with the Near Infrared Imager (NIRI) on the 8.1 m Gemini-North telescope in Hawaii on 2009 January 28, when the SGR had a magnitude of (c.f. on 2008 August 25; Rea et al. 2008). The individual frames were reduced in the standard fashion using the NIRI pipeline, utilizing a sky frame to remove quadrant offsets, and subtracting a column-stacked median in order to remove low-level striping in the data. Object counts were then extracted in the manner outlined in Section 2.2. The resulting light curve, consisting of 1168 data points each of 1 s exposure time and 6 s dead time, was folded into 10 phase bins using the same ephemeris that was used to fold the optical and X-ray data (Rea et al., 2009). However, unlike ULTRACAM, Swift-BAT and XMM-Newton, the accuracy of the absolute time-stamping of Gemini-NIRI data frames is not known, and hence the absolute phase of the -band light curve is uncertain. We therefore added a phase offset of 0.1 (i.e. 0.6 s) to the light curve in order to align the two minima around phases 0.35 and 0.85 with the corresponding minima in the optical light curves. The result is shown in Figure 2f. Assuming this phase offset is justified, it can be seen that the infrared light curve shows pulsations with a similar morphology to the optical light curves, albeit with a lower pulsed fraction: The rms pulsed fractions (see Dhillon et al. (2005) for the definition used) of the light curves presented in Figure 2 are 527%, 304%, 265% and 205% in the optical, 0.510 keV X-rays, 812 keV X-rays and infrared, respectively.
We believe that our detection of infrared pulsations is robust – a periodogram analysis similar to the one we performed with the optical data (Section 3.2) shows a peak at exactly half the X-ray rotation period with a strength that lies in the top 0.7% of all the peaks in the periodogram. Although this is not significant enough to claim an independent detection of the period in the infrared (there are still many stronger peaks in the periodogram), it does lend support to the reality of the observed infrared pulsations.
4 Discussion and conclusions
Our detection of optical pulsations on the X-ray spin period has confirmed that the proposed optical and infrared counterpart reported by Fatkhullin et al. (2008) and Tanvir & Varricatt (2008) is indeed SGR 0501+4516. This makes it the first SGR with an unambiguously-detected222SGR 180620 (Kosugi et al. 2005, Israel et al. 2005) and SGR 1900+14 (Testa et al., 2008) have faint, unconfirmed infrared counterparts in crowded fields, based on the observation of long-term variability. counterpart at these wavelengths, providing us with a unique opportunity to study the emission mechanism.
The optical properties of SGR 0501+4516 are remarkably similar to those exhibited by the two AXPs with detected optical pulsations, 4U 0142+61 (Kern & Martin 2002, Dhillon et al. 2005) and 1E 1048.15937 (Dhillon et al., 2009). All three objects exhibit optical light curves with broadly similar pulsed fractions and pulse profiles that are in phase with the X-rays. This supports the widely-accepted link between the AXPs and SGRs, and indicates that they share the same optical emission mechanism. The pulse profiles of SGR 0501+4516 are also remarkably similar to Geminga, a rotation-powered, middle-aged, radio-quiet pulsar with a spin period of 0.237 s and a magnetic field strength approximately two orders of magnitude lower than that proposed for SGR 0501+4516 (Bignami & Caraveo, 1996). Like SGR 0501+4516, Geminga exhibits double-peaked optical and hard X-ray pulse profiles and a single-peaked modulation in the soft X-rays (Shearer et al., 1998).
It is difficult to reconcile the results presented in Section 3 with the simplest form of the fall-back disc model of AXPs and SGRs, as any optical emission is predicted to be due to reprocessed X-rays from the disc (Perna & Hernquist, 2000) and hence should have the same or lower pulsed fraction and a similar morphology. It is possible to appeal to beaming effects or special geometries, so that the X-ray pulsations we see are different to those seen by the disc, but such models seem unlikely now that optical pulsations with similar properties have been discovered in one SGR and two AXPs. Further modelling would be required, however, to confirm/refute whether or not our observations are consistent with more elaborate forms of the fall-back disc model, such as the disc-star dynamo model (Cheng & Ruderman 1991; Ertan & Cheng 2004).
Pulsed optical emission in SGR 0501+4516 can be explained within the context of the magnetar model by non-thermal emission from the inner magnetosphere (see Zane et al. (2011) and references therein). In this model, the softest X-rays in the 0.5-12 keV range are thermal photons from the neutron star surface, and the hardest X-rays in this range are produced by resonant cyclotron scattering of the surface photons by mildly relativistic particles moving along the closed field lines in the inner magnetosphere. The optical and infrared emission is then produced slightly further out in the magnetosphere by curvature radiation emitted by relativistic electrons moving along the closed field lines. The shared magnetospheric origin of the optical, infrared and harder X-rays suggest that they might also share similar pulse profiles, as opposed to the softer X-rays from the neutron star surface. This is exactly as observed in Figure 2 and provides strong motivation to extend the model of Zane et al. (2011) to predict pulse profiles for detailed comparison with these data.
Acknowledgements
The authors acknowledge the support of the STFC. SPL also acknowledges the support of an RCUK Fellowship. The William Herschel Telescope is operated on the island of La Palma by the Isaac Newton Group in the Spanish Observatorio del Roque de los Muchachos of the Instituto de Astrofisica de Canarias.
References
- Alpar (2001) Alpar M. A., 2001, ApJ, 554, 1245
- Barthelmy et al. (2008) Barthelmy S. D., Baumgartner W. H., Beardmore A. P., Burrows D. N., Cummings J. R., Evans P. A., Gehrels N., Godet O., Guidorzi C., Holland S. T., Kennea J. A., Mangano V., Mao J., Marshall F. E., O’Brien P. T., Osborne J. P., Pagani C., Page K. L. e. a., 2008, The Astronomer’s Telegram, 1676, 1
- Bignami & Caraveo (1996) Bignami G. F., Caraveo P. A., 1996, ARA&A, 34, 331
- Chatterjee et al. (2000) Chatterjee P., Hernquist L., Narayan R., 2000, ApJ, 534, 373
- Cheng & Ruderman (1991) Cheng K. S., Ruderman M., 1991, ApJ, 373, 187
- Dhillon et al. (2005) Dhillon V. S., Marsh T. R., Hulleman F., van Kerkwijk M. H., Shearer A., Littlefair S. P., Gavriil F. P., Kaspi V. M., 2005, MNRAS, 363, 609
- Dhillon et al. (2009) Dhillon V. S., Marsh T. R., Littlefair S. P., Copperwheat C. M., Kerry P., Dib R., Durant M., Kaspi V. M., Mignani R. P., Shearer A., 2009, MNRAS, 394, L112
- Dhillon et al. (2007) Dhillon V. S., Marsh T. R., Stevenson M. J., Atkinson D. C., Kerry P., Peacocke P. T., Vick A. J. A., Beard S. M., Ives D. J., Lunney D. W., McLay S. A., Tierney C. J., Kelly J., Littlefair S. P., Nicholson R., Pashley R., Harlaftis E. T., O’Brien K., 2007, MNRAS, 378, 825
- Ertan & Cheng (2004) Ertan Ü., Cheng K. S., 2004, ApJ, 605, 840
- Fatkhullin et al. (2008) Fatkhullin T., de Ugarte Postigo A., Castro-Tirado A. J., Gorosabel J., Jelinek M., Sokolov V., Guziy S., Pozanenko A., Sonbas E., Perez-Ramirez D., 2008, GRB Coordinates Network, 8160, 1
- Göğüş et al. (2008) Göğüş E., Woods P., Kouveliotou C., 2008, The Astronomer’s Telegram, 1677, 1
- Göğüş et al. (2010) Göğüş E., Woods P. M., Kouveliotou C., Kaneko Y., Gaensler B. M., Chatterjee S., 2010, ApJ, 722, 899
- Hessels et al. (2008) Hessels J., Rea N., Ransom S., Stappers B., 2008, GRB Coordinates Network, 8134, 1
- Israel et al. (2005) Israel G., Covino S., Mignani R., Stella L., Marconi G., Testa V., Mereghetti S., Campana S., Rea N., Götz D., Perna R., Lo Curto G., 2005, A&A, 438, L1
- Israel et al. (2008) Israel G. L., Woods P., Dall’Osso S., Esposito P., Rea N., Kouveliotou C., Mangano E. G. V., Romano P., Palmer D., Gehrels N., Stella L., Zane S., 2008, The Astronomer’s Telegram, 1837, 1
- Kern & Martin (2002) Kern B., Martin C., 2002, Nat, 417, 527
- Kosugi et al. (2005) Kosugi G., Ogasawara R., Terada H., 2005, ApJ, 623, L125
- Mereghetti (2008) Mereghetti S., 2008, A&AR, 15, 225
- Naylor (1998) Naylor T., 1998, MNRAS, 296, 339
- Ofek et al. (2008) Ofek E. O., Kiewe M., Arcavi I., 2008, GRB Coordinates Network, 8229, 1
- Perna & Hernquist (2000) Perna R., Hernquist L., 2000, ApJ, 544, L57
- Press & Rybicki (1989) Press W. H., Rybicki G. B., 1989, ApJ, 338, 277
- Rea et al. (2010) Rea N., Esposito P., Turolla R., Israel G. L., Zane S., Stella L., Mereghetti S., Tiengo A., Götz D., Göğüş E., Kouveliotou C., 2010, Science, 330, 944
- Rea et al. (2009) Rea N., Israel G. L., Turolla R., Esposito P., Mereghetti S., Götz D., Zane S., Tiengo A., Hurley K., Feroci M., Still M., Yershov V., Winkler C., Perna R., Bernardini F., Ubertini P., Stella L., Campana S., van der Klis M., Woods P., 2009, MNRAS, 396, 2419
- Rea et al. (2008) Rea N., Rol E., Curran P. A., Skillen I., Russell D. M., Israel G. L., 2008, GRB Coordinates Network, 8159, 1
- Shearer et al. (1998) Shearer A., Golden A., Harfst S., Butler R., Redfern R. M., O’Sullivan C. M. M., Beskin G. M., Neizvestny S. I., Neustroev V. V., Plokhotnichenko V. L., Cullum M., Danks A., 1998, A&A, 335, L21
- Smith et al. (2002) Smith J. A., Tucker D. L., Kent S., Richmond M. W., Fukugita M., Ichikawa T., Ichikawa S., Jorgensen A. M., Uomoto A., Gunn J. E., Hamabe M., Watanabe M., Tolea A., Henden A., Annis J., Pier J. R., McKay T. A., Brinkmann J., Chen B., Holtzman J., Shimasaku K., York D. G., 2002, AJ, 123, 2121
- Stellingwerf (1978) Stellingwerf R. F., 1978, ApJ, 224, 953
- Tanvir & Varricatt (2008) Tanvir N. R., Varricatt W., 2008, GRB Coordinates Network, 8126, 1
- Testa et al. (2008) Testa V., Rea N., Mignani R. P., Israel G. L., Perna R., Chaty S., Stella L., Covino S., Turolla R., Zane S., Lo Curto G., Campana S., Marconi G., Mereghetti S., 2008, A&A, 482, 607
- Thompson & Duncan (1995) Thompson C., Duncan R. C., 1995, MNRAS, 275, 255
- Thompson et al. (2002) Thompson C., Lyutikov M., Kulkarni S. R., 2002, ApJ, 574, 332
- van Paradijs et al. (1995) van Paradijs J., Taam R. E., van den Heuvel E. P. J., 1995, A&A, 299, L41
- Woods et al. (2008) Woods P. M., Göğüş E., Kouveliotou C., 2008, The Astronomer’s Telegram, 1691, 1
- Woods & Thompson (2006) Woods P. M., Thompson C., 2006, in Lewin W. H. G., van der Klis M., eds, Compact Stellar X-ray Sources. CUP, Cambridge, p. 547
- Zane et al. (2011) Zane S., Nobili L., Turolla R., 2011, in Rea N., Torres D. F., eds, High-Energy Emission from Pulsars and their Systems Springer-Verlag, Berlin, p. 329 (arXiv:1008.1725)