Resolved optical-infrared SEDs of galaxies: universal relations and their break-down on local scales
Abstract
A large body of evidence has demonstrated that the global rest-frame optical and infrared colours of galaxies correlate well with each other (i.e. , with ), as well as with other galactic properties such as surface brightness and morphology. However the processes that lead to the observed correlations are contrary; the stellar light that contributes to the optical is readily absorbed by dust which emits in the IR. Thus on small scales we expect these correlations to break down. We examine here seven nearby galaxies ranging from early- to late-types, which have all been smoothed to the same physical scale and signal-to-noise ratio, using data from the optical to the mid-IR (-band to m). By examining these galaxies on a pixel-by-pixel basis we demonstrate that there is disconnect between the optical and IR when normalized to the near-IR (-band). For five of the seven galaxies we can decompose this disconnect into two distinct components through a Principal Component Analysis of the -band normalized spectral energy distribution of the pixels: one mainly correlated with variations in the IR, the other correlated with variations in the optical. The two exceptions are the elliptical galaxy NGC 4552, whose SED can be well reproduced using a single principal component, and the highly inclined spiral NGC 3521, due to its complex dust geometry. By mapping these two components in the five “regular” galaxies, it is clear they arise from distinct spatial regions. By comparing these components with the surface brightnesses in H and -band we demonstrate that the IR dominated component is strongly associated with the specific star-formation rate, while the optical-dominated component is broadly associated with the stellar mass density. However, when the pixels of all galaxies are compared, the well known optical–IR colour correlations return, demonstrating that the variance observed within galaxies is around a mean which follows the well-known trend. As a final step, we extend this work by examining the extremely tight correlations observed between the IRAC–near-IR colours, and demonstrate that these correlations are tight enough to use a single IRAC–near-IR colour (i.e. ) to determine the fluxes in the other IRAC bands. These correlations arise from the differing contribution of stellar light and dust to the IRAC bands, enabling us to determine pure “stellar” colours for these bands, but still demonstrating the need for dust (or stellar) corrections in these bands when being used as stellar (dust) tracers.
keywords:
galaxies:general, photometry, stellar content, ISM; infrared: galaxies; galaxies: individual: NGC 3521, NGC 4254, NGC 4321, NGC 4450, NGC 4536, NGC 4552, NGC 4579.1 Introduction
One of the remarkable aspects of astronomy is the strong correlations that exist between the broad observable properties of galaxies. The morphological sequence of galaxies first noted by Hubble (1926) correlates well with surface brightnesses, sizes, and optical colours. These in turn correlate with and arise from the intrinsic physical properties of these galaxies, such as the total stellar masses (), star formation rates (SFR), and mean stellar ages and metallicities (for reviews on these correlations see Roberts & Haynes 1994 and Kennicutt 1998).
The rest-frame optical colours of galaxies broadly correlate with each other (i.e. , with ), as well as with surface brightness. While forming continuous sequence in colours, galaxies can be broadly classified into ‘blue’ and ‘red’ galaxies, especially when compared with luminosity or absolute magnitude, with a strong correlation with late- and early-type respectively (Blanton et al., 2003). The variation in optical colours arise from differences in the star formation histories of galaxies, with UV to blue light dominated by short-lived massive stars, while the red to near infrared light is more sensitive to the total amount of stars. This is complicated however by the presence of interstellar dust, which attenuates and reddens the stellar light (see e.g. Kennicutt, 1998; Bruzual & Charlot, 2003). Thus the colours of a galaxy broadly measure the ratio of young to old stars, which is generally parameterized by the ratio of current to past star formation (SFR/SFR), or the ratio of the current star formation rate to the total stellar mass, the specific star formation rate (sSFR=SFR/). In the local universe, these intrinsic physical parameters, and thus a galaxy’s colours, are related to the total stellar mass of a galaxy (e.g. Brinchmann et al., 2004), with more massive galaxies having lower sSFRs and thus redder colours. The stellar mass, and thus the sSFR and colours, are related to the size, concentration, surface brightness, and mean metallicity of a galaxy (e.g. Kauffmann et al., 2003; Tremonti et al., 2004; Gallazzi et al., 2005).
In a similar manner, the IR colours of galaxies are also strongly associated with the intrinsic properties of the galaxies, with the IR fluxes increasing relative to the near-IR fluxes (i.e. becoming redder) from early- to late-type galaxies (see e.g. Kennicutt, 1998, especially fig. 4), and with increasing sSFR (da Cunha et al., 2008). As with the optical colours, the infrared is sensitive to the younger stellar populations, as the IR emitting dust is heated predominantly by UV–blue light. In fact, the fluxes in both of these wavelength regions can be used as measures of a galaxy’s SFR (Kennicutt, 1998) and a clear correlation between the global optical and IR colours is observed, in the sense that optically blue galaxies are also found to have enhanced IR emission (e.g. Hogg et al., 2005).
However on a physical basis, the processes that lead to the fluxes in these two wavelength regimes are contrary: the radiation from young stars that dominate the UV-blue optical colours is also that preferentially absorbed by dust which then re-emits in the IR (see e.g. Draine, 2003). This contrary nature is exacerbated by the association of the youngest stars with the clouds of gas and dust from which they form, leading to relatively higher attenuation observed in star forming regions (see e.g. Calzetti, 1997; Charlot & Fall, 2000). This contradiction of the observed galaxy scale correlation of both blue colours and IR excess and the physical contrary nature of dust absorption and UV-blue light emission indicate that on some spatial scale within galaxies this correlation must break down.
In some respects this difference is expected as the blue light and infrared emission arise from physically distinct components (i.e. stars and dust), and this correlation will break down once these different components are resolved out, as seen within our own Galaxy. However, this distinction between IR and blue light exists on larger scales within galaxies, as we show here by examining seven nearby galaxies that span a range of galaxy types from early to late. By examining all galaxies on the same spatial scales we demonstrate that the variation of the IR light and the blue light occurs in spatially distinct regions, and show the scales over which these regions occur. Importantly, these distinct components appear to be associated with different physical quantities that are correlated on galaxy scales: the specific star formation rate (sSFR) and the stellar mass density.
In Section 2, we introduce the sample of galaxies, the multiwavelength dataset and the relative reduction. In section 3, we analyse the resolved SEDs of the individual galaxies, showing the correlations that exist to different degrees between the IR and optical colours, analyzing them by means of principal component analysis, and showing how they depend upon other local observables, namely the NIR and H surface brightness. In Section 4 we show how these local colour correlations (and lack thereof) result in stronger global correlations. Section 5 is devoted to an in-depth investigation of the SEDs between 1.65 and 8m, which we describe as a universal 1-parameter family: fitting formulae to obtain the luminosity at intermediate wavelengths given -band and 8m and estimates of purely stellar SEDs are provided. Section 6 concludes the paper with a summary of the principal results.
2 Sample and imaging data
The present sample of 7 galaxies is drawn from the original sample of nine galaxies analyzed in Zibetti et al. (2009, ZCR09 hereafter). We require galaxies to be part of the Spitzer Infrared Nearby Galaxies Survey (SINGS, Kennicutt et al., 2003), a comprehensive imaging and spectroscopic study of 75 nearby galaxies (D Mpc) conducted in the IR with the Spitzer Space Telescope, and have SDSS imaging (York et al., 2000) as well as deep NIR imaging in H band (1.65m) either from GOLDMine (Gavazzi et al., 2003) or UKIDSS (Lawrence et al., 2007). In addition we require the galaxies to be at most Mpc away (corresponding to the assumed distance to the Virgo cluster, Gavazzi et al. 1999), in order to resolve scales of approximately 200 pc at all wavelengths, from SDSS -band to IRAC 8m. This leaves us with a small, yet representative, sample of regular galaxies in the local Universe. The 7 galaxies are listed in Table 1 along with their coordinates (according to NED/RC3), assumed distances, corresponding angular scale, source and depth of the NIR imaging (see below).
| Name | RA | Dec | Distance | Angular scale | NIR source | Limiting SB |
|---|---|---|---|---|---|---|
| (J2000.0) | (J2000.0) | Mpc | pc arcsec-1 | MJy Sr-1 | ||
| (1) | (2) | (3) | (4) | (5) | (6) | (7) |
| NGC 3521 | 11h05m48.6s | 00d02m09s | 9.2 | 45 | UKIDSS | 0.30 |
| NGC 4254 | 12h18m49.6s | +14d24m59s | 17.1 | 82 | GOLDMine | 0.21 |
| NGC 4321 | 12h22m54.9s | +15d49m21s | 17.1 | 82 | GOLDMine | 0.32 |
| NGC 4450 | 12h28m29.6s | +17d05m06s | 17.1 | 82 | GOLDMine | 0.35 |
| NGC 4536 | 12h34m27.0s | +02d11m17s | 17.1 | 82 | GOLDMine | 0.39 |
| NGC 4552 | 12h35m39.8s | +12d33m23s | 17.1 | 82 | UKIDSS | 0.47 |
| NGC 4579 | 12h37m43.5s | +11d49m05s | 17.1 | 82 | GOLDMine | 0.53 |
With these seven galaxies we cover the full morphological range of regular “giant” () galaxies, from elliptical to Sc spiral, also corresponding to a range of specific star formation rates from to yr-1. In Table 2 we present these and other essential morphological and physical properties of the galaxies in the sample. The inferred metallicities also span the full range for galaxies of such stellar mass. Only two spirals have an apparent inclination in excess of 45 degrees, thus allowing us to study not only a “clean” sample of low inclination discs, for which the radiative transfer in the dusty ISM is expected to be relatively simple, but also to explore possible complications due to a larger inclination. We note that nuclear activity from AGN does not influence our analysis significantly, as we include only weak or obscured AGNs (no type 1) which affect only a very limited number of central pixels. The statistical effect of these AGN affected pixels over the several thousands of pixels in each galaxy is negligible.
| Denomination | Morph. type | Inclination | SFR | sSFR | Z(gas) | Nuclear classification | |
|---|---|---|---|---|---|---|---|
| degrees | log M⊙ | log M⊙ yr-1 | log yr-1 | 12 + log (O/H) | |||
| (1) | (2) | (3) | (4) | (5) | (6) | (7) | (8) |
| NGC 3521 | SAB(rs)bc | 64 | LINER | ||||
| NGC 4254 | SA(s)c | 30 | LINER | ||||
| NGC 4321 | SAB(s)bc | 32 | LINER | ||||
| NGC 4450 | SA(s)ab | 43 | LINER | ||||
| NGC 4536 | SAB(rs)bc | 67 | None111Moustakas et al. (2010) find line ratios consistent with very low-level AGN activity. | ||||
| NGC 4552 | E0-1 | LINER | |||||
| NGC 4579 | SAB(rs)b | 38 | LINER |
Notes. Columns: (1) NGC name. (2) Morphological type according to NED/RC3 (de Vaucouleurs et al., 1991), following the classification scheme of de Vaucouleurs (1959): S indicates spiral, E elliptical followed by a number indicating the ellipticity (0 means perfectly round); A is normal unbarred spiral, B barred, AB weakly barred; (s) is s-shaped, (r) indicates the presence of a ring, (rs) both ringed and s-shaped; a, b, c, d are the same as in the classical Hubble spiral classification. (3) Inclination (for spirals only), according to de Vaucouleurs et al. (1991); Jarrett et al. (2003). (4) Stellar mass from Skibba et al. (ApJ in press) assuming a Kroupa (2001) IMF, except NGC 4450 and NGC 4552. Stellar masses for these two galaxies have been computed multiplying the total -band luminosity given by 2MASS-LGA (Jarrett et al., 2003) times the computed according to ZCR09 using the , colours measured from our images and corrected to a Kroupa (2001) IMF. (5) Star formation rate from Skibba et al. (ApJ in press), based on Hm luminosity, except for NGC 4450 which is from Calzetti et al. (2010). (6) Specific star formation rate, sSFRSFR. (7) Gas phase metallicity, from the characteristic oxygen abundance from Moustakas et al. (2010) based on the Kobulnicky & Kewley (2004) calibration, except for NGC 4450, NGC 4552, and NGC 4579, which are use the luminosity-metallicity relation. (8) Nuclear activity, from NED.
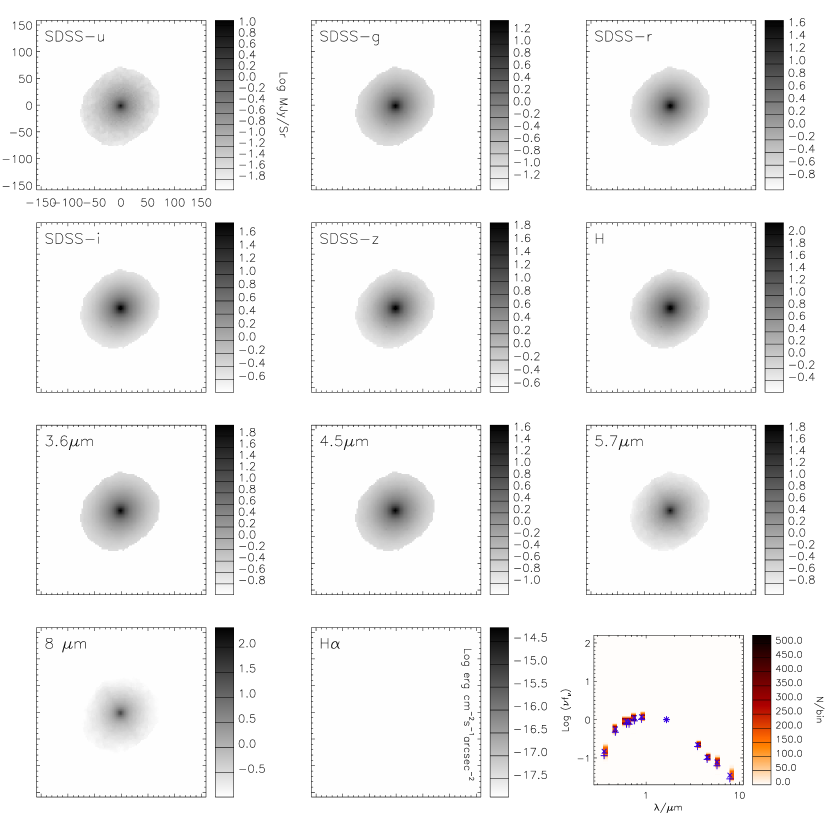
The SDSS and -band images are processed, mosaiced (when required) and calibrated as explained in ZCR09. Spitzer IRAC images are publicly available from SINGS, already calibrated in MJy/Sr and sky-subtracted. For part of our analysis we also use narrow-band H imaging, provided as an ancillary dataset of SINGS: details about the flux calibration of the “net” (i.e. continuum-subtracted) images is given in the technical documentation that accompanies the data release. No H image is provided for the elliptical galaxy NGC 4552, which allegedly does not have any detectable HII regions.
For all images the properties of the background, which is the dominant contributor to the noise budget at all wavelengths, are carefully computed. The mean background is subtracted by fitting a linear polynomial to the regions surrounding the galaxies, which are selected not to display any strong contamination from bright sources nor to be affected by obvious artifacts. Noise properties in terms of pixel-based r.m.s. and fluctuations on scales of the order of a fraction of the galaxy’s effective radius are also determined in these regions and are then used to determine the adaptive smoothing strategy and the surface brightness cuts to be applied in the following analysis.
We manually remove all obvious contaminating sources (foreground stars, background galaxies) by replacing those pixels with the surrounding average background plus noise, using the task imedit in IRAF. For more extended or unamendable artifacts (e.g. the extended blooming due to the bright nucleus of NGC 4536 in IRAC bands) we simply mask out those pixels (and the corresponding ones in all bands) and discard them from the following analysis.
Pixel-by-pixel SED analysis requires two more steps: the placement of all images on a common plate scale, and to ensure that in each pixel at all wavelengths a sufficiently high signal-to-noise ratio (S/N) is provided. The imaging data involved in this analysis have point spread functions (PSF, for optical or -band) or point response functions (for Spitzer IRAC bands) FWHM ranging from approximately 1 arcsec (some SDSS images in good seeing conditions) to 2 arcsec (IRAC 8m), while pixel scales range from 0.4 (SDSS, UKIDSS) to 1.6 (some GOLDMine -band images) arcsec per pixel. By re-sampling the images with a common pixel scale of arcsec pix-1 we ensure that most of the flux of a point-like source is contained in one pixel. We can therefore avoid convolving all images to a common PSF, which would be hardly feasible for a number of H-band images where the PSF is severely under-sampled and not enough stars are available to compute it properly. We choose therefore to resample the images of the 6 galaxies belonging to the Virgo cluster to a pixel scale of 2.5 arcsec, corresponding to 207 pc pix-1 for the assumed distance to Virgo of 17.1 Mpc (Gavazzi et al., 1999). For the remaining galaxy, NGC 3521, we resample to a pixel scale of 4.65 arcsec pix-1, corresponding to the same physical resolution of 207 pc pix-1 as for the other galaxies.
In order to extend our analysis with a sufficiently high signal-to-noise ratio (S/N) out to a large fraction of the optical radius, as in ZCR09, we perform an adaptive median smoothing of the images using the code ADAPTSMOOTH (Zibetti, 2009), which also allows the matching of the variable smoothing kernel among all bands. A minimum S/N=20 per pixel is required in all bands, except -SDSS, for which a minimum S/N of 10 is deemed as sufficient. In fact, this band is imaged with a significantly lower sensitivity in the SDSS, such that a more massive smoothing would be required and a smaller radial extent could be covered if the same S/N=20 had to be required. On the other hand the large leverage of this band on the SED makes it possible to study pixel-to-pixel variations even with an accuracy of 10% only, as we show in the following analysis. We note that the H images do not contribute to determine the size of the smoothing kernel required at each pixel (as this would imply missing a significant fraction of pixels where no substantial H emission is observed), but they are nevertheless smoothed according to the common kernel as for all other bands. Background-dominated noise is assumed for all images, with a uniform r.m.s. equal to the one measured in the background regions. A maximum smoothing radius of 4 pixels (2 for NGC 3521) corresponding to pc is allowed. All pixels for which the surface brightness (SB) cannot be computed with the minimum required S/N even after smoothing over the maximum radius are flagged and discarded from the rest of the analysis. Furthermore, we also discard pixels whose SB is less than 10 times the typical large scale background fluctuations, in order to avoid spurious effects at the low SB end of the pixel distribution. The limiting SB that is reached as a result of these cuts is given in column 8 of Table 1.
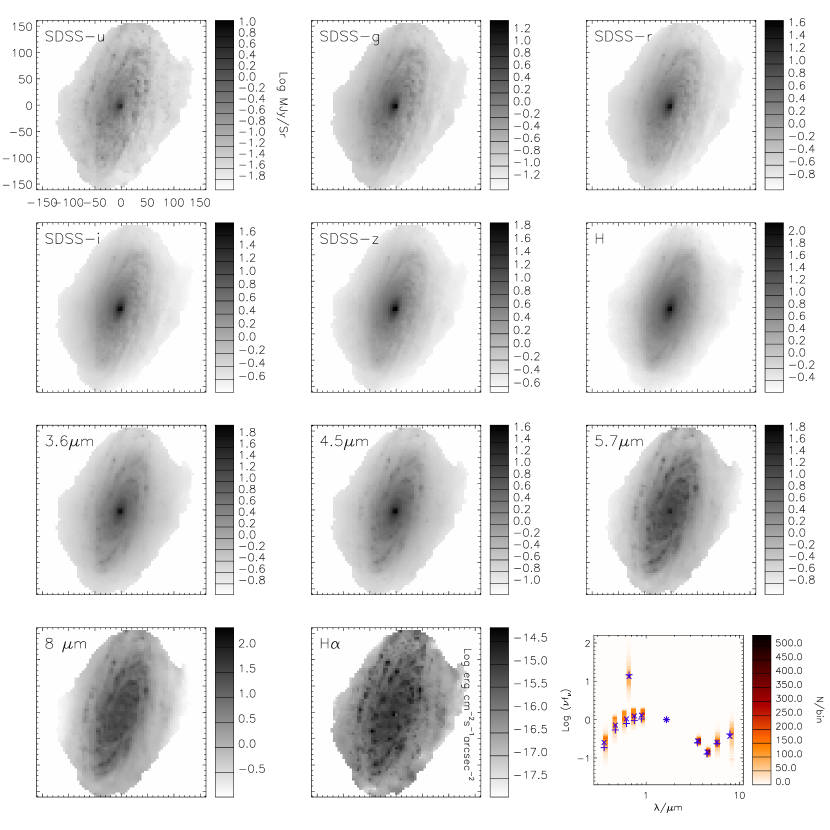
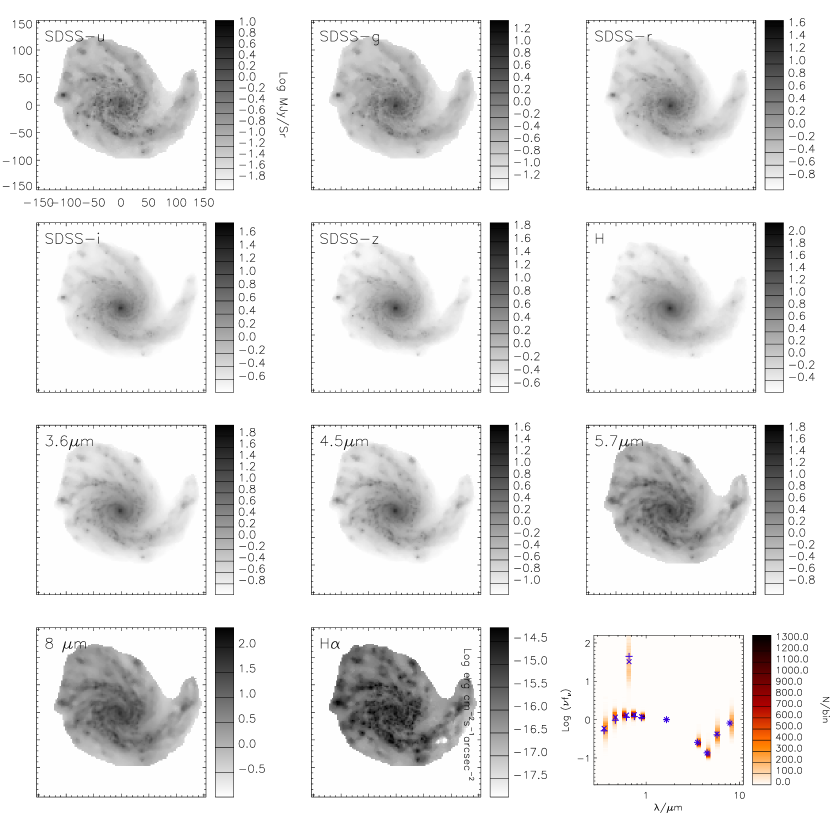
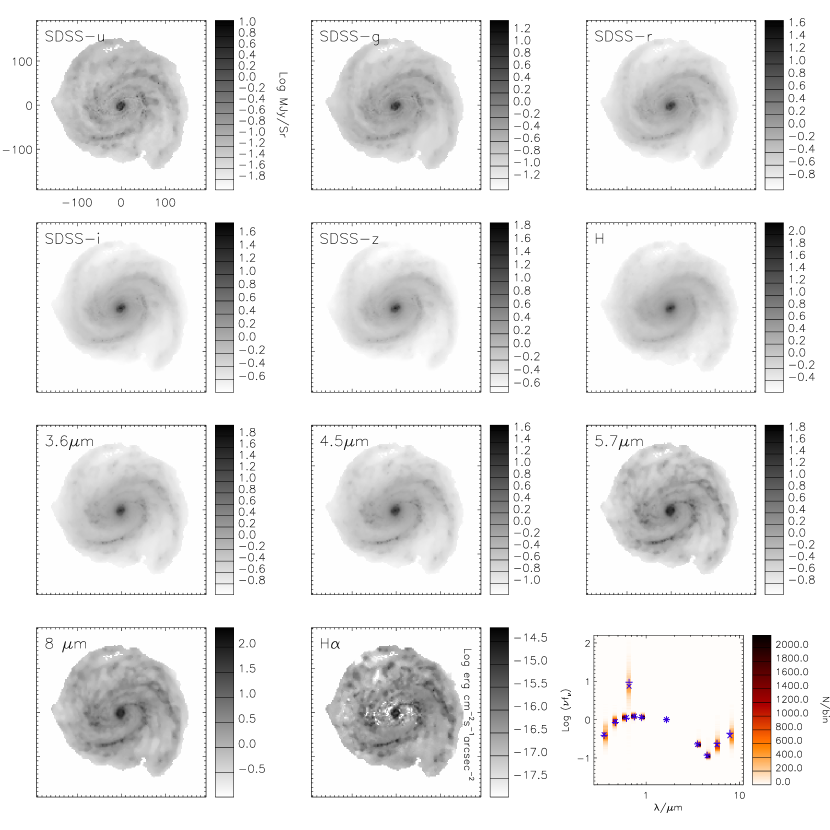
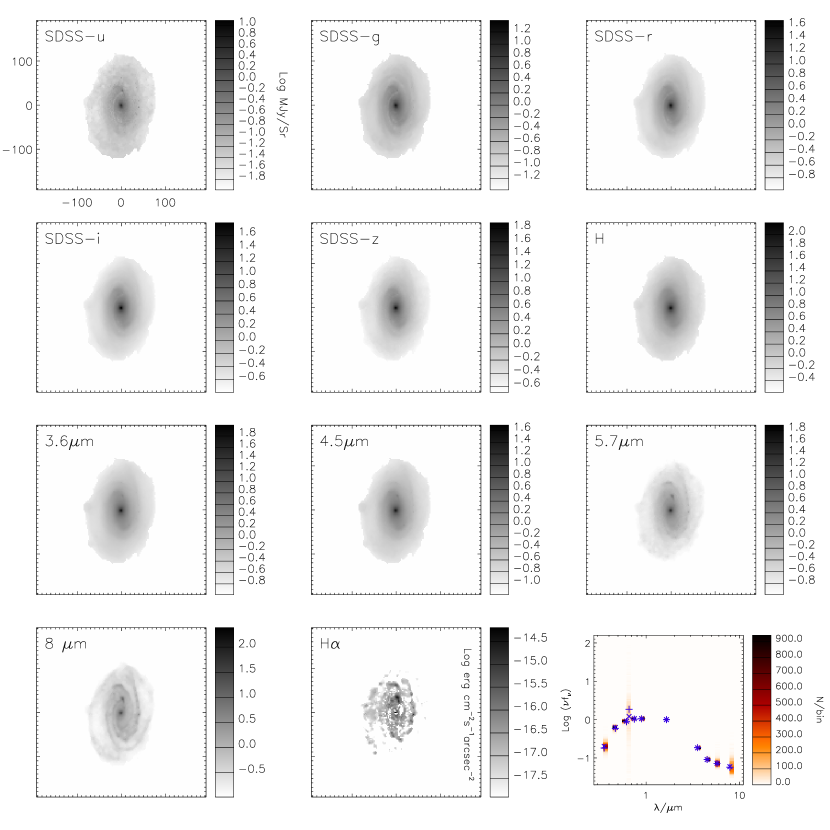
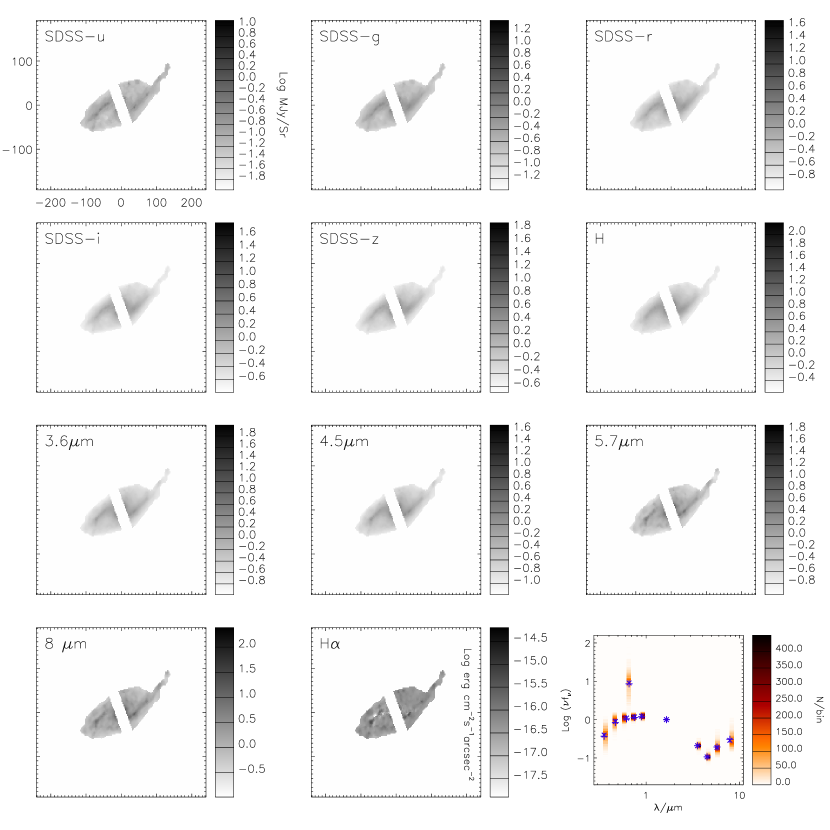
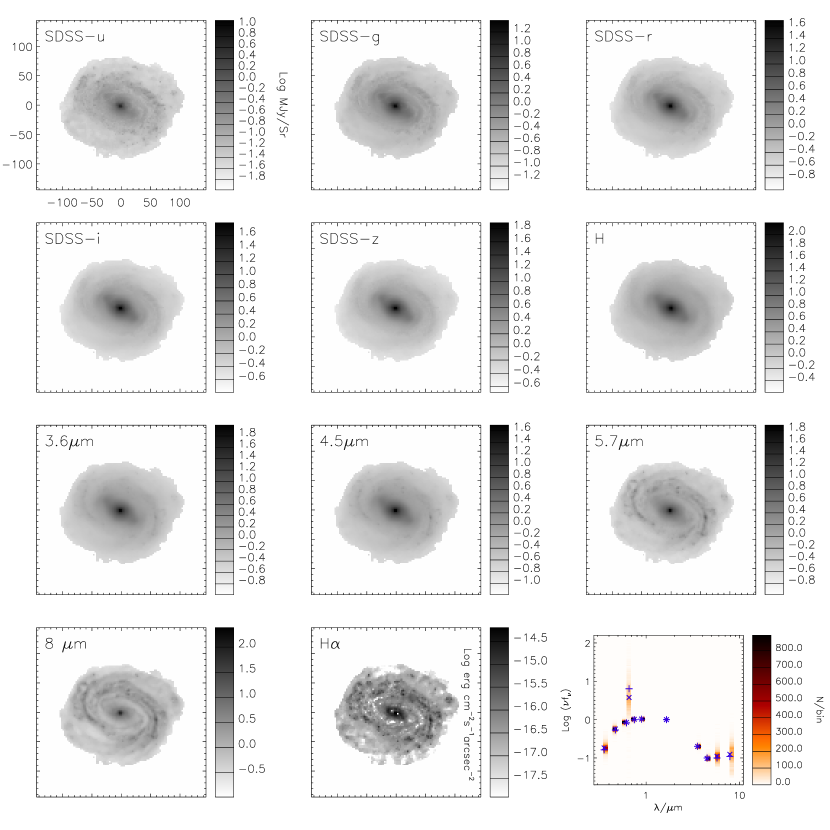
Images of the galaxies in the ten broad bands and in H after editing, adaptive smoothing and SB cuts are shown in Fig. 10 to 16 in Appendix A, coded in grey intensity according to SB in units of MJy Sr-1. In the rest of the paper we discuss the analysis and the results for the full sample, but we show specific figures and plots only for two galaxies which are representative of late star-forming spirals (NGC 4254) and early type galaxies (NGC 4450), with the remaining five being presented in online appendices.
3 Spatially resolved SEDs: internal trends within galaxies
3.1 Pixel-by-pixel SEDs and colour-colour relations
The processing described in the previous Section provides us with an optical to mid-IR SED for each valid pixel, described by an array of values for the SB in MJy Sr-1 in ten broad bands (, , , , , , 3.6, 4.5, 5.7 and 8m) plus the surface brightness in erg cm-2 sec-1 arcsec-2 for the H line emission. At each pixel we normalize in each band to band in order to be able to compare on the same scale the SED of pixels spanning about two orders of magnitude in SB and hence to study the spatial variations of the SED shape across the galaxies.
The choice of band is dictated by three main reasons which make it the natural point of normalization: i) 1.65m divides the SED into one part of pure stellar emission (possibly dust extincted), shortward of it, and one part affected by dust emission, longward of it. ii) the band is the one that minimizes the effects of dust both in emission (see e.g. Fig. 5 of da Cunha et al., 2008) and in absorption, as the extinction is always smaller at longer wavelengths. The band is equally unaffected by dust emission, but is more sensitive to extinction; on the other hand, 3.6m, although even less affected by extinction than the band, is severely affected by dust emission, as we show below. iii) -band luminosity is probably the best proxy to stellar mass, as shown e.g. in ZCR09, showing the minimum dependence of on age, metallicity and dust; therefore normalizing to -band is close to normalizing to the stellar mass density at each pixel, a much more fundamental parameter than any surface brightness.
The distribution of pixels in SED for each galaxy is given for reference in the bottom right panels of Figs. 10 to 16, respectively, in the online Appendix A. The number of pixels per bin of normalized in each band is represented by the colour coding. Galaxy SED distributions display different amount of scatter, which vary upon morphology and wavelength considered. As we show in more detail in the following analysis, most of the scatter is contributed by the mid-IR and the bands. It is interesting to note that the integrated SED of a galaxy (flux-weighted average of pixels, ‘+’ signs in the figures) does not perfectly correspond to the (number-weighted) mean pixel SED (‘’) or the most frequent SED (peaks of the distributions). A similar effect was already noted by ZCR09, where it turned out to cause a significant bias in stellar mass estimates, and can be simply explained by the fact that regions of different brightness are often characterized by systematically different SEDs222A typical example occurs in spiral galaxies with a bright central bulge: the pixels dominated by the red bulge light are fewer but brighter than the more numerous but dimmer pixels in the disc where the SED is bluer. As a result, the flux-weighted SED will be redder than the number-weighted one..
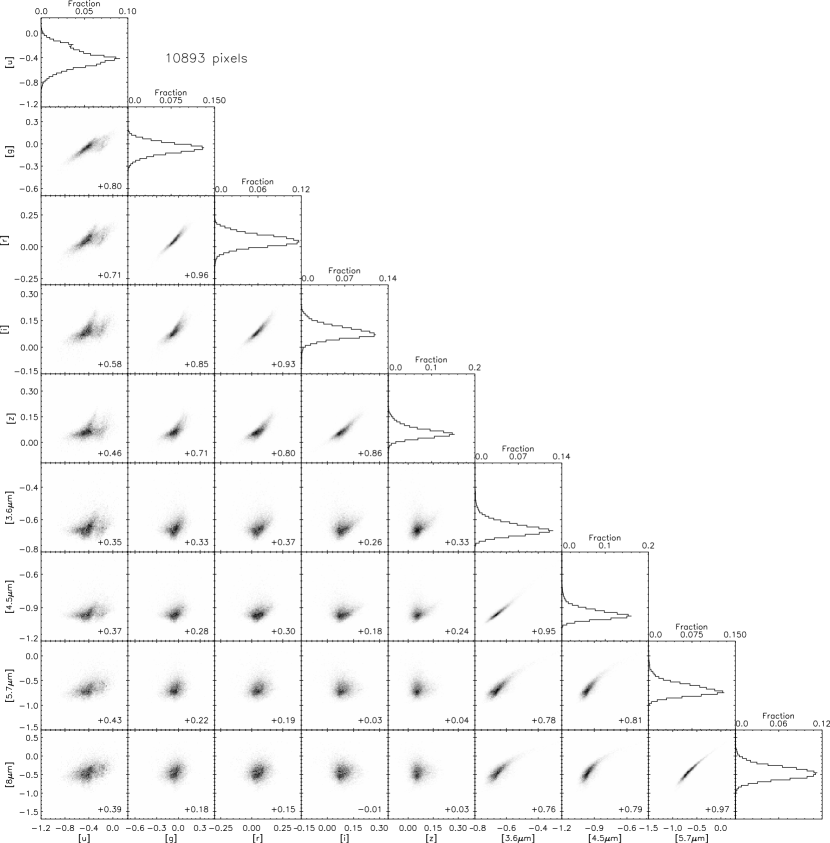
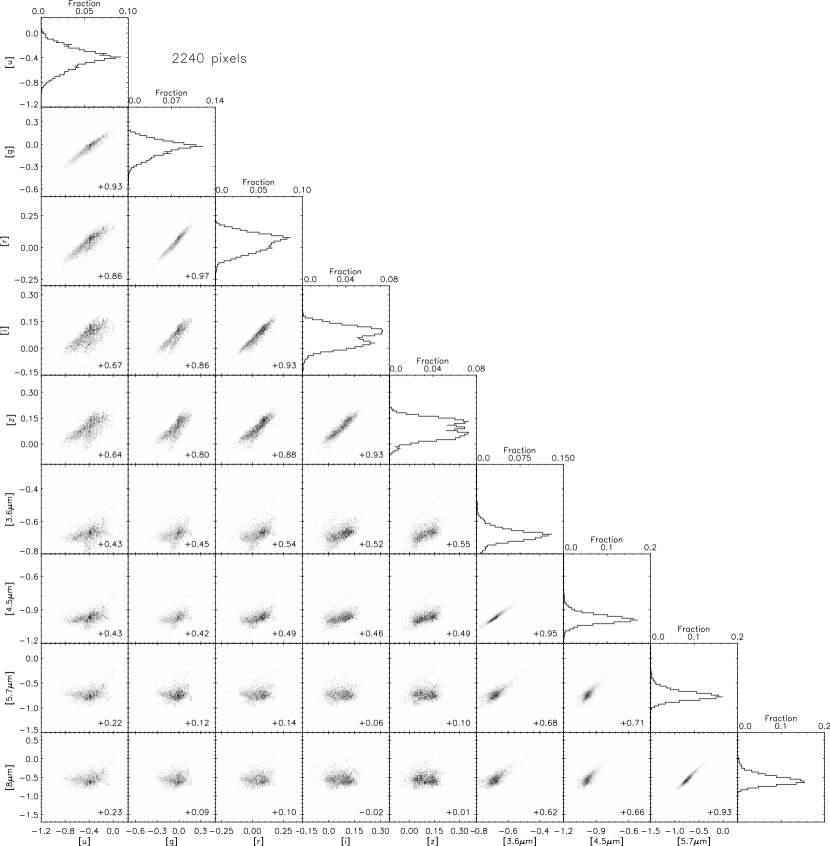
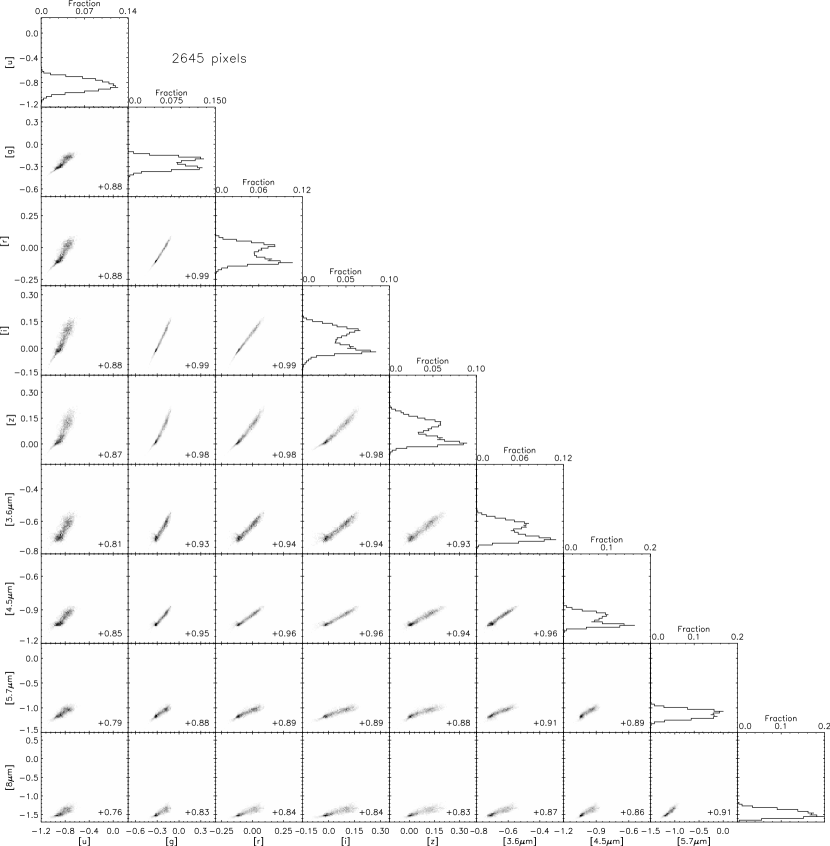
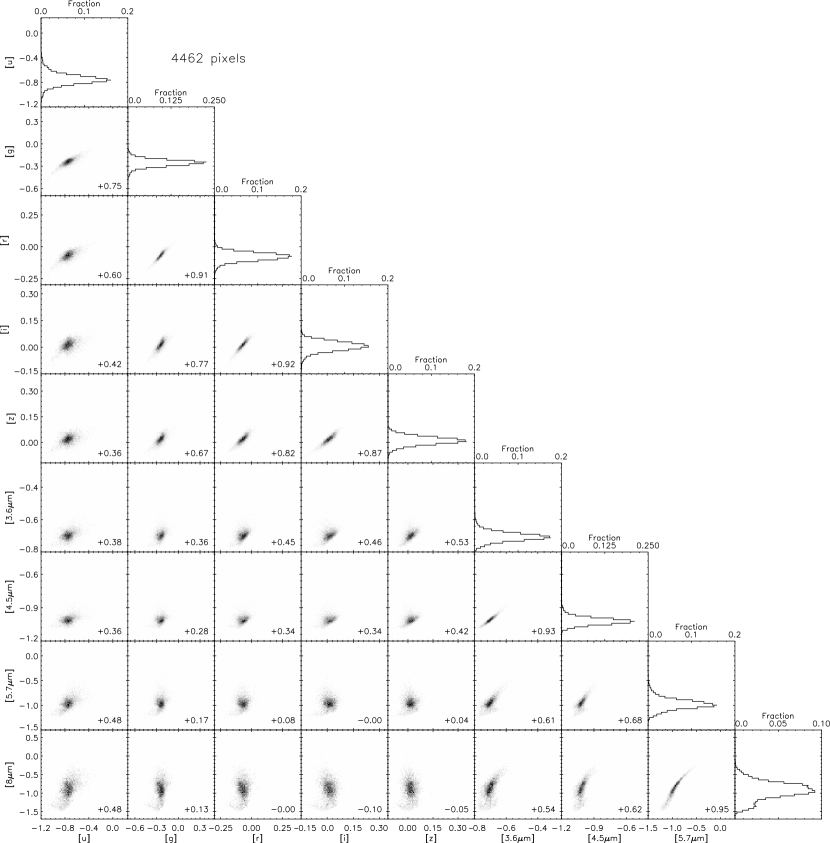
As a first step, we study the correlations between the normalized fluxes in all possible pairs of bands for all pixels within each galaxy. This is shown in Fig. 1 and 2 for NGC 4254 and NGC 4450, respectively, with the remaining galaxies shown in the online figures 17 to 20. In each panel of the figures we plot the distribution of pixels in the vs. space (where and are any two broad bands among , , , , , 3.6, 4.5, 5.7 and 8m), which is effectively a colour-colour space vs. , modulo a linear transformation. The panels on the diagonal display the distribution of the fraction of pixels as a function of , which allows to directly derive a more quantitative information about the relative contributions of pixels at different colour. In all following discussion we refer to as “ colour” for brevity.

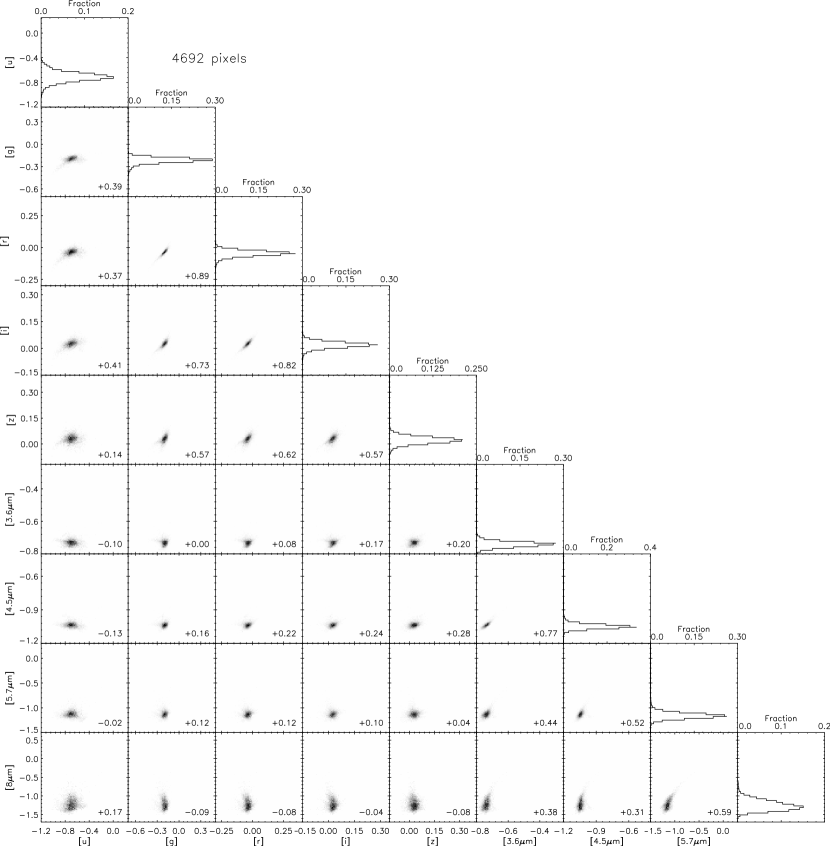
By comparing Fig. 1 and 2 it is immediately clear that the late-type, star-forming galaxy NGC 4254 spans a much broader range of colours than the early type NGC 4450, which is overall very uniform. Apart from this, both galaxies display common features in the colour-colour distributions, such that one can divide up these figures into three distinct regions, corresponding to different spectral correlations. In the upper left panels we observe very significant correlations between optical colours, from to . Similarly, the bottom right panels display significant correlations between IRAC colours, from 3.6 to 8m. The third region includes the bottom left corner and shows IRAC colours vs. optical colours: correlations in this region are very weak if present at all. In star forming galaxies an exception to this is the colour, which appears to (weakly) correlate with IRAC colours as well. This visual impression is quantitatively confirmed by the Spearman rank correlation coefficients, which we computed for each colour-colour distribution and are listed in the lower-right corner of each corresponding panel.
From this analysis we can conclude that, on the local scales probed by our actual pixellation (from 200 pc up to kpc when the effects of the smoothing are maximal), the shapes of the SED in a given galaxy in the optical range can be described, to first order, as a 1-parameter family and the same holds true for the IR range. The two parts of the SED shortwards and bluewards of 1.65m appear to be largely uncorrelated. The optical SED is mainly driven by light-weighted mean stellar age (and secondarily by dust extinction and metallicity, see e.g. Fig. A1 in ZCR09 and MacArthur et al. 2004) while the mid-IR SED probed by IRAC is determined by PAH features and hot dust, which trace on-going star formation (e.g. Calzetti et al., 2007). This tells us that on local scales light-weighted mean stellar ages and actual on-going star formation are largely uncorrelated, most likely because stellar aging and star formation are subject to very different time scales, namely and years, respectively (e.g. Bruzual A. & Charlot, 1993; Kennicutt, 1998).
It is also very notable that in star-forming galaxies the colours of the two shortest-wavelength IRAC bands at 3.6 and 4.5m correlate extremely well with those of the longer-wavelength bands, which are dominated by PAH features, but are very weakly correlated with the and bands which are very good tracers of the stellar mass (e.g. ZCR09). This is in agreement with the finding of Mentuch et al. (2010), who show, using pixel-by-pixel analysis, that the colour excess at 3.6 and 4.5m with respect to pure stellar emission extrapolated from -band (1.25m) is related to star formation. Therefore caution should be used when adopting images at 3.6m alone to trace the stellar mass distribution in galaxies with no correction for the ‘dust’ contribution.
3.2 Principal Component Analysis of resolved SEDs
In this section we use principal component analysis (PCA) of the SEDs of all pixels, galaxy by galaxy, to show i) that the variation of the optical part and of the IR part of the SED are uncorrelated and ii) that these independent variations are spatially related to the structure of a galaxy.
We refer the reader to Jolliffe (2002) for a thorough description of principal component analysis. For the present purpose it is sufficient to say that the goal of PCA is to “reduce the dimensionality of a data set consisting of a large number of interrelated variables, while retaining as much as possible of the variation present in the data set. This is achieved by transforming to a new set of variables, the principal components (PCs), which are uncorrelated, and which are ordered so that the first few retain most of the variation present in all of the original variables” (Jolliffe, 2002). In our specific application, for each pixel of the pixels in a galaxy we consider the 9-dimensional SED vector given by the -band normalized , i.e. . The set of these SED vectors is then decomposed into principal components using the pcomp function in IDL. Each SEDi can be then represented as , where is the arithmetic mean of taken over all pixels, are the principal component vectors, which are obtained as eigenvectors of the correlation matrix of the dataset, and are the corresponding coefficients for th pixel and th component.
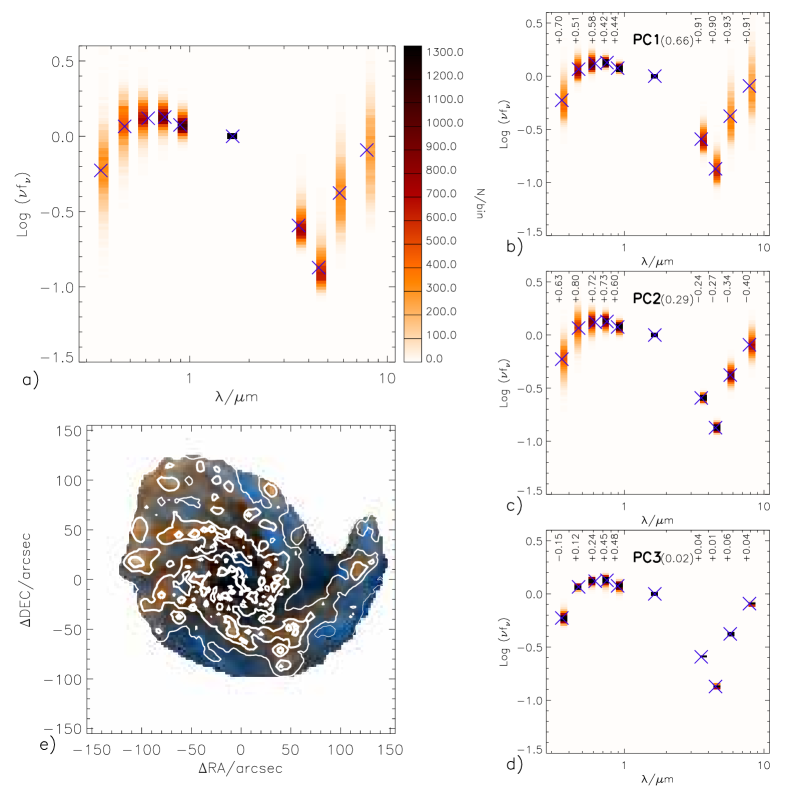
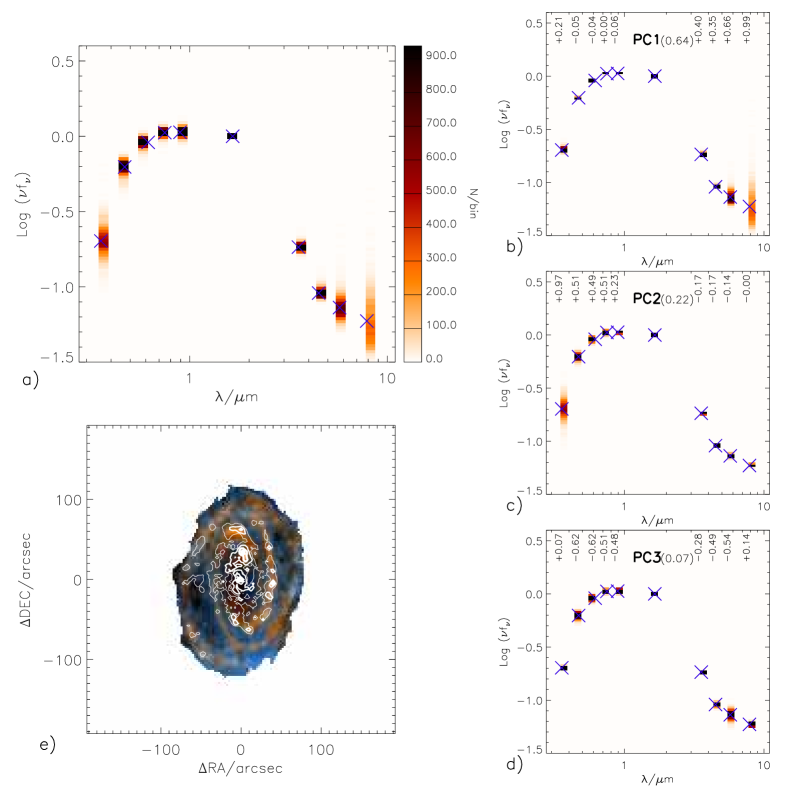
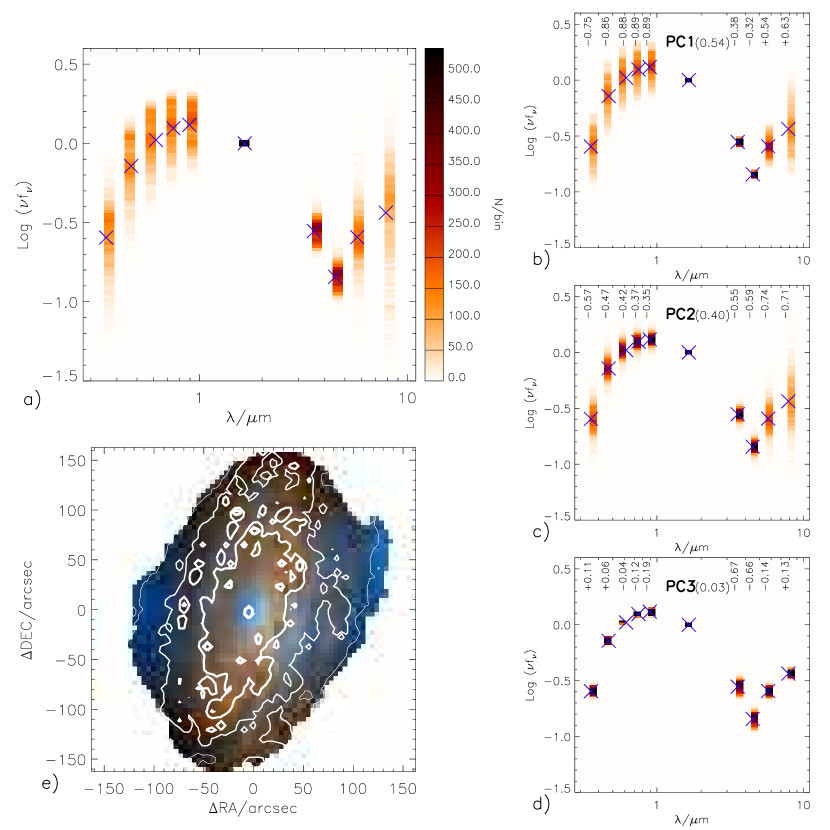
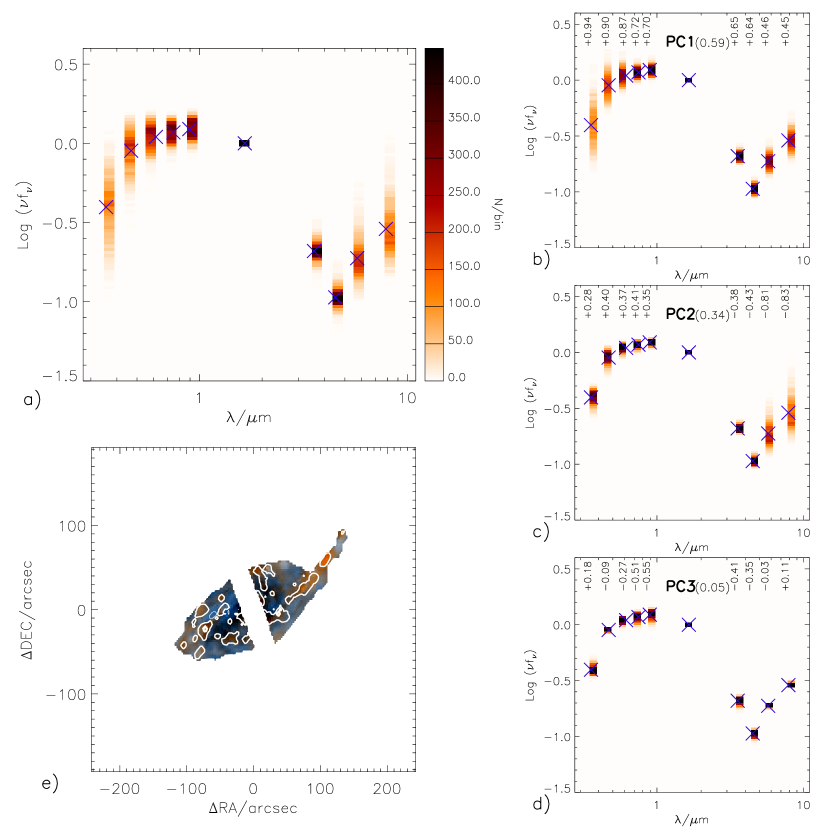
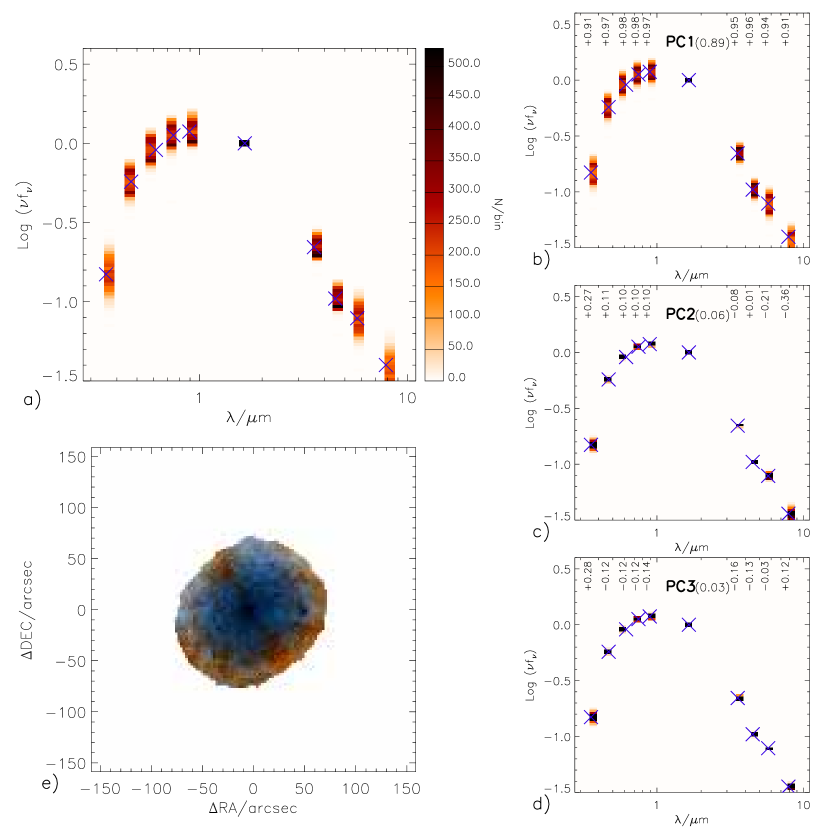
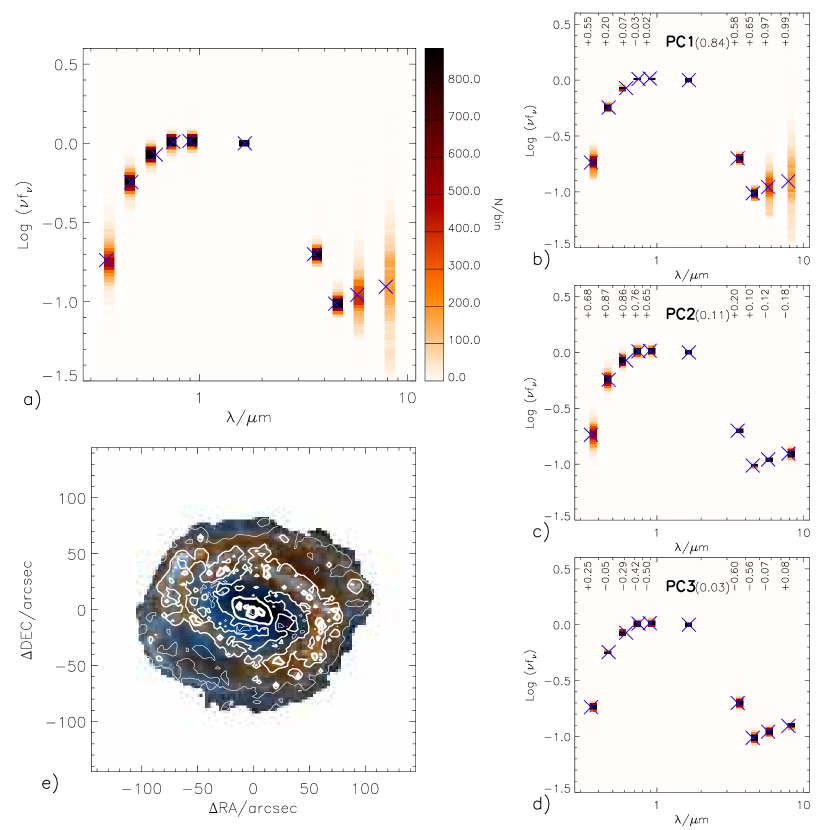
In Fig. 3 and 4 we illustrate the results of the PCA on our reference galaxies (corresponding figures for the complete sample are available in the online only appendix, figures 22 to 26). Figure a) (top left) shows the pixel distribution of SEDs, with the arithmetic mean marked with blue crosses for reference. Figures b), c) and d) (to the right) display the pixel distribution in the SED space when only PC1, PC2 and PC3, respectively, are used in addition to the mean, such that , for respectively. As apparent from these plots, the majority of the scatter is accounted for by the first two PCs. This holds true for the two examples shown here and in general for the full sample. The variance in each PC is given by the number in parenthesis next to the PC label in each plot. We find that typically 90% of the variance is contained in the first 2 PCs (with PC1 typically contributing at least roughly twice as much as PC2) and only 2 to 7% in PC3. The remaining variance is contributed in decreasing order by the other PCs, and is basically at the level of noise. While in general PCs are not expected to have any obvious physical interpretation (this is certainly the case for PC, ), these plots show that PC1 and PC2 mainly affect the IR and the optical part of the SED very differently, but in a very consistent way for different morphological types and levels of star formation activity. In particular, PC1 accounts for most of the variations in the IR part of the SED and, in some cases, for part of the variations in the optical, whereas PC2 mainly reflects variations in the optical regime. This is seen more quantitatively with the Spearman rank correlation coefficients between colors and PC coefficients reported for each band at the top of figures b), c) and d), with these numbers indicating the relative contribution and direction to each band. This relation of PC1 and PC2 holds true for five of the seven galaxies in our sample333For NGC 4536 the role of the first two PCs is switched: PC1 correlates best with optical colours, whereas PC2 anti-correlates with IR colours. However, modulo index exchange and sign of the correlation, the same observations and conclusions as for the other four “regular” galaxies apply to NGC 4536 as well., with the only exceptions being the inclined spiral NGC 3521 and the elliptical galaxy NGC 4552, which we discuss below in Sec. 3.2.1. The third principal component, though apparently dominated by variance in the optical bands for most galaxies, is only a low level contribution and is different enough between galaxies that it is of very uncertain physical interpretation and thus will not be discussed further in this work.
The PCA demonstrates that the optical and IR parts of the SED are to large extent independent and their linear combination can reproduce pixels SED to high accuracy. As already noted in the previous section, this shows that on local scales (0.2 to kpc) the PAH emission that drives IR colours is not related to the combination of mean light-weighted age of stars and extinction, which is traced by the optical colours. Apparently any combination of PAH emission and optical colours is allowed within a galaxy.
The decomposition into PCs provides a very compact representation of the SEDs, which is essentially given by the two coefficients describing the intensity of the two main PCs. In Fig. 3e) and 4e) we show how the intensities of PC1 and PC2 affect different regions of the galaxies. The intensity of the red tint represents the intensity of PC1, while the blue one is for PC2. Regions dominated by either PCs in fact extend over a broad range of scales and trace a structure in which spiral arms, bright star-forming knots therein, interarm regions, bulge can be identified.
PC1 (mainly IR-related) is typically strong (positive, enhanced IR emission) where bright star forming regions are found and is faint (negative, diminished IR emission) in the bulge and in the galaxy outskirts without ongoing star formation. The very close link between star formation and PC1 is analyzed in more detail in the following Sec. 3.3 and is expected from the observed relations between PAH, mainly responsible for enhanced emission in the IRAC bands, and SFR (see, e.g., Calzetti et al., 2007). By overlaying H isophotal contours on the maps of Fig. 3e) and 4e) we show that PC1-bright regions are actually coincident with H-bright regions and therefore PC1 can be broadly interpreted as an indicator of SFR density. On the other hand, PC2 (mainly optical-related) is strong (i.e. positive, enhanced optical luminosity with respect to NIR) where young, unattenuated stellar associations are found along the spiral arms, but also in the disk outskirts, as an effect of gradients in age (and possibly also in metallicity), but is weak (i.e. negative, suppressed optical emission with respect to NIR) in the bulge, in the interarm space and in heavily attenuated regions in the arms444Note that the interarm regions have a slightly negative PC2 and a largely negative PC1, hence the resulting dark blue tint.. This complex interplay between regions of different physical conditions results in the observed lack of correlation between the optical and the IR part of the SED. As can be inferred from figures 3e) and 4e), this result appears to be robust against the choice of resolution scale, as long as a sufficient number of elements (pixels) can be analyzed and the limit at which the internal structure of the star forming regions start to be resolved is not reached (in fact, these scales are never reached in the galaxies explored here as they are almost a factor of 10 below our resolution).
It is notable that in the galaxies of later type (hence having higher specific SFR) PC1 and PC2 appear to contribute very similar amount of variance in the colour, which has, in fact, a very similar degree of correlation with the two main PCs. This can be easily accommodated in the interpretation given in the previous paragraph by considering that the flux in band is contributed both by star forming regions, hence correlated with PC1, and by the regular diffuse stellar population in relation to its age and relative attenuation, hence correlated with PC2.
3.2.1 PCA of the “anomalous” galaxies NGC 4552 and NGC 3521
Contrary to all other galaxies, the PCA of the elliptical NGC 4552 results in PC1 being responsible for most (89%) of the total SED variance. All pixels in NGC 4552 have SEDs very close to a pure stellar continuum, with no evidence for dust/PAH emission and the IR part being consistent with a Rayleigh-Jeans tail. PC1 affects the SED in the sense of changing the “curvature”, i.e. of enhancing or decreasing at the same time all bands relative to . PC1 has a clear gradient, such that the central regions have redder optical- colours and bluer -IR colours, while the outskirts display the opposite. This kind of colour gradients are well known in the optical and NIR (see, e.g., Michard, 2000, 2005) and are usually well explained by metallicity gradients (Kobayashi & Arimoto, 1999; Henry & Worthey, 1999), plus possibly minor contributions of age gradients as well. Our analysis shows that there is only one parameter driving the SED variations in NGC 4552, and this is likely to be linked to the metallicity of the stellar population.
The case of NGC 3521 is opposite and much more complicated. First of
all, the scatter in SED from pixel to pixel is evidently larger than
in any other galaxy. The two main PCs of this galaxy contribute very
similar amount of variance (54 and 40% respectively), at odds with
the fact that PC1 is clearly the dominant contributor to the variance
in all other galaxies. PC1 appears to be more closely correlated to
optical colours than PC2, which, as opposed, has stronger correlations
with the IR bands; however PC1 and PC2 do not separate optical and IR
in a clear way. The spatial distribution of PC1 and PC2 intensity
(Fig. 22) shows a surprising result. In the inner
parts PC1 is approximately axissymmetric and reflects in part the
spiral structure of the galaxy; beyond 50 arcsec, the
symmetry is broken, with the western part of the galaxy displaying
more intense, positive PC1, and the eastern part having mainly
negative PC1. By looking at the colour-composite image of this
galaxy (see ZCR09, Fig. 5), we see that this reflects the differential
attenuation and the scattering of light in the inclined disc. Thick
dust lanes on the near side (to the west) strongly attenuate all
optical wavelengths, and even attenuate the band as well, meaning
that our normalization will be biased for all these pixels. The
opposite scenario is observed on the far side of the galaxy (to the
east) where the dust back-scatters the light coming from the central
regions, thus resulting in much bluer colours than expected from the
intrinsic stellar population.
PC2 is clearly strong in the central concentrated bulge and in the
very faint outskirts: this can be explained by the fact that PC2
anti-correlates with the colours which are most sensitive to current
star-formation and young stars.
In NGC 3521 the interplay between star-formation, stellar age and dust appears much more complex than in other galaxies and this would explain why the PCA in this case produces very different results than in other galaxies. As we show in the following sections, this is also reflected in NGC 3521 being an outlier in a number of other relations.
3.3 Dependence of SEDs on surface brightness and star formation rate density
The PCA performed in the previous section allows us to condense the properties of pixel SEDs into just two parameters (the intensity of PC1 and PC2) instead of 9, thus making it much easier to study the dependence of such properties on other local parameters. In particular we analyze here the dependence of SED properties on stellar density and star formation rate density.
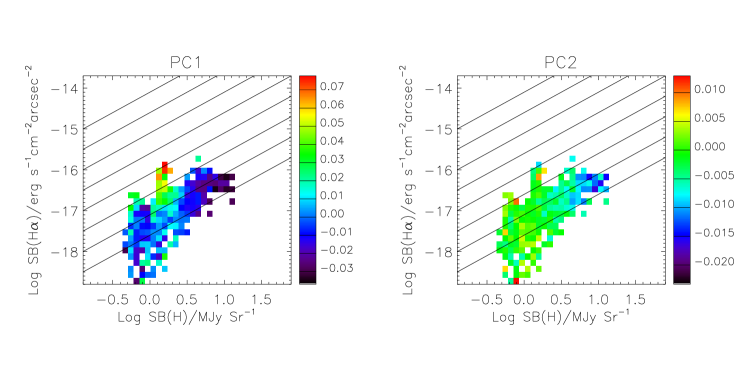
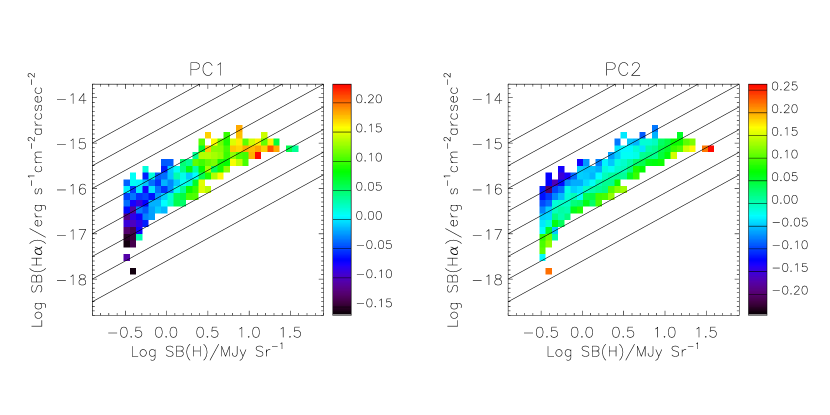
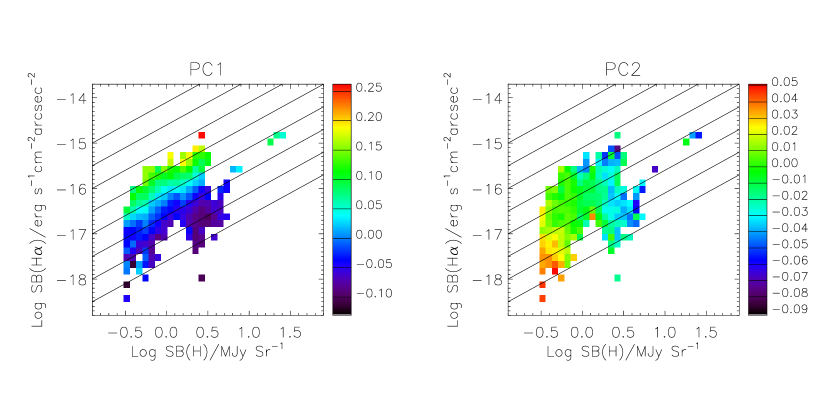
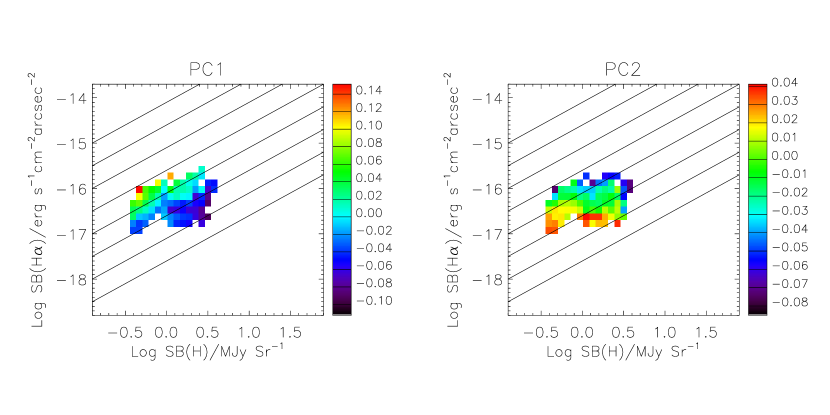
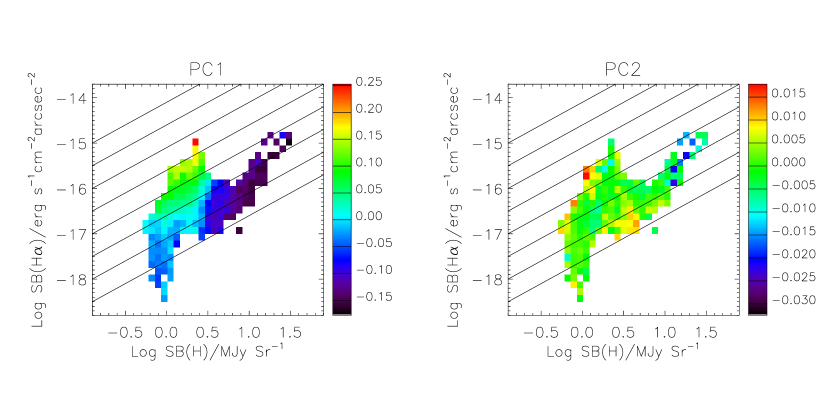
To this goal, for each galaxy we bin all pixels in the 2-dimensional space of - and compute the median value of the coefficients of PC1 and PC2 in each bin. This is shown in the left and right diagrams, respectively, of Fig. 5 for NGC 4254 and Fig. 6 for NGC 4450 (figures for the other galaxies are provided in the online appendix D, except for NGC 4552, which has no H imaging). Importantly, these quantities have direct physical interpretations, with H SB often used as a proxy for star formation rate density (Kennicutt, 1998), while the -band SB can be considered a rough proxy for stellar mass density (e.g. ZCR09).
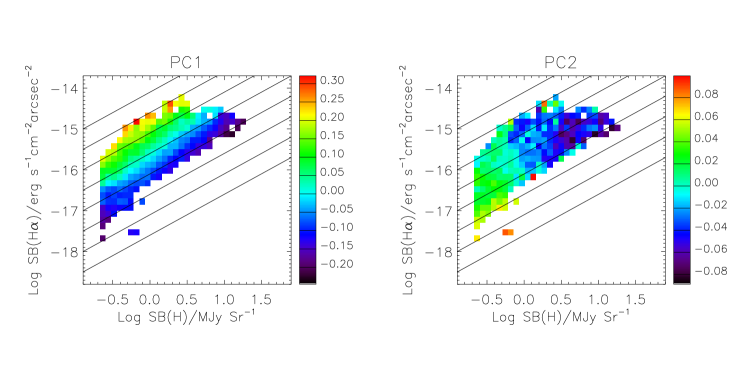
Regular face-on, late type, star forming galaxies, such as NGC 4254, display clear trends for PC1 and PC2 intensity in this SB space. At any given SB() PC1 increases with increasing SB(H), while a reversed trend is seen with SB() at given SB(H). The diagonal lines drawn in each figure mark the loci of constant SB(H)/SB(). Constant PC1 intensity levels are almost parallel to these lines, thus indicating that PC1 is effectively a measure of SB(H)/SB() or, in more physical terms, of the local specific star formation rate . On the other hand, this is not surprising, given the very tight correlation that we show to exist between PC1 and the 8m color (which is proportional to SB(8m)/SB()) and the fact that the 8m emission is a very good tracer of SFR, similar to H. The PC2 intensity trends are somewhat more noisy, with PC2 decreasing at increasing SB(), while no significant trend with SB(H) is observed. Following the physical interpretation given in the previous section of PC2 as a tracer of optical colors and hence of mean stellar age (and dust extinction) and considering that SB() is with good approximation a monotonically decreasing function of radius, this PC2 trend with SB() can be broadly interpreted as reflecting stellar age gradients in late-type galaxies (e.g. MacArthur et al., 2004).
Although not as clear as for NGC 4254, PC1 trends which can be interpreted as tracing sSFR are seen or hinted at also for earlier type galaxies, such as NGC 4450. Concerning PC2 it can be seen that three of the five “regular” galaxies (NGC 4254, 4321, 4450) display a trend of PC2 decreasing at increasing SB(), thus consistent with the hypothesis that PC2 reflects mean age gradients. However for the other two such a trend is not detected, possibly due to the presence of thick dust lanes (NGC 4536) or very weak stellar population gradients (NGC 4579).
These trends of PCs with SB are not seen in NGC 3521 and NGC 4552, whose first two PCs, for different reasons, do not have a straightforward physical interpretation, as already discussed in Sec. 3.2.1.
4 From internal to global SED correlations
In this section we show how to reconcile the lack of correlation between variations in optical and IR colours observed on local scales with the existence of such correlations between integrated colours of galaxies. In Fig. 7 we combine the pixels from all seven galaxies in the sample and show the combined colour-colour plots, like those analyzed in Sec. 3.
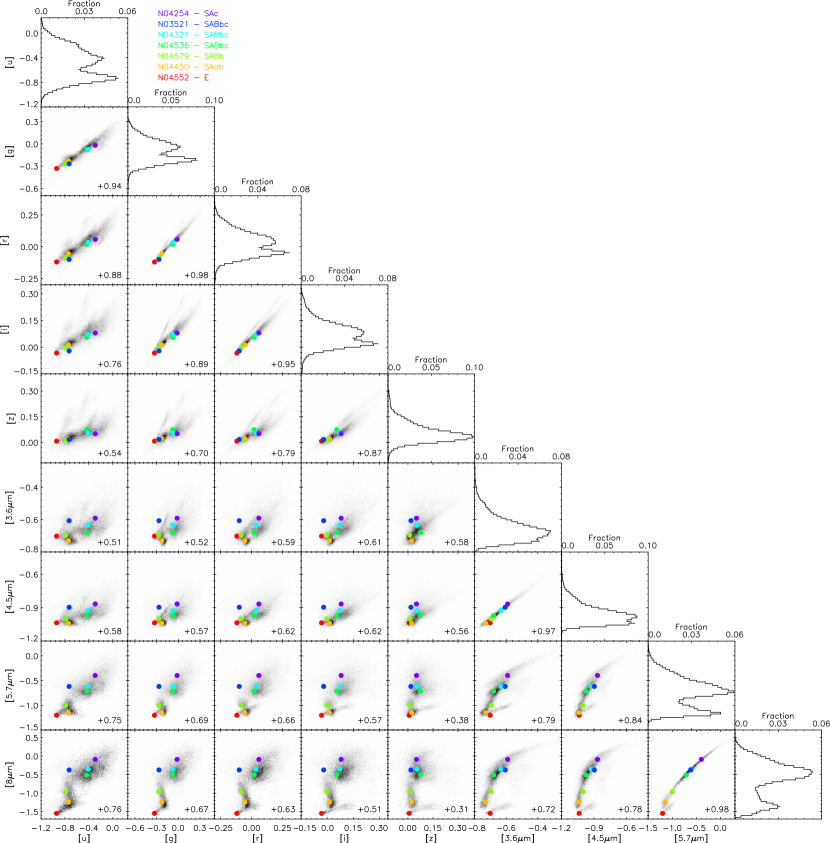
The coloured symbols identify the colours from the integral photometry of each galaxy, as indicated in the legend. Symbol colours from red to purple are used to represent “increasing” morphological types, from early to late. As for individual galaxies, the optical colours of pixels are typically correlated to very high degree, as are the IR colours. However, contrary to what we observe in individual galaxies, when the pixels from all galaxies are combined, the optical colours correlate with IR colours as well, albeit with a larger scatter than that observed between optical colours or between IR colours alone. The correlation is quantified in each panel by the Spearman rank correlation coefficient, which is typically for optical-optical and IR-IR colours, and for optical-IR colours. The global correlations in the optical vs. IR colours result from the fact that, although each galaxy covers a limited region in the colour-colour diagrams with highly scattered clouds of points, the barycentres of the distributions follow well defined relations. This can be seen in the colour-colour relations of the integrated points, where all galaxies, with the only notable exception of NGC 3521 (the blue point), follow very well defined sequences. In other words, we see that the shapes of the integrated SEDs are very correlated between galaxies: IR colours are very tightly linked to each other; by enhancing the IR flux relative to , bluer optical- colours result, which, in turn, are very well correlated with each other. This is a natural consequence of galaxies’ SFHs being typically smooth, such that a higher current rate of star formation (which causes enhanced IR flux) is generally accompanied by a higher abundance of young blue stars, formed in the recent past and already liberated from their dusty birth cloud (Charlot & Fall, 2000). The only outlier in our sample to most of these correlations is NGC 3521, whose aspect and geometrical distribution of dust result in a complex and peculiar interplay between the attenuation and scattering of photons and hence in the observed anomalous colours (see also Sec. 3.2.1 and 5.3).
We note that not only is the relation between IR colours extremely tight for the integrated SEDs and for the average pixel distribution, but also almost all pixels, no matter which galaxy they belong to, appear to follow extremely tight universal relations, whose observed scatter is consistent with or just slightly larger than pure measurement errors. We analyze this in more detail in Sec. 5.
The degree of correlation between the colour and other colours reaches a minimum with the SDSS and bands (Spearman rank correlation coefficient of and respectively), with the correlation with the band being the lowest for all colour combinations. This can be understood by considering that the colour () and the colour () are almost insensitive to stellar age, marginally sensitive to dust extinction and are mainly driven by metallicity (e.g. ZCR09), while the colour is essentially a sSFR indicator (as we showed above), whose relation with metallicity is not obvious (see, e.g., Calzetti et al., 2007; Gordon et al., 2008). Colours at shorter wavelengths are increasingly related to stellar age and therefore it is not surprising that a better correlation with the colour is observed. This reaches a maximum with the correlation of the colour with the colour (for which a significant correlation was already observed within some individual galaxies), as this colour (effectively ) can be also used as a rough proxy of sSFR.
One last point to make about Fig. 7 is that in these colour-colour diagrams galaxies appear to be ordered in their integrated SEDs according to their morphological type (coded by the colours of the symbols). While this is not always exactly the case when one looks at optical colours, the order is exact in the IR colours. Li et al. (2007) also observed similar trends of m (corrected for stellar contamination) vs. 3.6m with morphology. This might be surprising since morphologies are determined at optical wavelengths, not IR. In physical terms, this implies that the morphology of galaxies reflects primarily their sSFR, rather than the properties of their optical SED.
5 Mid-IR colour relations
5.1 A universal sequence of mid-IR colours and its predictive power
In this section we analyze in more detail the relation between IR colours and demonstrate that the SEDs in this spectral window are a one-parameter family to very high accuracy. In the mid panels of Figures 8a), b) and c) we plot the flux at 3.6, 4.5 and 5.7 m, respectively, relative to the flux at 8 m as a function of the colour. Greyscale levels represent the log of pixel densities in the colour-colour spaces for the five “regular” galaxies: NGC 4552 and NGC 3521 are analyzed separately, because of their anomalous natures (see also Sec. 5.3). The orange lines show the running percentiles for this distribution: 2.5, 16, 50, 84 and 97.2%, from the bottom to the top, respectively. The pixels of the elliptical NGC 4552 and the inclined dusty spiral NGC 3521 are represented separately by the coloured points, with NGC 4552 the compact cloud of red points top left in each figure (very low 8 m flux relative to and to all other IRAC bands), while NGC 3521 is the extended sequence of blue points partly offset from the sequence defined by the main sample. These plots suggest that the ratio between 8 m and -band luminosities can be used to predict the luminosities in the other three IRAC bands with high accuracy.
The bottom panels of Figures 8a) to c) show the half-width of the 16–84% percentile range, a robust proxy for the r.m.s., of the pixels belonging only to the five “regular” galaxies. The horizontal dotted line corresponds to the maximum r.m.s. that is expected for null intrinsic scatter and the minimum S/N of 20 in each band. At low m, the scatter in the mm and mm colours is lower than the maximum possible contribution from measurement error, namely 0.02 dex or 5%, and the relation is close to linear. At higher m the relations flatten and the scatter increases up to 0.035–0.040 dex (8–10%), thus requiring significant intrinsic scatter to be explained. As far as scatter is concerned, for the mm colour the situation is reversed: m can be used to predict this colour to typical accuracy better than 7% at m, but its performance is significantly worse (10–12% accuracy) at lower relative flux intensity. The slope of the relation also changes significantly from almost at low m to 0 at high values.
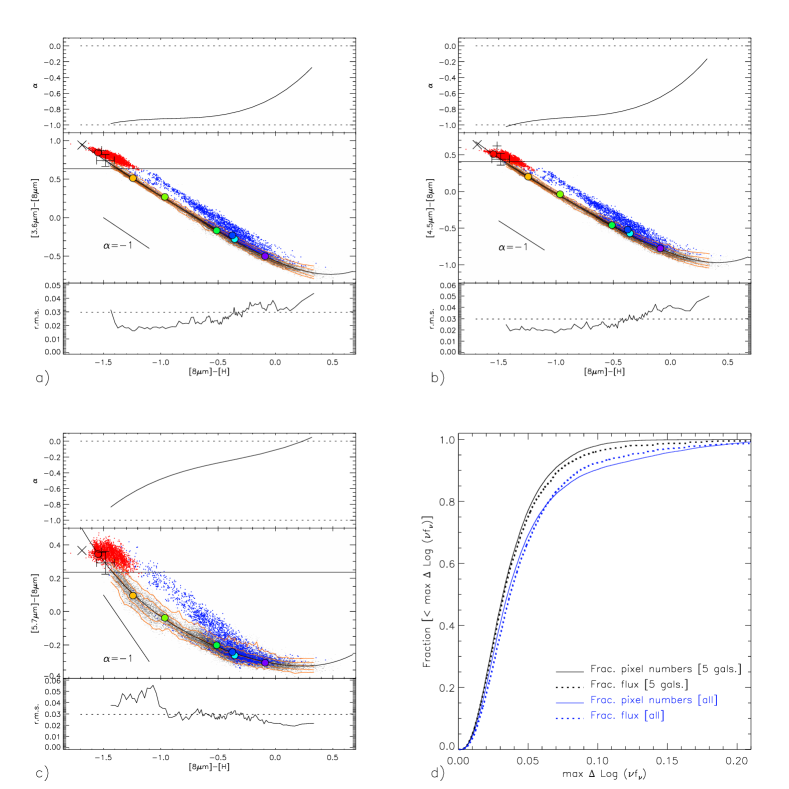
We fit fourth degree polynomials to the relations observed for the five “regular” galaxies. The coefficients are given in Table 3. The fits are shown as solid black lines in the mid panels of the Figures 8a) to c), where they almost perfectly overlap to the running median lines.
| Colour | |||||
|---|---|---|---|---|---|
| (1) | (2) | (3) | (4) | (5) | (6) |
| -0.564 | -0.639 | 0.420 | 0.291 | 0.079 | |
| -0.840 | -0.572 | 0.471 | 0.321 | 0.091 | |
| -0.312 | -0.114 | 0.201 | 0.092 | 0.060 |
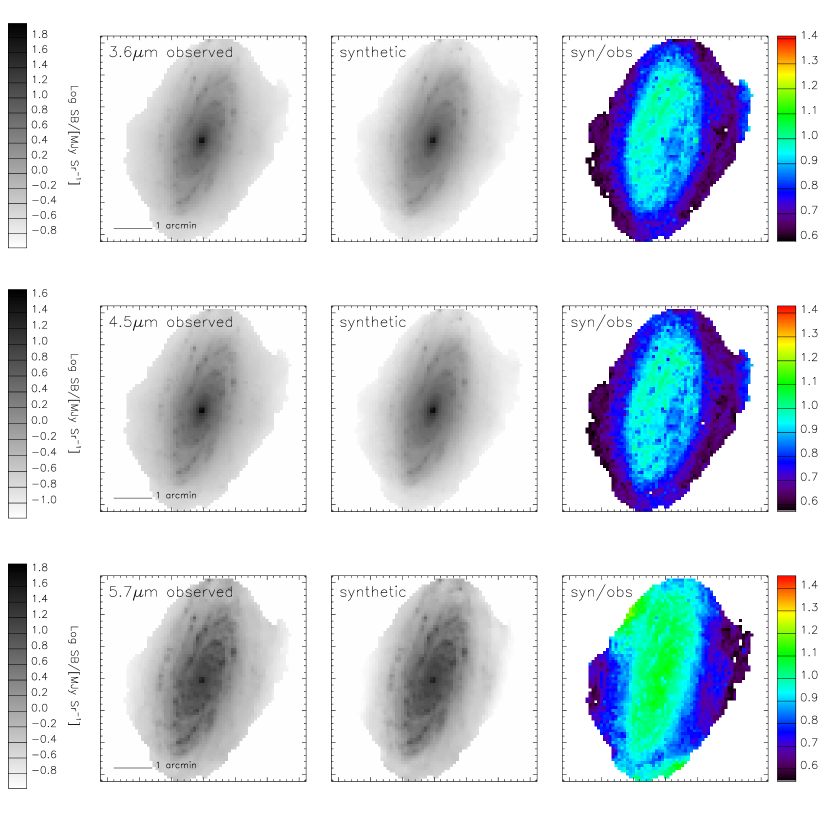
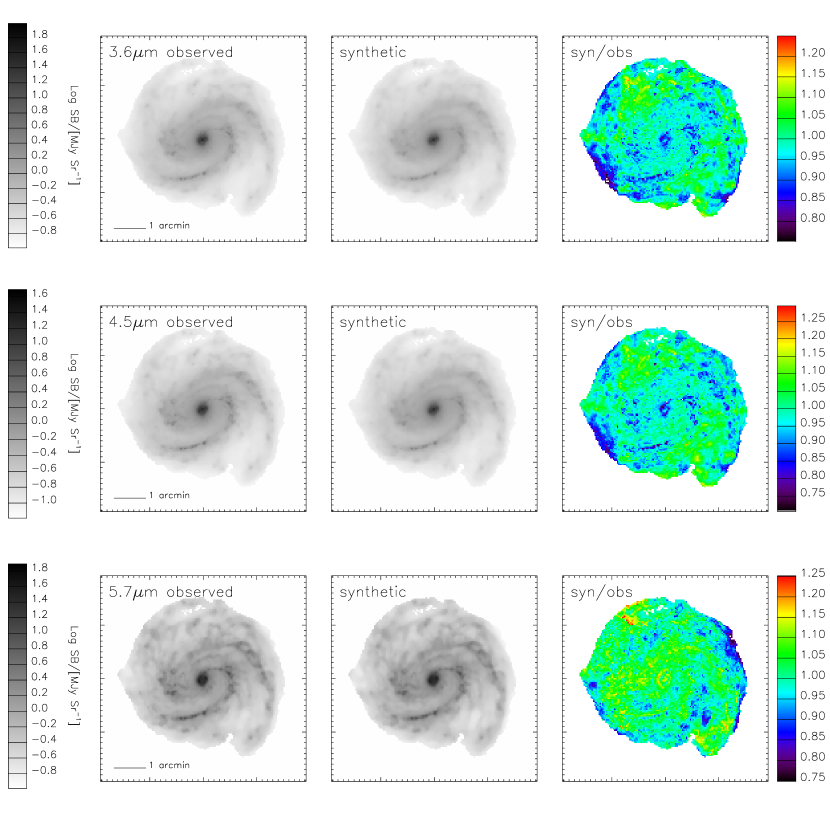
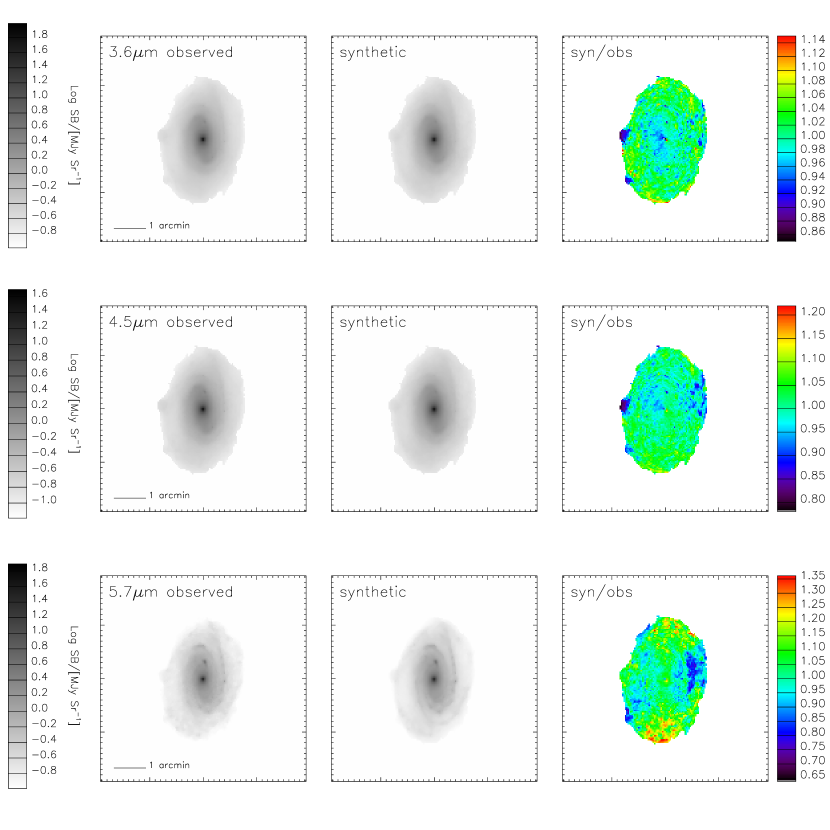
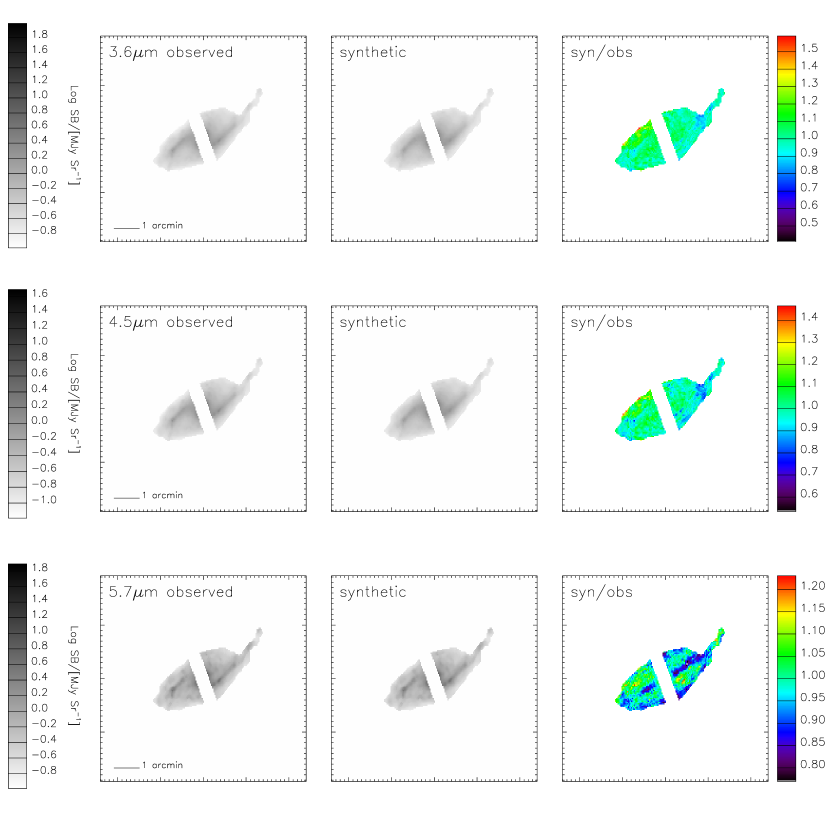
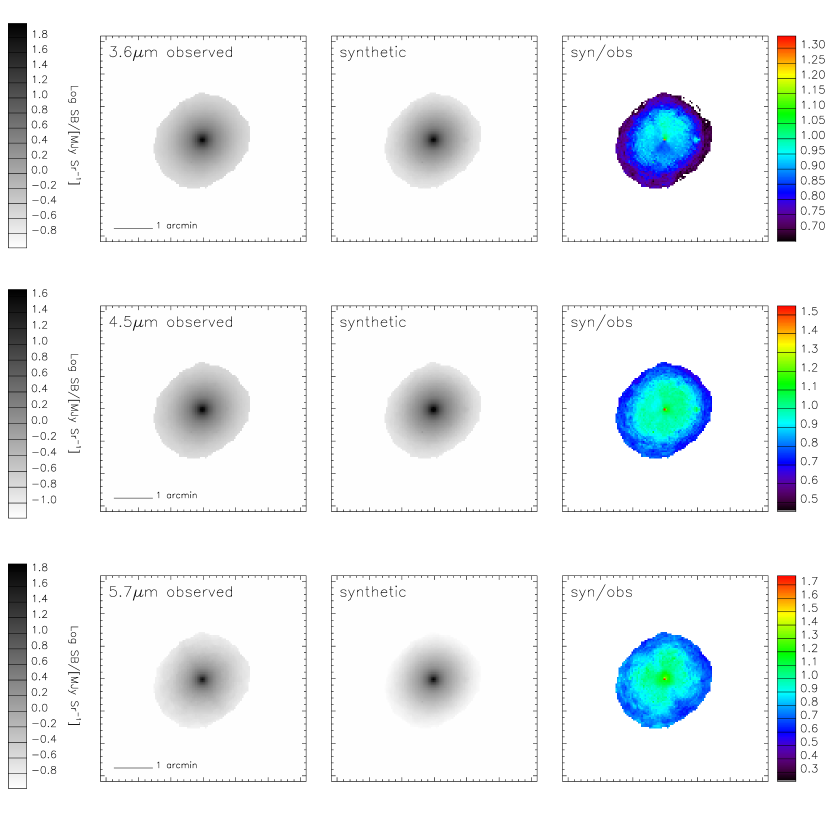
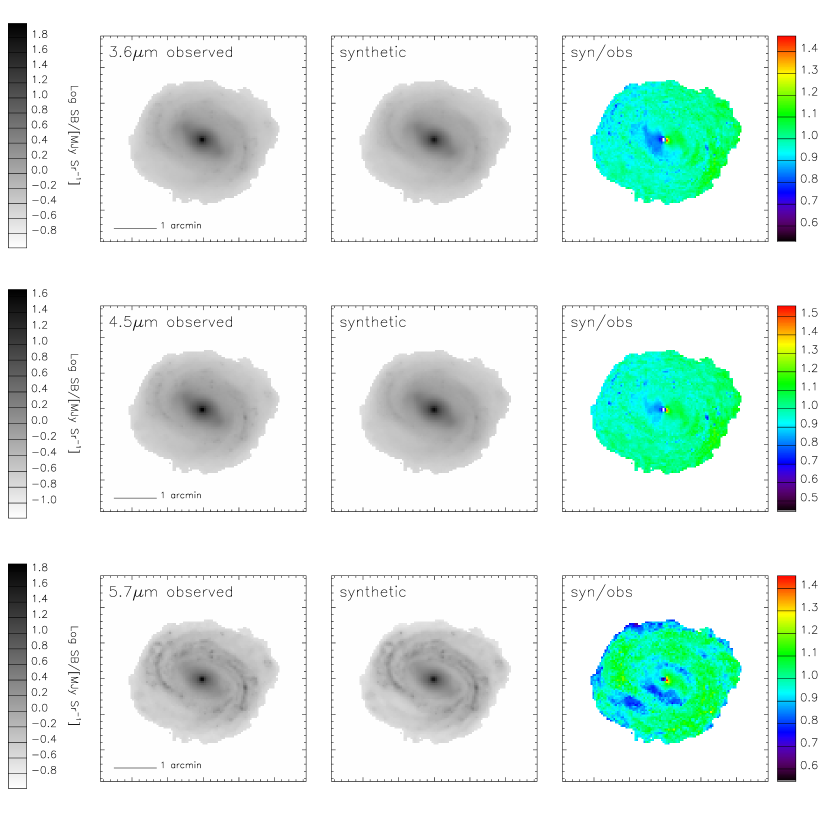
These relations enable the generation of maps of the galaxies at 3.6, 4.5 and 5.7 m just from the -band and 8 m images. An example of this is shown in Fig. 9 for NGC 4254; the images of the remaining six galaxies are provided for comparison in the online appendix (figures 31 to 36). The three rows of images are for the IRAC 3.6, 4.5, and 5.7 m bands respectively. The first image in each row is the original image as observed, the image in the middle is the one “synthesized” from the -band and 8 m images using the fit relations given in Table 3, and the last image is the ratio between the synthetic image and the observed one.
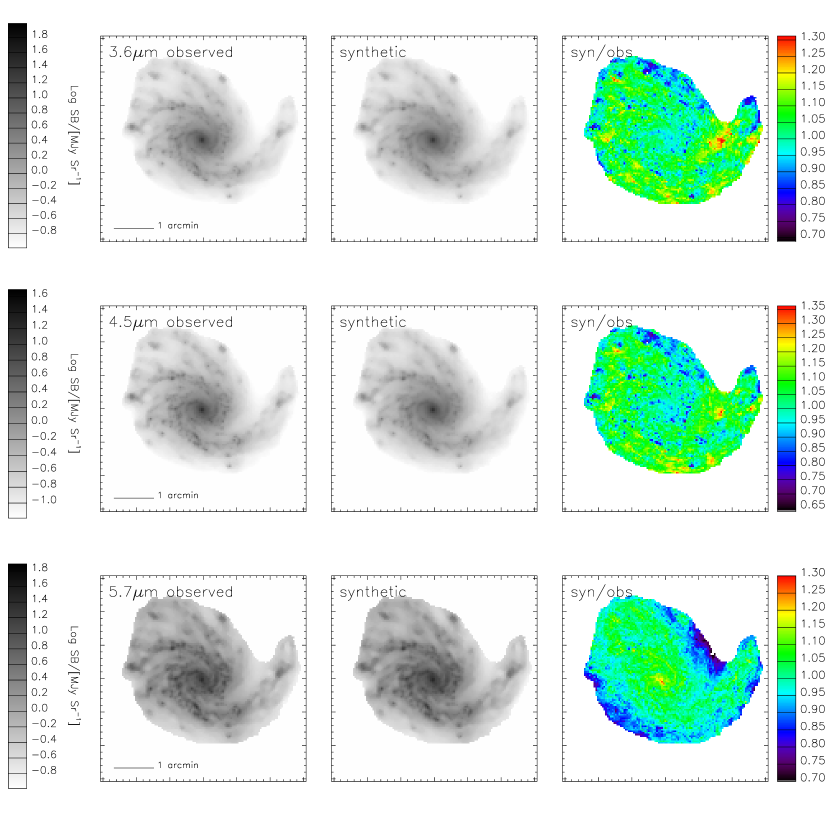
This figure, together with those relative to the other four “regular” galaxies in the online appendix (Fig. 32, 33, 34, 36), illustrates three points: i) the overall accuracy of the synthetic images is on average very good, typically within a few per cent; ii) the same relations can be applied to all galaxies as no significant bias is seen from galaxy to galaxy; iii) significant differences between the observed and the synthetic images are observed in some pixels, up to the level of 20–30%. The spatial distribution of these pixels with the largest deviations is not random, hence not simply a consequence of noise, but rather reflects to some extent the structure visible in the intensity images. For instance, some low-SB regions appear to be biased low in the synthetic 5.7 m image; arm and interarm regions appear to be differently biased with respect to each other in all three reconstructed bands.
To better quantify point i) in the previous paragraph, we measure both the fractional area and -band luminosity occupied by the pixels for which the predicted IRAC fluxes deviate from the observed ones by more than a given amount. For each pixel we determine the maximum absolute difference “max ” between the predicted and observed pixel fluxes in the three bands, i.e. , , and . We plot the fraction of pixels for which “max ” is less than a given amount and the fraction of luminosity in those pixels as a function of in Fig. 8 d) as solid and dotted lines, respectively. Black lines are for the five “regular” galaxies only, while for the blue lines all seven galaxies are used. If we restrict the analysis to the “regular” galaxies only, in 80% of the pixels the maximum deviation between predicted and measured fluxes is dex, i.e. %; 90% of pixels are in agreement within 0.069 dex, i.e. 17.2%. In terms of luminosity fraction, the measured accuracy is slightly worse, thus indicating that the main reason of disagreement between the observed colours and those predicted from our simple fitting formulae does not originate from noise only (or mainly): in fact this plot shows that, on average, the deviating pixels have -band surface brightness higher than average. This confirms the point iii) of the previous paragraph, extracted from the visual analysis of Fig. 9 (and analogues in the online Appendix).
5.2 Relative dust and star contributions and constraints on the purely stellar SED
The IR colour-colour relations analyzed in the previous subsection indicate that the knowledge of the flux ratio between the band mostly affected by dust and PAHs (8 m) and the one including stellar emission only () is sufficient to determine the full SED in between. To first order, we can represent the IR SED as a simple linear combination of a stellar and a dust component, basically templates with constant contributions to each band: at high values of the IR SED is strongly dominated by the dust component, while the stellar continuum dominates at low values. The flux at the three intermediate wavelengths is expected to asymptotically approach a constant ratio to going toward high , whereas a constant ratio to is expected to be approached at low values. These two regimes translate into slopes of 0 and respectively in the colour-colour relations of Fig. 8. In particular, the slope of follows from the fact that for each (3.6, 4.5 and 5.7 m) ; as we approach the purely stellar regime, should become asymptotically constant and therefore vs. should be asymptotically approximated by a line of slope .
It is therefore interesting to show the actual slopes as a function of , which we plot in the upper panels of Fig. 8 a) to c). As far as 3.6 and 4.5 m are concerned, while slopes close to exist for a wide range, with slopes measured up to , a slope of is reached only at the very lowest ratios. Past , quickly approaches 0 for both bands, though it never reaches 0 in the actual data range for either. What these slopes imply is that, while the dust contribution is weak for most values of , the fluxes at 3.6 and 4.5 m can be considered to be “pure” stellar continuum only for the very lowest ratios; as soon as some PAH emission appears at 8 m, also 3.6 and 4.5 m are affected. At typical of star-forming galaxies (see Fig. 7), these bands appear to be heavily contaminated by the PAH feature at 3.3 m, in the 3.6 m band, and by hot dust and extended wings of neighbouring PAH features, in the 4.5 m band (e.g. Draine et al., 2007; Draine & Li, 2007). This issue of dust contamination in the first two IRAC bands is also consistent with work by Meidt et al. (2011, ApJ submitted) and the increase in contamination with star formation was also found by Mentuch et al. (2010).
The slope of the vs. relation indicates that the 5.7 m follows the 8 m emission much more closely (as expected). At the lowest ratios, slope does not even reach , indicating that nowhere in the five “regular” galaxies does the emission at 5.7 m arise purely from stellar continuum. The slope quickly increases toward 0, although this value is only reached at the very highest values: only there does the PAH/dust component fully dominate at 5.7 m, while at lower values the contamination by stellar continuum is still significant. Interestingly, the scatter in the at the highest values most likely reveals the maximal variation between the 6.6m and 7.7m PAH features (and underlying continuum) that dominate these bands, at least in NGC 4254 which dominates these colours. This scatter is small, both relative to the expected noise (bottom panel of Fig. 8c)) and to the variation observed in these PAH features between galaxies, as shown for the SINGS galaxies in Smith et al. (2007, especially Fig. 13).
The exact knowledge of the purely stellar contribution to the galaxies’ mid-IR SED is of great importance in order to gain a more accurate description of dust emission and its physics. As we showed in this section, this task is complicated by the fact that stellar and dust emission in this spectral region are always mixed to some degree. The commonly adopted approach to decouple these two components heavily relies on models (both for stellar and for dust emission) or/and SED fitting techniques (see e.g. Helou et al., 2004; da Cunha et al., 2008). It has to be stressed, however, that stellar population synthesis models in the mid-IR are still very uncertain and poorly constrained by observations. The diagnostic plots of Fig. 8 a), b) and c) allow us to derive empirical constraints on the purely stellar SED in the following way. In the simple hypothesis that i) the SED at each pixel is just a linear combination of a constant stellar component and a constant dust component and ii) band is not contaminated by dust emission, pure stellar emission would correspond, in principle, to the minimum possible value of ( is chosen because it is the band most sensitive to dust emission and because offers the largest wavelength leverage). However, empirically it is very difficult to determine such a minimum because it is a limit which is never actually reached (no galaxy is fully dust-free) and because photometric errors and intrinsic SED variations of the stellar component (which are predicted by SPS models) increase the uncertainties. We use the simple analytical formulae that fit the empirical relations of Fig. 8 a), b) and c) to extrapolate the flux ratios to the limit of pure stellar emission, which we determine as the point () at which the derivative of the relation is , according to the argument given previously. The determination of the purely stellar depends on the relation one considers: for and the solution is actually found by extrapolation, whereas for occurs within the range covered by the data555This is possibly due to the fact that the band is the only band not directly including PAH features and therefore might reach a constant ratio to at higher than for the two other bands.. The variations in this “stellar point” among the three different determinations provides some direct empirical estimate of the uncertainty of this flux ratio. Flux ratios between the other bands are obtained by plugging the resulting “stellar” colour into the corresponding 4th order polynomials from Table 3. The resulting three determinations of the stellar flux ratios are given in Table 4, along with their mean and standard deviation. Our determinations are accurate at dex (2%) level for all bands except , whose ratio with respect to shorter wavelength cannot be estimated better than 20%. We also report the IR flux ratios from SPS models: the wide-spread Helou et al. (2004) values, which were computed using Starburst99 (Leitherer et al., 1999), and those we derive from a preliminary 2007 version (CB07 hereafter) of the Bruzual & Charlot (2003) SPS models, which includes an improved treatment of TP-AGB stars. These models predict little dependence on stellar metallicity and age for ages larger than 2 Gyr, while variation up to 30% or more can be expected for younger populations. For this reason we report the ratios for simple stellar populations (SSPs) older than 2 Gyr and for an SSP 1 Gyr old, both using solar metallicity and Salpeter IMF. The Helou et al. (2004) values typically over-estimate by % the IR flux ratios to with respect to our empirical estimates. By contrast, the old CB07 SSPs are in excellent agreement with observed estimates between and , while it appears that fluxes at longer wavelengths are significantly under-estimated by up to %. In consideration of the apparent disagreement between SPS models, the empirical ratios derived from our analysis are of great importance to improve the SED modeling of this spectral region.
| Slope from relation | ] | ||||||
|---|---|---|---|---|---|---|---|
| (1) | (2) | (3) | (4) | (5) | (6) | (7) | (8) |
| mean | |||||||
| Helou et al. (2004) | |||||||
| CB07 (Gyr) | |||||||
| CB07 (Gyr) |
5.3 Mid-IR colour relations of the “anomalous” galaxies NGC 4552 and NGC 3521
The two galaxies that stand out due to their anomalous principal component analyses also have evident anomalies when we look at their IR colour-colour relations (i.e. red and blue clouds in Fig. 8).
As expected from the lack of current star-formation, the elliptical galaxy NGC 4552 has the lowest ratio of 8 m luminosity to and also the lowest ratios of luminosities in the three shorter IRAC bands with respect to m, as one can see from the red points in Fig. 8. However, a substantial fraction of those points appear to lie above the extrapolated colour relations for all other galaxies. Stellar population synthesis models of these spectral regions are unfortunately still too inaccurate to provide an explanation for these deviations of the order of 20–30%. The observed phenomenon can be summarized by saying that the luminosity at shorter IR wavelengths is (increasingly) suppressed with respect to longer wavelengths. As we verify using the stellar population synthesis models with dust attenuation of ZCR09, these mid-IR colours could be explained by invoking a substantial amount of reddening by dust, which can in principle move the data points above and to the right of the relations of Fig. 8. However, our maps show that the outer regions of the galaxy are the most affected by this effect and that there is a suppression of NIR emission also with respect to optical wavelengths. In addition, NGC 4552 is not detected at 160 m with Spitzer (Draine et al., 2007), thus implying a negligible amount of dust. All these facts argue against dust reddening as a cause of the anomalous IR colours. We also explore the possibility that a radial variation of the stellar mass function originates such an effect: using CB07 SPS models we find that for stellar populations older than a couple of Gyr (as it is the case for NGC 4552), the IR colours differ by less than a few per cent going from a Salpeter to a Chabrier IMF. According to the spectral indices measured by Trager et al. (2000) in different apertures and the Sauron index maps of Kuntschner et al. (2006), NGC 4552 is iron-enriched and -enhanced to supersolar values (by comparison with, e.g., the Thomas et al., 2003, models). appears to moderately increase at large radii, while the decrease in the strength of the iron indices toward larger radii hints at a moderate decrease in metallicity. According to the CB07 SPS models, the decrease in metallicity could affect the mid-IR colours in the required direction. We note however that the anti-correlation between the strength of the iron indices and (Thomas et al., 2003) makes this metallicity gradient quite uncertain. We suggest that the increase of to values up to 0.35–0.40 dex higher than solar at large radii could be the reason of the anomalous (near)IR colours. A thorough investigation of the dependence of these colour on and metallicity, which is beyond the scope of this paper, would be required to provide a robust explanation of the observed effects.
As already discussed in Sec. 3.2.1, anomalies in the SED of NGC 3521 result from the complex effects of substantial dust absorption and scattering. From Fig. 8d) and Fig. 31 (online appendix), there is a significant fraction of pixels in this galaxy in good agreement with the “universal” relations derived in the previous section. These pixels are located in the far (north-east) part of the inner disc, those apparently less affected by extinction and scatter. All other pixels appear to form a sequence offset from the relations of Fig. 8, which underestimate the fluxes at 3.6, 4.5 and 5.7m with respect to the observed ones. On the near (south-western) side of the disc the stellar light is heavily dust obscured, so much so that even the -band (and possibly the shortest IRAC bands) is attenuated, and this probably explains the offset of these pixels to the right (and up) of the relations. However, the reason for the pixels in the halo of the galaxy being similarly offset is unclear. It is possible that something similar to what happens in the outer regions of NGC 4552 occurs here as well, as the continuity between the sequence of the red and the blue pixels of Fig. 8 suggests.
6 Summary and concluding remarks
Using multiwavelength data (-band to 8m) for seven nearby galaxies, resolved at scales of pc pix-1 with a Signal-to-Noise Ratio of for each pixel, we have demonstrated, both qualitatively and quantitatively, the disconnect that occurs between the optical and infrared colours relative to the near-IR -band on the small scales within galaxies. A very important point in the analysis is the choice of the -band point as the normalization of the pixel SEDs, as this band is the least affected by dust absorption and emission at the same time and divides the portion of SEDs possibly affected by dust emission (longward of it) from the one dominated by stellar emission, possibly extincted by dust (shortward of it). Normalizing at other wavelengths where dust effects are more substantial would likely destroy the observed correlations by mixing different emission/absorption mechanisms. In fact, we have checked that using a slightly shorter wavelength for normalization, such as the band, results in similar although more scattered correlations. On the other hand, if we move the normalization to longer wavelengths, we expect quite dramatic effects already at 3.6m, where we have demonstrated the contamination by dust emission to be substantial.
Qualitatively, the disconnect between the optical and infrared colours can be seen in colour–colour plots (figures 1, 2, and 17 to 21) where correlations can be visibly seen between optical–optical colours, IR–IR colours, but not optical–IR colours. This holds true for all but two of the seven galaxies: NGC 4552, an elliptical galaxy whose colours at all wavelengths examined are dominated by stellar light from old stars, and thus all colours are correlated to a high degree; and NGC 3521, a more inclined late-type galaxy with significant scatter in its colours, with dust causing weird colour correlations due to the effects of attenuation on the near side of the galaxy, and scattering on the far side.
The observed disconnect in colours can be investigated using Principal Component Analysis (PCA) of the distribution in -band normalized Spectral Energy Distribution (SED) space of the pixels in each galaxy. This analysis picks out two distinct and uncorrelated components in each of the five “typical” galaxies; a component that dominates the variance and is strongly correlated to the variations in the IR, and a component that is mainly correlated to the variations in the optical (see figures 3, 4, and 22 to 26). These two components account for most (%) of the observed variance in colours across the galaxies, and show distinct spatial variations in galaxies, with the dominant primary component associated with the IR variance (PC1) being stronger in spiral arms and star forming regions, and the other optically dominated component (PC2) being enhanced in the interarm regions and outskirts of galaxies.
These two principal components can be associated with physical properties within the galaxies by comparison with the surface brightnesses in H and in -band, themselves proxies for the star formation rate (SFR) and stellar mass (). This comparison (figures 5, 6, and 27 to 30) reveals a strong correlation of PC1 with increasing SB(H)/SB(), an indicator of the specific star formation rate (sSFR), while PC2 variation correlates with SB(), although with significant scatter.
Altogether, these correlations indicate that PC1 is detecting regions where young stars are dominating the colours, and predominantly in the IR, while PC2 is picking up variations in the mean stellar age, which is associated with the stellar mass density, with the most massive regions generally the oldest on average. It is these two distinct components that both the colours and PCA technique reveal.
Given the disconnect observed on the small scales, it is surprising that the global correlations of galaxy colours and types exist (e.g. Kennicutt, 1998). However, as figure 7 reveals, while there are distinctions on the pixel scales (pc), globally the mean SEDs and colours trace very well the type of the galaxy, with later-types being bluer and dustier (IR brighter) than early-types. Within each galaxy, the scatter (and disconnect of IR and optical) is around this mean SED. In more physical terms, we can interpret this as the result of sSFR and stellar mass density (stellar age) being correlated between galaxies, but not (necessarily) within galaxies.
Interestingly, the relations between the mid-IR colours are even tighter when all seven galaxies in our sample are considered together. When an IR–IR colour (e.g. ) is plotted as a function of a IR–near-IR colour (i.e. ) these tight relations are apparent (figure 8). Simple 4th-order polynomial fits to these relations (resulting in the coefficients in Table 3) have a r.m.s. scatter around them which is, most of the time, less than the maximum expected photometric uncertainties. These functional fits are tight enough that the colour images can be used as a predictive tool for the fluxes in the three other IRAC bands with deviation of only a few percent typically (figure 9 and figures 31 to 36).
What these relationships reveal is the varying contribution of dust to the IRAC bands. The -band is purely stellar, with no dust contribution, while the 8m IRAC band is dominated by the 7.7m polycyclic aromatic hydrocarbon (PAH) complex, with only a weak stellar contribution, and thus the colour is a measure of relative dust contribution to the pixel SEDs. The colour–colour diagrams of figure 8 therefore show the contribution of dust and stars in each band, going from pure stellar (where the slope is ) to dust dominated (where the slope is ). By extrapolating the function fits to where the slope becomes we are able to empirically determine the pure stellar colours in the IRAC bands (table 3), at least for the galaxies in our sample. The plots clearly show the need to correct for dust when using the IRAC bands as tracers of stellar mass (see e.g. Meidt et al. 2011 for such a correction). Interestingly, these colours match that of the 2007 models of Bruzual & Charlot (2003) (not calibrated for these wavelengths) for old (Gyr) stars at the shortest wavelengths, but is much redder (flatter SED) at the long (5.7 and 8m) bands and bluer (steeper SED) than that suggested by Helou et al. (2004) in these bands. Another interesting note is that the scatter of pixels in the stellar and dust regimes of these relations gives an indication of the intrinsic scatter in the stellar SED or the “dust” SED respectively on the scales explored here. This scatter is surprisingly low (figure 8a)–b), lower panels), given the known contribution of various stellar evolutionary stages to the -band, though the scatter is somewhat larger for dust given the observed variation in PAH features and hot dust contribution in galaxies with Spitzer-IRS (e.g. Smith et al., 2007).
In Summary, while on global scales the IR and optical colours of galaxies are correlated with their star formation history and galaxy-type, the correlation of IR and optical colours breaks down internally in galaxies on local scales. The IR dominated and optical dominated components can be spatially associated with regions and with physical processes, with the IR excess coming from regions of high specific star formation rate, while the optical excess is broadly associated to low -band surface brightness (stellar mass density) regions and to unobscured young stellar associations along spiral arms. The disconnect of optical and IR colours is because of this spatial distinction of the uniform underlying older stellar population, and the more concentrated, stochastic star forming regions. However, this disconnect of optical and IR colours in galaxies is around a mean, and the mean colours of galaxies follow the well-observed trend of bluer optical and stronger IR in later type galaxies. The IRAC colours within galaxies follow each other closely, with a tight enough relationship that a IRAC–near-IR colour can be used to predict the fluxes in the other IRAC bands.
Acknowledgments
We thank the anonymous referee for useful comments that have lead to an improved manuscript.
The Dark Cosmology Centre is funded by the Danish National Research
Foundation.
References
- Blanton et al. (2003) Blanton M. R., et al. 2003, ApJ, 594, 186
- Brinchmann et al. (2004) Brinchmann J., Charlot S., White S. D. M., Tremonti C., Kauffmann G., Heckman T., Brinkmann J., 2004, MNRAS, 351, 1151
- Bruzual A. & Charlot (1993) Bruzual A. G., Charlot S., 1993, ApJ, 405, 538
- Bruzual & Charlot (2003) Bruzual G., Charlot S., 2003, MNRAS, 344, 1000
- Calzetti (1997) Calzetti D., 1997, AJ, 113, 162
- Calzetti et al. (2007) Calzetti D., et al. 2007, ApJ, 666, 870
- Calzetti et al. (2010) Calzetti, D., et al. 2010, ApJ, 714, 1256
- Charlot & Fall (2000) Charlot S. ., Fall S. M., 2000, ApJ, 539, 718
- da Cunha et al. (2008) da Cunha E., Charlot S., Elbaz D., 2008, MNRAS, 388, 1595
- de Vaucouleurs (1959) de Vaucouleurs G., 1959, Handbuch der Physik, 53, 275
- de Vaucouleurs et al. (1991) de Vaucouleurs G., de Vaucouleurs A., Corwin H. G., Jr., Buta R. J., Paturel G., Fouqué P., 1991, Third Reference Catalogue of Bright Galaxies, Springer-Verlag Berlin Heidelberg New York
- Draine (2003) Draine B. T., 2003, ARA&A, 41, 241
- Draine et al. (2007) Draine B. T., et al. 2007, ApJ, 663, 866
- Draine & Li (2007) Draine B. T., Li A., 2007, ApJ, 657, 810
- Gallazzi et al. (2005) Gallazzi A., Charlot S., Brinchmann J., White S. D. M., Tremonti C. A., 2005, MNRAS, 362, 41
- Gavazzi et al. (2003) Gavazzi G., Boselli A., Donati A., Franzetti P., Scodeggio M., 2003, A&A, 400, 451
- Gavazzi et al. (1999) Gavazzi G., Boselli A., Scodeggio M., Pierini D., Belsole E., 1999, MNRAS, 304, 595
- Gordon et al. (2008) Gordon K. D., Engelbracht C. W., Rieke G. H., Misselt K. A., Smith J., Kennicutt Jr. R. C., 2008, ApJ, 682, 336
- Helou et al. (2004) Helou G., et al. 2004, ApJS, 154, 253
- Henry & Worthey (1999) Henry R. B. C., Worthey G., 1999, PASP, 111, 919
- Hogg et al. (2005) Hogg D. W., Tremonti C. A., Blanton M. R., Finkbeiner D. P., Padmanabhan N., Quintero A. D., Schlegel D. J., Wherry N., 2005, ApJ, 624, 162
- Hubble (1926) Hubble E. P., 1926, ApJ, 64, 321
- Jarrett et al. (2003) Jarrett T. H., Chester T., Cutri R., Schneider S. E., Huchra J. P., 2003, AJ, 125, 525
- Jolliffe (2002) Jolliffe I. T., 2002, Principal component analysis. Springer
- Kauffmann et al. (2003) Kauffmann G., Heckman T. M., White S. D. M., Charlot S., Tremonti C., Peng E. W., Seibert M., Brinkmann J., Nichol R. C., SubbaRao M., York D., 2003, MNRAS, 341, 54
- Kennicutt (1998) Kennicutt R. C., 1998, ARA&A, 36, 189
- Kennicutt et al. (2003) Kennicutt R. C., et al. 2003, PASP, 115, 928
- Kobayashi & Arimoto (1999) Kobayashi C., Arimoto N., 1999, ApJ, 527, 573
- Kobulnicky & Kewley (2004) Kobulnicky, H. A., & Kewley, L. J. 2004, ApJ, 617, 240
- Kroupa (2001) Kroupa P., 2001, MNRAS, 322, 231
- Kuntschner et al. (2006) Kuntschner H., Emsellem E., Bacon R., Bureau M., Cappellari M., Davies R. L., de Zeeuw P. T., Falcón-Barroso J., Krajnović D., McDermid R. M., Peletier R. F., Sarzi M., 2006, MNRAS, 369, 497
- Lawrence et al. (2007) Lawrence A., et al. 2007, MNRAS, 379, 1599
- Leitherer et al. (1999) Leitherer C., Schaerer D., Goldader J. D., González Delgado R. M., Robert C., Kune D. F., de Mello D. F., Devost D., Heckman T. M., 1999, ApJS, 123, 3
- Li et al. (2007) Li H., Wu H., Cao C., Zhu Y., 2007, AJ, 134, 1315
- MacArthur et al. (2004) MacArthur L. A., Courteau S., Bell E., Holtzman J. A., 2004, ApJS, 152, 175
- Mentuch et al. (2010) Mentuch E., Abraham R. G., Zibetti S., 2010, ApJ, 725, 1971
- Michard (2000) Michard R., 2000, A&A, 360, 85
- Michard (2005) Michard R., 2005, A&A, 441, 451
- Moustakas et al. (2010) Moustakas J., Kennicutt R. C., Jr., Tremonti C. A., Dale D. A., Smith J.-D. T., Calzetti D., 2010, ApJS, 190, 233
- Roberts & Haynes (1994) Roberts M. S., Haynes M. P., 1994, ARA&A, 32, 115
- Smith et al. (2007) Smith J. D. T., et al. 2007, ApJ, 656, 770
- Thomas et al. (2003) Thomas D., Maraston C., Bender R., 2003, MNRAS, 339, 897
- Trager et al. (2000) Trager S. C., Faber S. M., Worthey G., González J. J., 2000, AJ, 119, 1645
- Tremonti et al. (2004) Tremonti C. A., Heckman T. M., Kauffmann G., Brinchmann J., Charlot S., White S. D. M., Seibert M., Peng E. W., Schlegel D. J., Uomoto A., Fukugita M., Brinkmann J., 2004, ApJ, 613, 898
- York et al. (2000) York D. G., et al. 2000, AJ, 120, 1579
- Zibetti (2009) Zibetti S., 2009, eprint arXiv:0911.4956
- Zibetti et al. (2009) Zibetti S., Charlot S., Rix H., 2009, MNRAS, 400, 1181
Appendix A Images in eleven bands and SEDs for the full sample
Appendix B Colour correlations for the five galaxies not in the main paper

Appendix C PCA decomposition for the five galaxies not in the main paper
Appendix D Dependence of principal components on surface brightness and star formation for the four galaxies not in the main paper
Appendix E Synthetic IRAC images for the six galaxies not in the main paper