Theory and simulations on strong pinning of vortex lines by nanoparticles
Abstract
The pinning of vortex lines by an array of nanoparticles embedded inside superconductors has become the most efficient practical way to achieve high critical currents. In this situation pinning occurs via trapping of the vortex-line segments and the critical current is determined by the typical length of the trapped segments. To verify analytical estimates and develop a quantitative description of strong pinning, we numerically simulated isolated vortex lines driven through an array of nanoparticles. We found that the critical force grows roughly as the square root of the pin density and it is strongly suppressed by thermal noise. The configurations of pinned lines are strongly anisotropic, displacements in the drive directions are much larger than in the transverse direction. Moreover, we found that the roughening index for the longitudinal displacements exceeds one. This indicates that the local stresses in the critical region increase with the total line length and the elastic description breaks down in the thermodynamic limit. Thermal noise reduces the anisotropy of displacements in the critical regions and straightens the lines.
pacs:
74.25.Wx,74.25.Sv,74.20.DeI Introduction
The introduction of large-size nanoparticles of different shapes has emerged as the best practical way to improve the current performance of high-temperature superconductors. While in the first superconducting cables the critical currents were limited by weak links, in the second-generation superconducting wires based on aligned YBa2Cu3O7 (YBCO) films this problem has been mostly resolved and critical currents are determined by vortex pinning. Impressive progress has been made to enhance critical currents in these films using both isotropic Civale ; HauganNat04 ; Song ; Gutierrez ; YamasakiSST08 ; MiuraPRB11 ; PolatPRB11 and columnar MacManusNatMat04 ; Kang ; VaranasiSUST07 inclusions. In spite of this progress, our understanding of strong pinning mechanisms is far from satisfactory. Theoretical estimates describing the pinning of vortex lines by an array of strong pins at low temperatures were elaborated by Ovchinnikov and Ivlev.OvchinnIvlPRB91 This theory was applied to describe the behavior of the critical currents in the real YBCO films in Refs. BeekPRB02, ; IjaduolaPRB06, . In particular, frequently observed power-law decay of the critical current as a function of the magnetic field with a power slightly larger than is naturally explained by this theory. More recently, it was also argued that strong pins of unknown origin determine critical currents at low magnetic fields in several iron pnictide compounds.BeekPRB10 It is not clear, however, to what extent available qualitative estimates describe the real situation. Due to the obvious importance of strong pinning by large-size inclusions for real superconducting materials, it is desirable to elaborate a quantitative theory describing pinning in such situations. Moreover, the very important issue of pinning suppression by thermal fluctuations does not have any theoretical description in the strong-pinning regime.
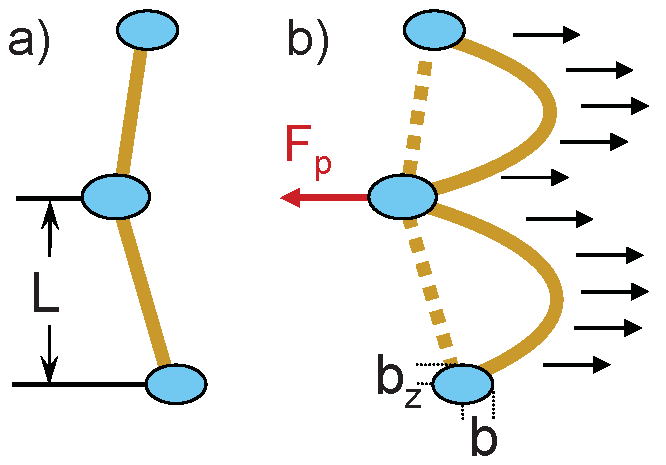
In this paper we consider the pinning of vortex lines in a superconductor containing insulating inclusions with lateral sizes larger than the coherence length. We focus on the pinning of individual vortex lines corresponding to small magnetic fields. Pinning occurs via the trapping of finite-size segments of a vortex lineOvchinnIvlPRB91 with a typical length , as illustrated in Fig. 1. The critical current is determined by the length of the trapped segment and the pin-breaking force ,
| (1) |
Therefore, in the strong-pinning regime the critical-current problem is mostly reduced to evaluation of the trapped-segment length . In general, trapping of the vortex lines is a complicated dynamic process controlled by the competition between the pinning energy, line tension, and intervortex interactions. Different approaches may be used to evaluate the trapped-segment length. One can assume that the pinning center always grabs a piece of the vortex line when it is energetically favorable. This assumption implies that thermal fluctuations facilitate local equilibration. In this case the parameters of the trapped configurations can be obtained from the energy-balance estimates. We will call this type of trapping the equilibrium regime. This energy-balance consideration determines trapped configurations of static vortex lines prepared by cooling in finite magnetic field. However, such consideration is not applicable to the more typical dynamic scenario when moving lines are trapped after the driving force is slowly reduced down to the critical value. In this case the line motion close to the critical force is a continuous trapping-detrapping process limited by local instabilities. The driven vortex can be captured when the line either directly collides with a strong pin or passes sufficiently close to it. In the second case trapping may occur due to the long-range pin-vortex interaction as a result of local instability.OvchinnIvlPRB91 The line remains trapped until the force acting from the pin does not exceed the pin-breaking force. When the line finally stops, the pinned configuration is expected to be very anisotropic because the transverse pin-to-pin displacements which are determined by trapping events are much smaller than the longitudinal displacements limited by the pin-breaking criteria.
To develop a quantitative picture and verify analytical estimates, we explore in this paper the pinning of the vortex lines by nanoparticles with extensive numerical simulations. We study the dependence of the critical force on the density of pins, the statistical properties of trapped lines including average values, and the distributions of trapping length and pin-to-pin displacements. We study long-range behavior of line displacements in the direction of the driving force and in the transverse direction. We also study in detail the suppression of the apparent critical force by thermal fluctuations and the temperature dependence of the trapping parameters.
The paper is organized as follows. In Section II we describe parameters characterizing the interaction between a vortex line and large-size pinning centers. In Section III we present analytical estimates. This includes the formulation of general conditions for stable trapped configurations in subsection III.1, making estimates for parameters of trapped line in equilibrium, subsection III.2, and in the case of dynamic trapping, subsection III.3. In the Section IV we describe the model used in our numerical simulations. In the Section V we present our numerical results including the zero-temperature case in subsection V.1 and the finite temperature in subsection V.2 In Section VI we discuss our results and make preliminary comparisons with experiments.
II Interaction between vortex line and pinning center
We consider first the essential parameters describing the interaction of vortex lines with large-size pinning centers. The vortex pinning energy by an insulating spheroid inclusion with the axes and is given byfootnoteLp
| (2) |
with .A very important parameter is the pin-breaking force, the maximum force with which the pinning center can attract the vortex line. In contrast to small defects, the pin-breaking force for large-size defects is limited by the line tension of the vortices. With increasing external force, the tips of the vortex line slide along the surface of the insulating inclusion until they meet near the equator and reconnect leading to the depinning of the vortex. For the in-plane current in the anisotropic layered material, the upper estimate for such a line-tension-limited force can be obtained by considering the simple geometry of equally spaced pins aligned along the axis and neglecting the interaction between vortex tips at the pin surface. In this case, evaluating the external force at which the tips meet, we obtain the following estimate
| (3) |
where is the anisotropy factor, , is the c-axis coherence length, and is the interlayer period of a layered superconductor. This force only weakly depends on the size and shape of the pinning center.
The interaction of the vortex line with a remote pin is long ranged, due to the perturbation of the supercurrent flow around the vortex by the pin,
| (4) |
where is the volume of the pinning center and are “depolarization factors”, which depend on the parameter . In particular, in the case which includes close-to-spherical inclusions,
and .
Recently, it was demonstrated that magnetic force microscopy can be effectively used not only for imaging but also for the manipulation of individual vortices MFMManip . This technique gives principal possibility to measure the interaction between a vortex line and an individual pinning center and extract the relevant interaction parameters described in this section.
III Analytical estimates for the trapping of a vortex line
III.1 General conditions for a static pinned line
Consider a general vortex-line configuration trapped at the points . For simplicity, we assume that the forces from the pins are applied locally at the points . In between the trapped points, , the displacement obeys the following equation
| (5) |
where is the driving force applied along the axis and is the line tension with being the logarithmic factor .NoteLogLength The displacement can be found as
| (6) |
The force acting from the pin on the vortex line at is given by
and can be evaluated as
| (7) |
The stability condition for the trapped line is given by
| (8) |
while the critical state corresponds to the condition that at least one local force reaches the pin-breaking force
| (9) |
One simple consequence of Eqs. (7) and (8) is that for “behind” sites, , the line-tension force adds to the external force meaning that they, in average, have shorter trapping segments , .
III.2 Equilibrium trapping
Consider the trapping of a single vortex line by strong-pinning centers with concentration and pinning energy , Eq. (2). Assuming local equilibrium, the typical trapping length and transverse displacement are determined by the energy-balance condition BeekPRB02
and by the condition that the average number of impurities in the trapping volume should be of the order of one,
These equations give
| (10) |
Strictly speaking, the above conditions are obtained for zero current. Assuming that the trapping length does not change much when current is applied, we obtain an estimate for the critical current for the equilibrium trapping
| (11) |
It is expected to increase with the pin density as .
III.3 Dynamic trapping
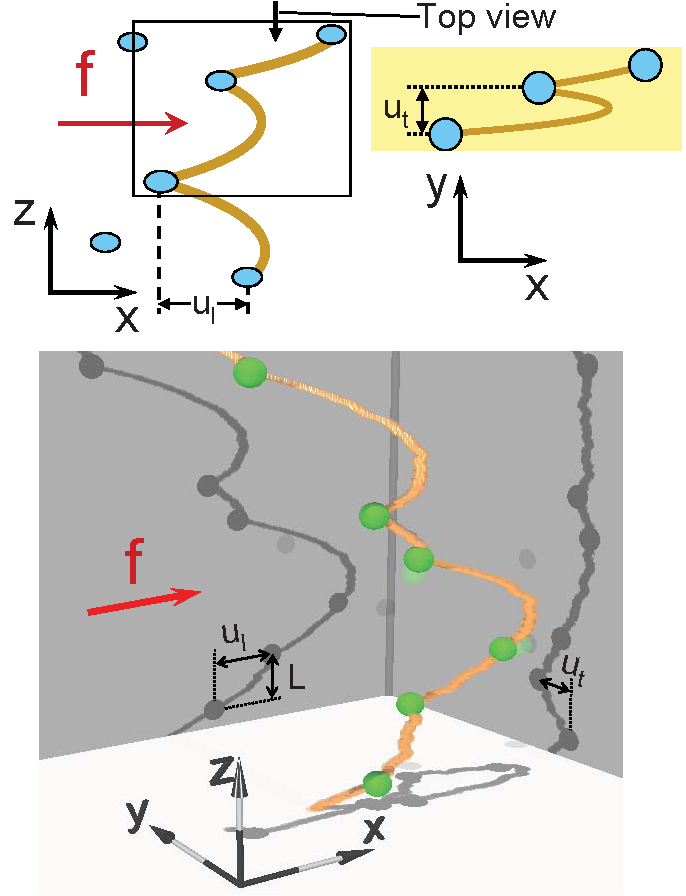
The equilibrium estimates for the trapping parameters (10) are definitely valid for the line configurations prepared by cooling at fixed field and at zero transport current. However, it is clear that they cannot be applied to the vortex lines in the critical state at low temperatures when moving lines are trapped after the driving force drops below the critical value and equilibration does not take place. The critical current in such a dynamic regime has been estimated in Ref. OvchinnIvlPRB91, for high fields when the intervortex interactions are essential. These estimates can be directly generalized to the trapping of individual vortex lines at small fields.BlatterPRL04 When the vortex line moves close to the pinning center, it may be trapped and the line remains trapped until the force acting from the pin on the vortex line does not exceed the pin-breaking force. In this regime two typical trapping distances, in the direction of motion, , and in the transverse direction, , are very different and have very different origins, see Fig. 2. These distances and the trapped-segment length are connected by the geometric relation
| (12) |
The longitudinal trapping distance, , is determined by the pin-breaking condition,
| (13) |
This condition can be obtained from the component of Eq. (7) assuming that the two terms on the right-hand side are of the order of the pin-breaking force.
The transverse displacement between the pins, , is determined by the trapping events. The simplest assumption is that in most cases trapping occurs when the lines directly collide with the pins BlatterPRL04 meaning that . This immediately gives estimates for other trapping parameters,
| (14) |
This corresponds to the following result for the critical current
| (15) |
Note that in this situation the estimate is somewhat similar to the result for the equilibrium case, Eq. (11), and has the same dependence on the pin density, . The physical assumptions behind the two estimates, however, are completely different.
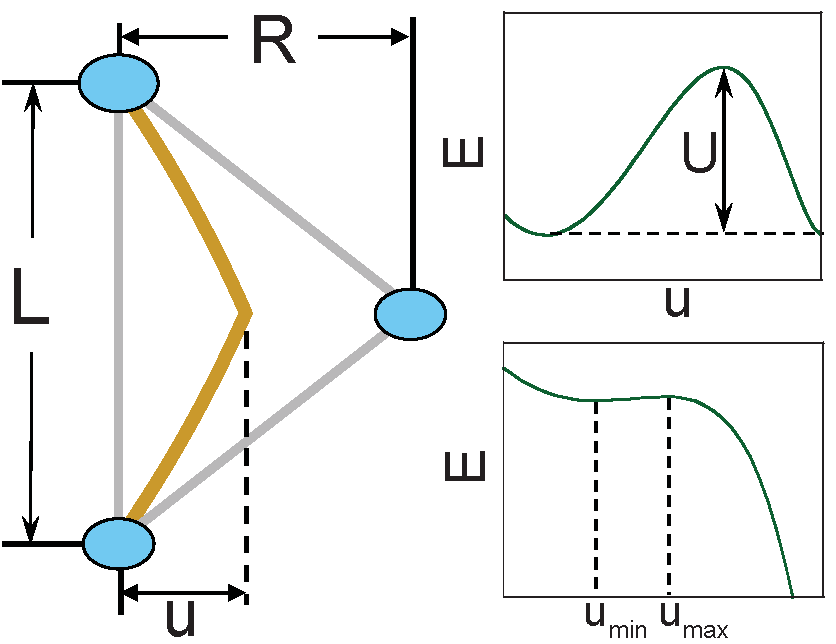
The above simple assumption, however, may underestimate . Due to the long-range pin-vortex interaction (4) a pinning center may capture the vortex line even without direct collisions. When the line passes sufficiently close to the pinning center it may be trapped by this center due to instability. To estimate the maximum transverse trapping distance , we consider the interaction energy of a segment of length with a pinning center located at a distance ,OvchinnIvlPRB91 see Fig. 3,
with . This gives the interaction force
Introducing the reduced variables
we rewrite the energy and force as
The equilibrium points are determined by
The instability point corresponds to the value of when the equilibrium points vanish which happens at . Therefore the condition for the instability can be written as
which determines the maximum trapping distance as
| (16) |
The vortex line will be trapped by the pinning centers located closer than this distance in the direction perpendicular to the driving force. Note that the numerical coefficient in this equation should not be taken too literally because it is only correct for the simplest geometry illustrated in Fig. 3. Using this result, we find from Eqs. (12) and (13)
| (17) | ||||
| (18) | ||||
| (19) |
This gives the following estimate for the critical current
| (20) |
Comparing this result with the critical current for the equilibrium regime (11), we can see that the two regimes are characterized by somewhat different dependences on the parameters. However, dependences on the pin density occur to be close, the exponent in the power law, in this dynamic-trapping regime is somewhat smaller than the power for the equilibrium regime, .
III.4 A typical pin-breaking force at finite temperatures
At finite temperatures the line moves at all driving forces but for small forces very slow motion occurs due to the rare thermally activated jumps (creep regime). The creep and flow regimes are separated by the effective critical force which can be evaluated using a velocity criterion. Such effective critical force is criterion dependent and thus differs from the sharply defined zero-temperature critical force of the depinning transition, but it has the advantage that it can be directly compared with experimental estimates. We do not consider creep in this paper and our purpose is to evaluate the suppression of this critical force by the thermal noise. The main mechanism of thermal suppression is reduction of the effective pin-breaking force. At finite temperatures the trapped vortex segment has a finite lifetime on the pin even if the pinning force is smaller than the maximum pin-breaking force. To quantify this effect, we can introduce the temperature-dependent force at which the trapped segments are typically released from pins.
To evaluate this force, we assume that the line motion in the crossover region consists of segment jumps, meaning that the average line velocity can be estimated as where is the typical time during which the vortex segment remains pinned and is the typical energy barrier for detrapping. When the force acting from the pin is only slightly smaller than the maximum pin-breaking force, the barrier behaves as in the single-particle case,SinglePartNote , where and is the second derivative of the interaction force with respect to the line displacement at the maximum-force point. The velocity criterion for the effective critical force can be written as where is the viscosity coefficient and . At low temperatures this gives us the following relation for
Using the estimate , the geometric relation (12) and assuming for simplicity that , we obtain
| (21) |
We expect that at low temperatures the effective critical force and trapping parameters can be roughly evaluated using the simple replacement .
IV Model for numerical simulations
To develop a quantitative understanding of the strong pinning by the array of inclusions, we numerically simulated motion of the vortex line described by the dynamic equation
| (22) |
Here is the driving force along the direction from the current, are the random pin coordinates, is the Langevin thermal force
and
is the interacting force with a strong pin. We model the interaction potential by the function
| (23) |
where the cutoff function is introduced for numerical convenience, for and for with . An important feature that was not taken into account in modeling before is the long tail in the interaction potential. However, this model does not describe the line-tension limited pin-breaking force. In our model the pin-breaking force from an isolated pin is given by which is achieved at . The model in its original form has an unrealistic feature. For improbable configurations when many pins are located at distances smaller than , the vortex interaction with such a cluster may increase without limit. This, of course, does not happen in real superconductors. To bring our model somewhat closer to reality, we renormalized the total pin-vortex interaction force as as
so that the maximum force cannot exceed . This modification has only a minor influence on the interaction of the vortex line with an isolated pin.
For numerical implementation of the model, we use the reduced variables
in which the equation takes the simpler form
| (24) |
with
In this dimensionless form, the equation depends only on the reduced temperature and reduced pin density . The condition of the strong pinning regime is corresponding to . For the typical parameters , nm, and nmcm-3, the reduced pin density can be estimated as . In simulations we mostly used . For an isolated pin this gives the pin-breaking force . We also used in the cutoff function . We consider systems of size , where is the vortex-line length, is the size in the direction of line motion, and the size in the transverse direction.
One of our tasks is to compute the dependence of the critical force on the density of the pinning centers. The calculation of the steady-state critical force is not as trivial problem as it may appear. For a finite-size system there is always a metastable configuration giving the maximum depinning force. Assuming that such a configuration is always reachable from any initial condition at long times, this would be the critical force we seek. In a large system this configuration is, however, determined by a rare, nontypical configuration of pins. As a consequence, the maximum depinning force slowly grows with the increasing the system sizes and , meaning that it is not a self-averaging parameter for a fixed line length . To avoid this, a carefully chosen (anisotropic) thermodynamic limit in all directions was proposed for dimensions RossoBolechPRL04 . The maximum depinning force of a very large system is also very difficult to compute. Simulations of Eq. (24) at zero temperature are not very suitable for this purpose, because when the external force is close to the critical value, the vortex line traps forever in the first metastable state it finds. It is not clear how representative this state is and how close the corresponding critical force is to the maximum value. In addition, neither the maximum critical force nor depinning forces for a few accidental metastable states are very interesting quantities from a practical point of view. The maximum critical force is essentially a property of an isolated vortex line. A more interesting quantity is the typical pinning force for the finite density of the vortex lines. Indeed, even at low densities when vortex-vortex interactions can be neglected, we expect a typical pinning force rather than an extreme non-self-averaging force value to determine the observable critical current.
To evaluate a typical pinning force at zero temperature, instead of the fixed-force approach, we employ fixed-velocity simulations using approach suggested in Ref. MovingParabola, . Namely, we replaced the fixed external force in Eq. (24) with a slowly moving parabolic potential,
| (25) |
Such a potential forces the vortex line to move with the average velocity . Every time the line finds a metastable pinned state and stops, the dragging force starts to increase with time until it exceeds the critical force for this state and the line resumes motion. This trick allows us to explore many metastable states and to avoid the extreme value statistics of the sample-dependent critical force. The typical critical force is then evaluated as the average force acting on the vortex line in the critical configurations,
| (26) |
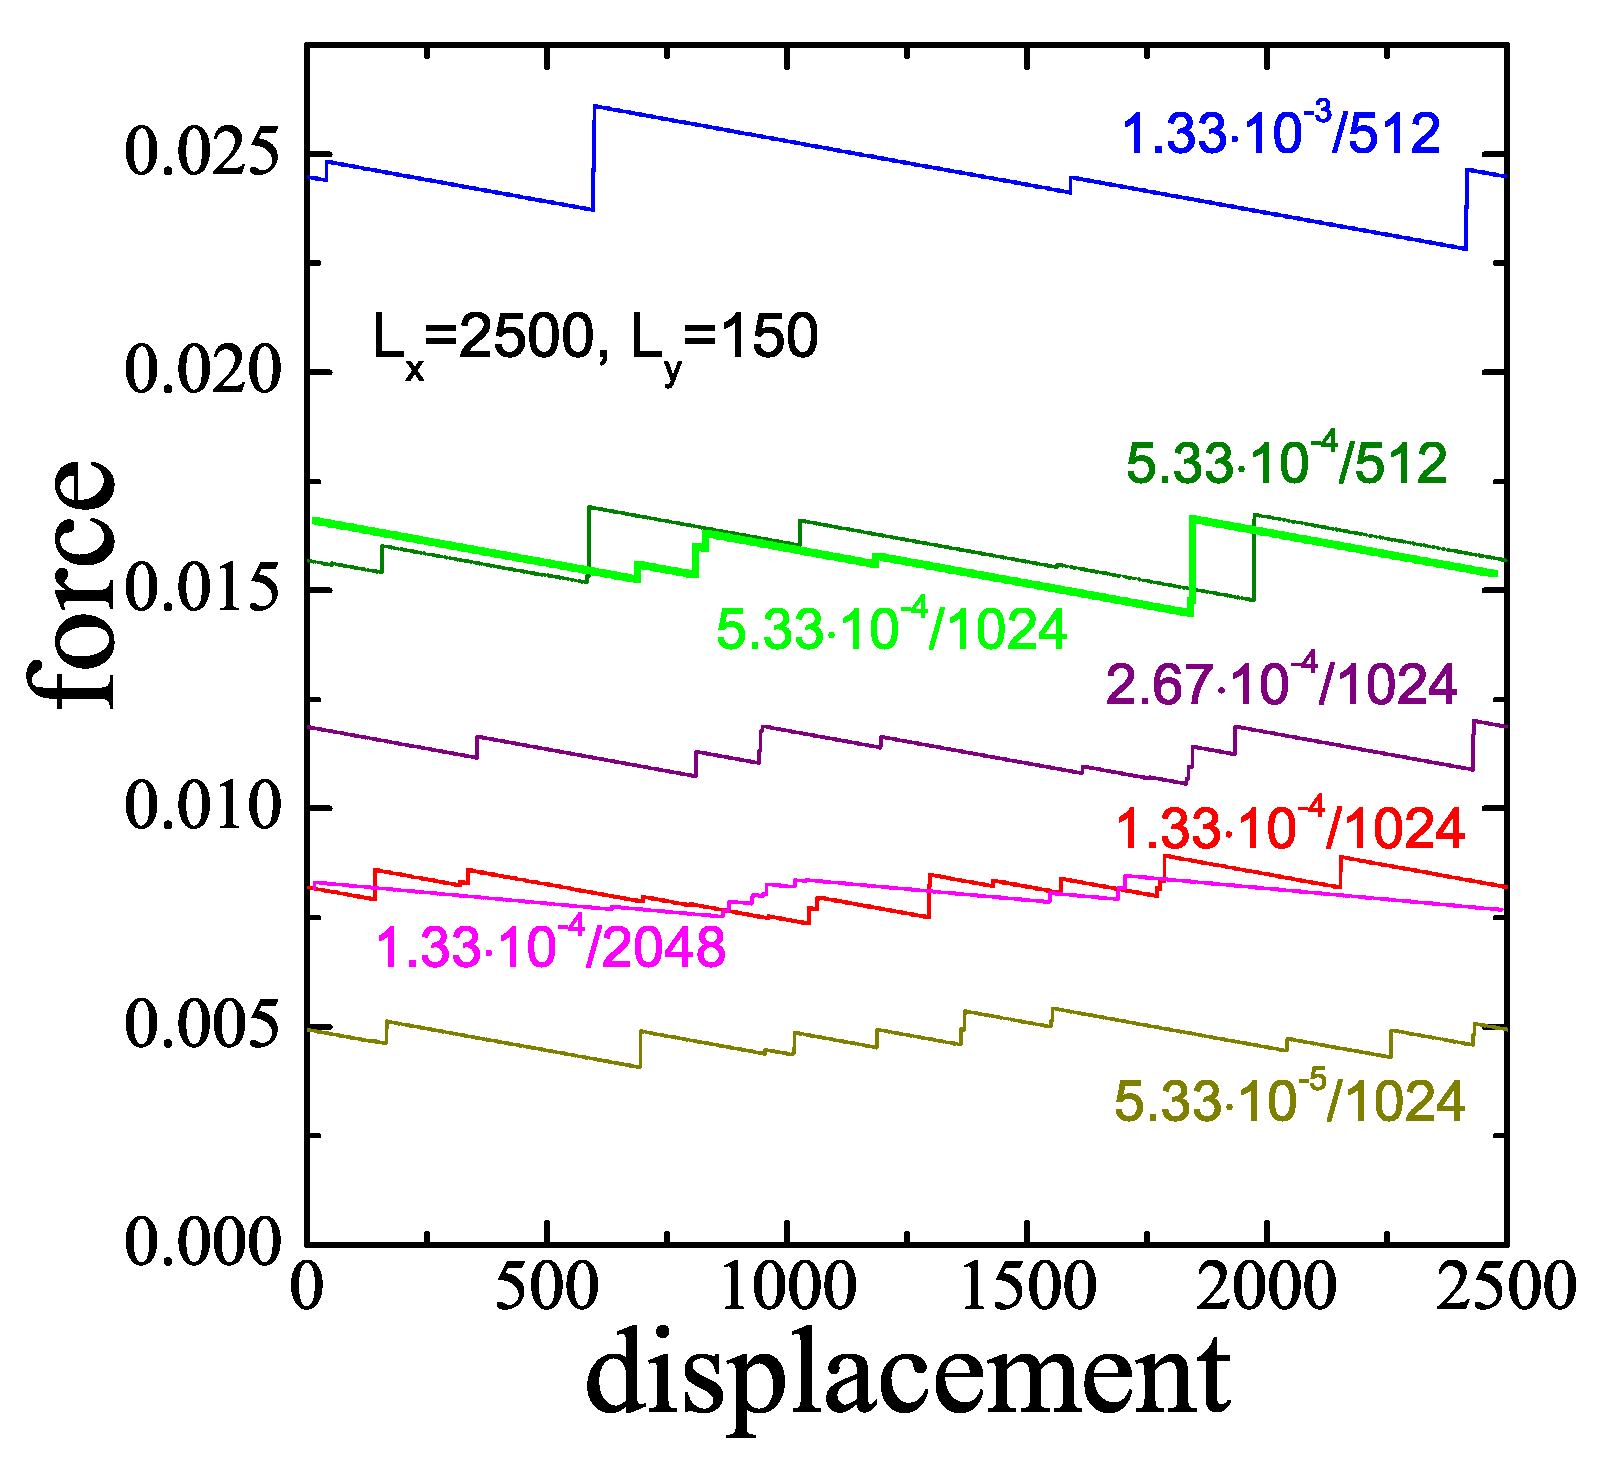
where implies averaging over the local maxima of the instantaneous force. The spring constant and the drag velocity have to be taken sufficiently small so that they do not influence the calculation of the critical force. We typically use and . The spring constants satisfy in each case, assuring a proper thermodynamic limit for the critical force and associated critical configuration MovingParabola , and the velocities are small enough to assure a quasistatic stick-slip motion. Figure 4(left) illustrates the typical dependences of the force acting on the line on the displacement of its center of mass for different pin densities and line lengths .
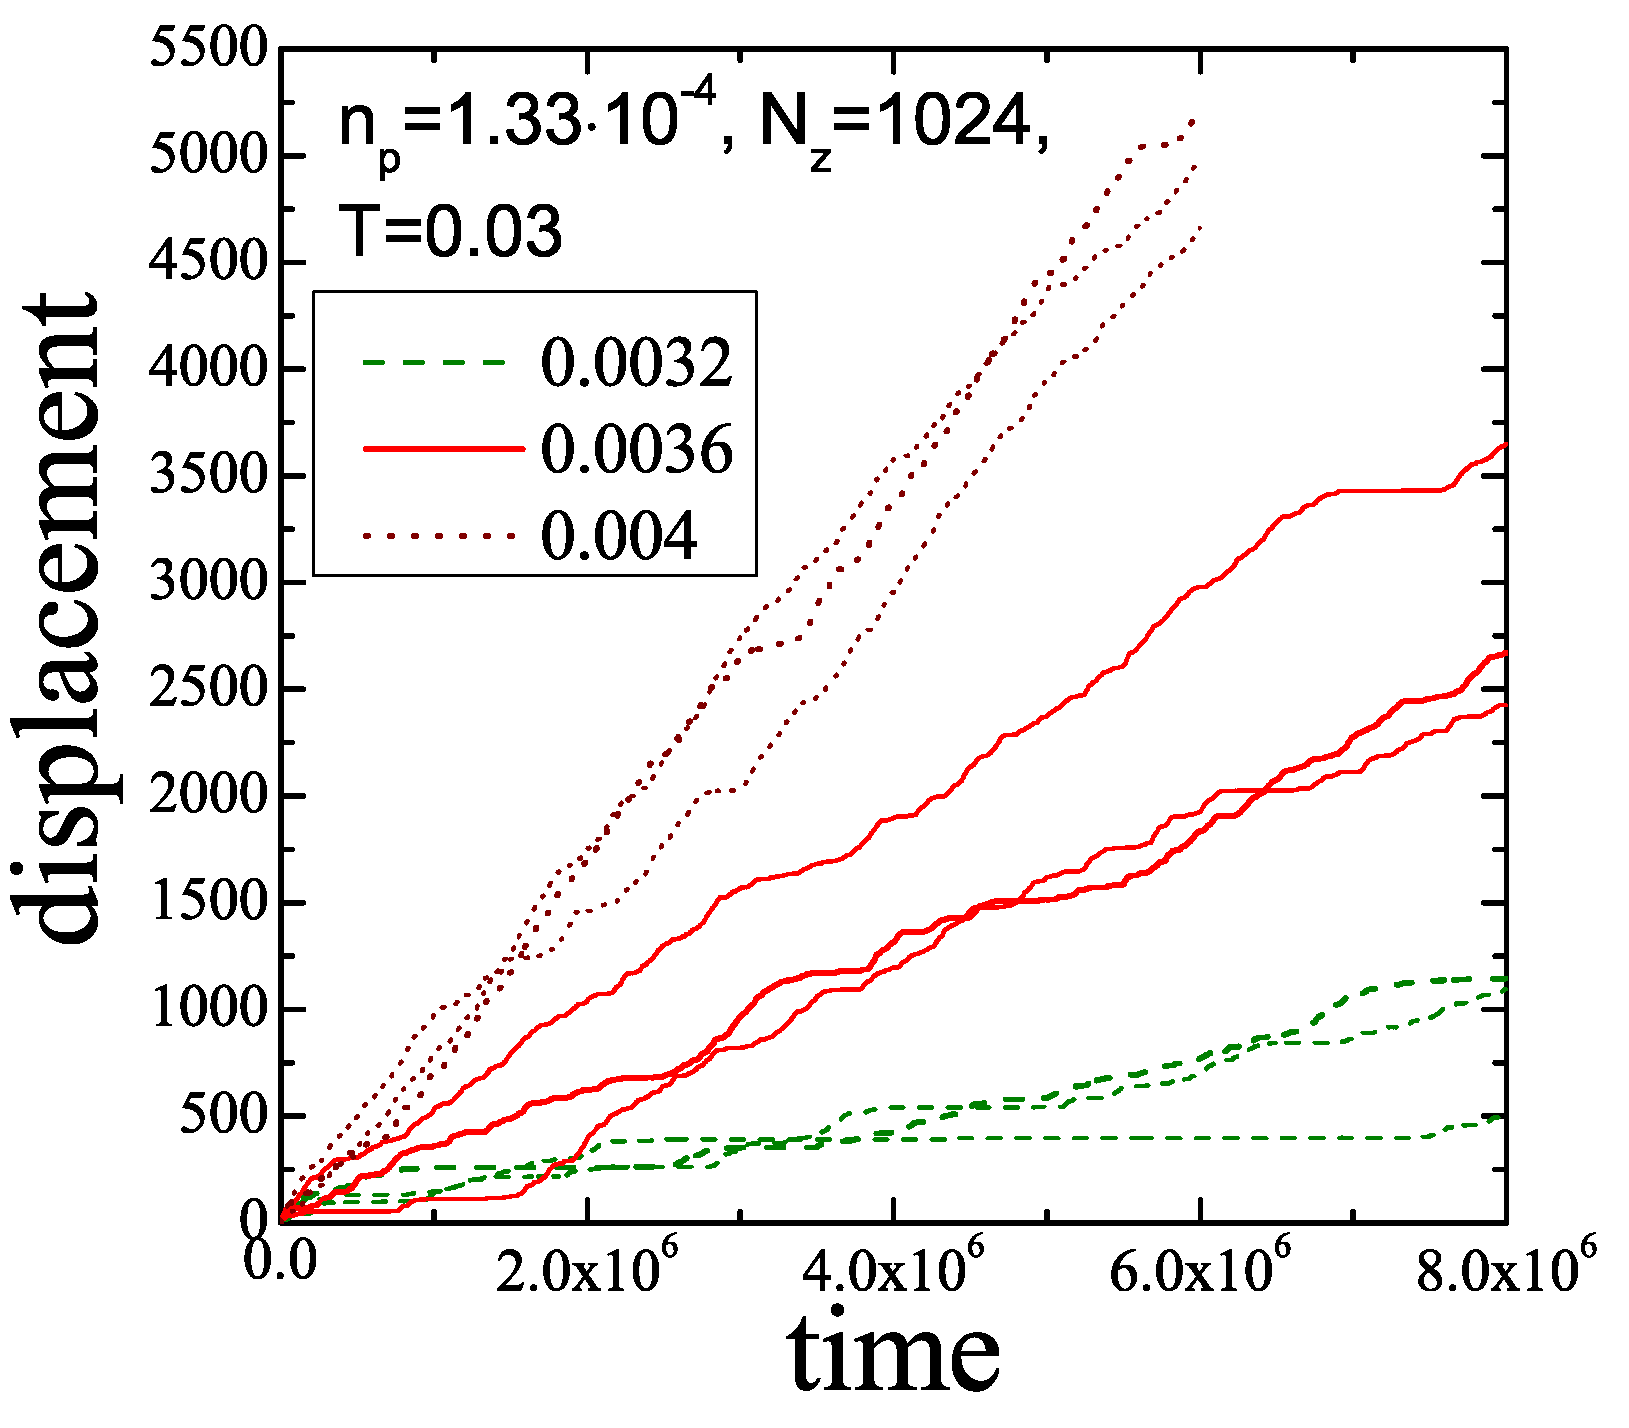
We also explore the velocity-force dependences at finite temperatures using the direct fixed-force simulations described by Eq. (24). Even though the term “critical force” is widely used in the experimental community, at finite temperatures the concept of the critical force does not have an exact meaning because the velocity is finite at all forces due to the thermal creep. Nevertheless, one can still introduce the characteristic force describing crossover between the flux-flow and flux-creep regimes using some average-velocity criterion. At low temperatures near such critical force the line motion becomes very uneven, see Fig. 4(right). It spends considerable time in metastable traps waiting for a strong fluctuation which allows it to continue motion. Such line motion is illustrated by animation.Animation As a consequence, a proper averaging over such events requires huge simulation times and/or averaging over many realizations of the random potential. In addition to the critical force, we explore statistical parameters of trapping which allow us to understand better the pinning mechanism. We evaluated the average length of a trapped segment and typical displacements along the motion direction and in the perpendicular direction . We studied the distribution of these parameters and their evolution with temperature and force. We also studied the long-range wandering of the line in the direction of motion and in the transverse direction.
For a numerical solution the reduced equation (24) has to be discretized both in time and in the coordinate. We typically used and for the discretization steps. To study finite-size effects, the equation was solved for different numbers of -axis slices, , ranging from 512 to 2048.
V Numerical results
V.1 Behavior at zero temperature
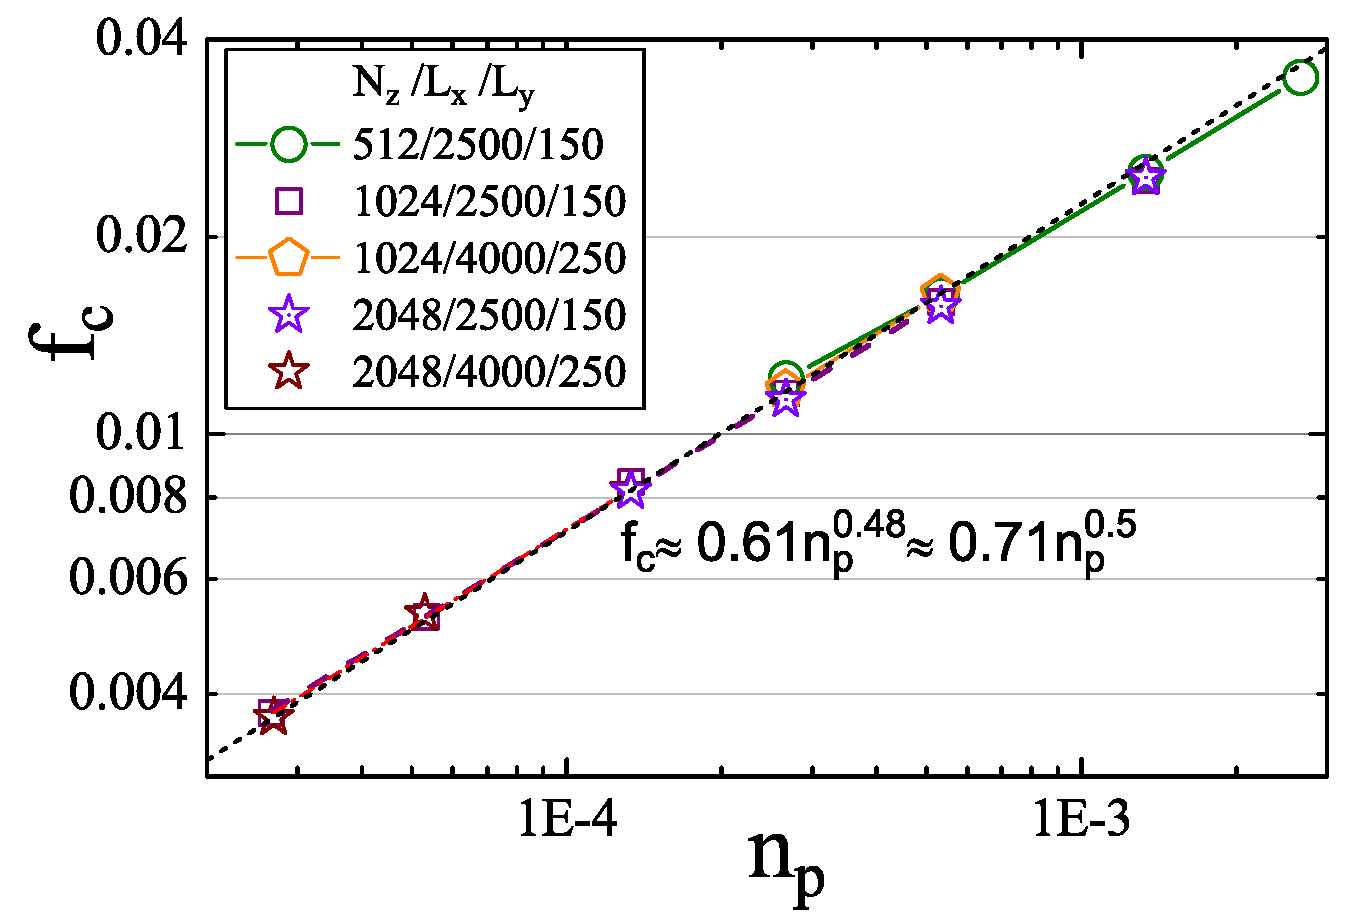
We systematically studied the behavior of the critical force and the properties of trapped line configurations within a pin-density range spanning two orders of magnitude, from to . Figure 5 presents the dependences of the critical force on the pin density for different systems sizes . We found that increases with according to the power law . The fit gives for the power index a value slightly smaller than 1/2, and the coefficient . In fact, the square-root dependence also provides a reasonable description of the data. The power is, however, clearly larger than the value suggested by the dynamic-trapping estimates in the case when trapping occurs due to instabilities. For the used line lengths a noticeable finite-size effect becomes visible only for small pin densities .
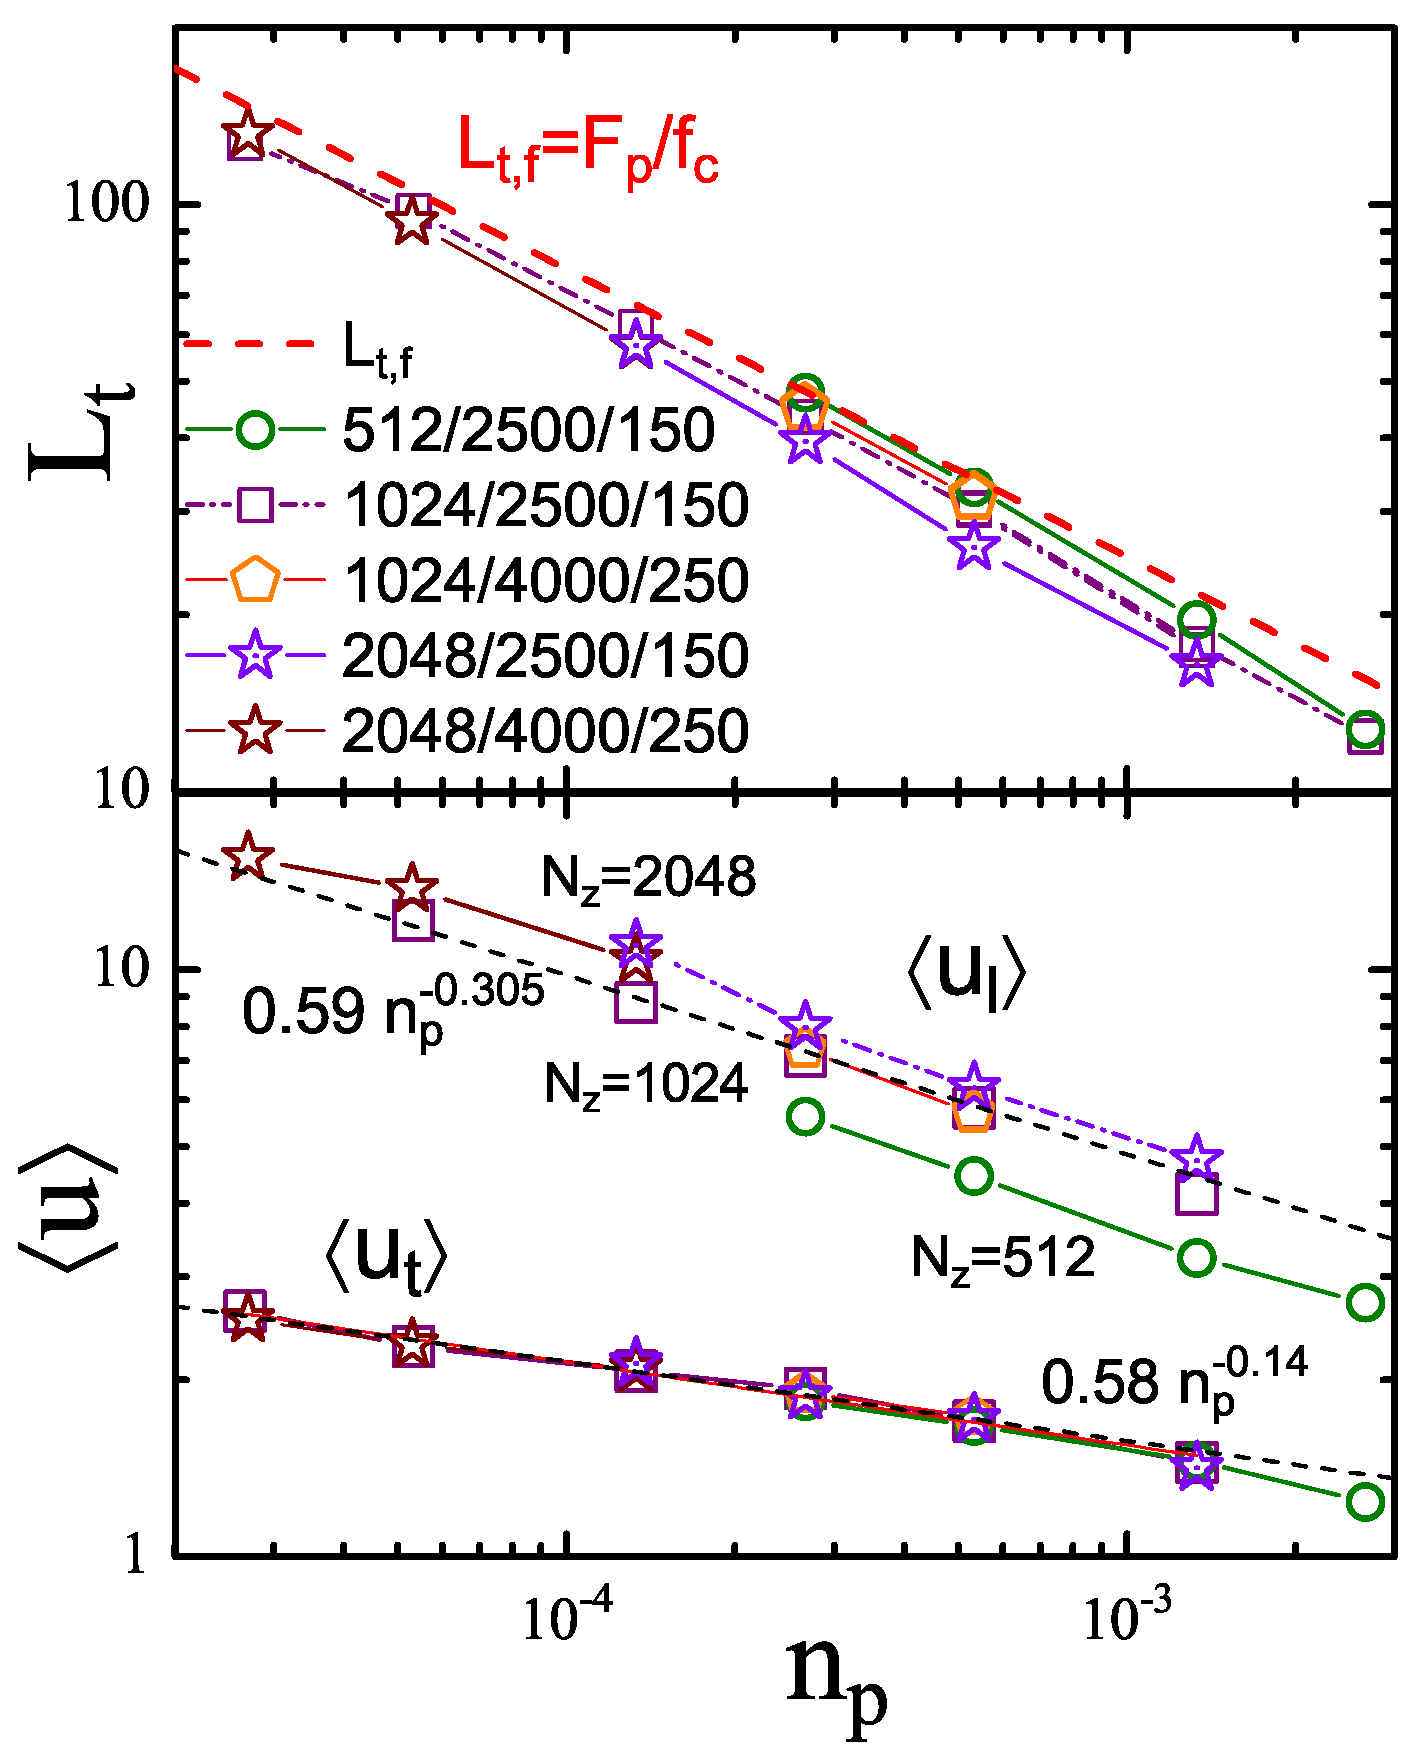
To understand the statistical properties of trapped configurations, we plot in Fig. 6 the pin-density dependences of the average trapping parameters defined in Fig. 2, the trapping length , and the pin-to-pin displacements along the direction of force, , and in the transverse direction, . In the plot we show the expected value of the typical trapped segment extracted from the value of the critical force . We can see that the real trapping segments extracted from the configurations indeed closely follow the expected values. We also see that the average trapping segments are systematically smaller than the segments which determine the critical force. This is a natural behavior because one can expect that the critical force is determined by “weak spots” where the trapping segments are longer than average along the line. The difference, however, is not very significant. The trapping length shows a weak but unexpected size effect, it slightly decreases with increasing total line length. We found that the product , which on general ground is expected to be of the order of unity is, in fact, slowly decreases with from to .
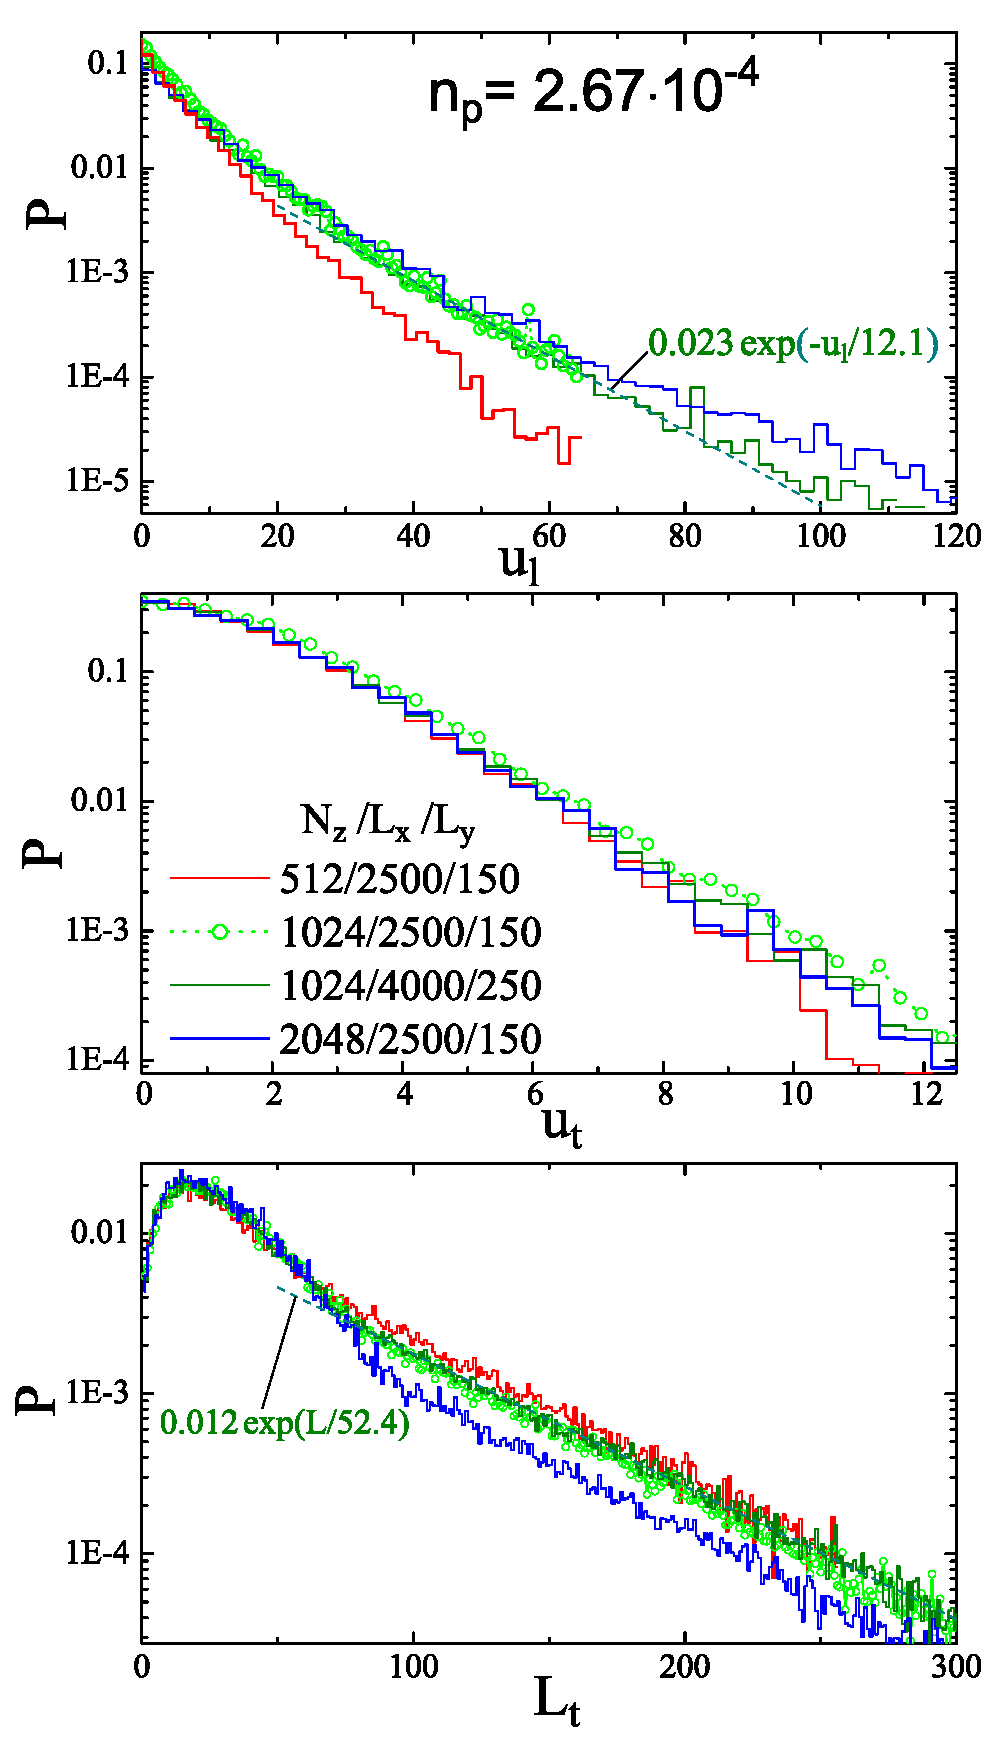
From the plots of the pin-to-pin displacements, we can see that the pinned configurations are strongly anisotropic, the average displacement along the direction of the driving force significantly exceeds the displacement in the transverse direction . This is consistent with the dynamic-trapping picture described in Sec. III.3. The difference grows with decreasing pin density . In addition, the longitudinal displacement shows a significant size effect, it grows with an increasing system size . Further analysis shows that this is an indication of growing local stresses with increasing line length and suggests the destruction of the vortex lines by the pinning potential in the critical state for sufficiently large systems. This behavior is not anticipated by the simple estimates. It is interesting to note, however, that this size effect in does not lead to a significant size dependence of the critical force. On the other hand, the average transverse displacement does not show any size effect. It slowly grows with decreasing from 1.24 at to 2.54 at . As remains comparable with the defect size, the regime in which the transverse trapping is determined by the long tail of the pin-vortex interaction is not quite realized. This explains why the power index in the forcepin-density dependence is larger than suggested by the metastable-regime estimates which assume . To obtain further insight into the properties of trapped lines we show in Fig. 7 examples of the distribution functions of trapping parameters for A fixed density and different system sizes. One can see that these distributions are characterized by long exponential tails. There is a noticeable probability to find segments with very large and . Note that the tails have opposite size effects for these parameters, the probability to find a large increases with while the probability to find a large decreases with . The last trend is opposite to naive expectations.
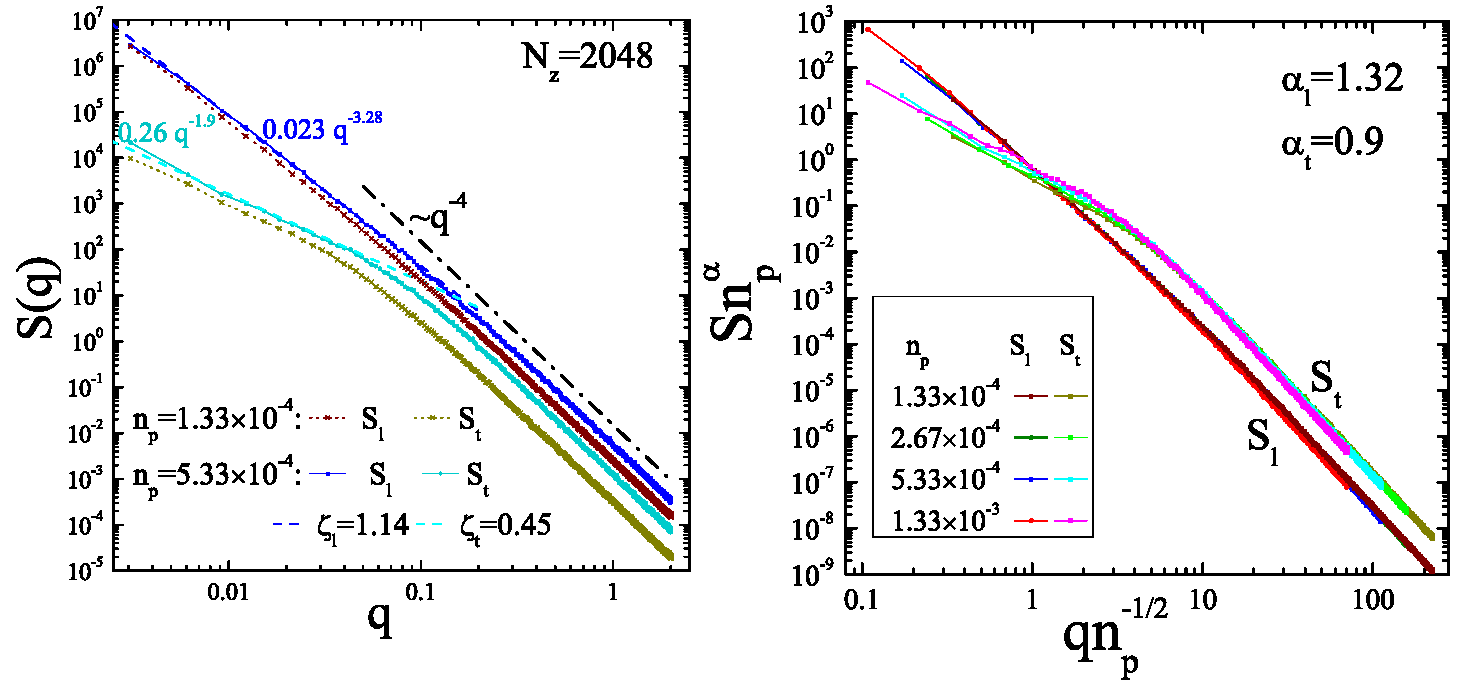
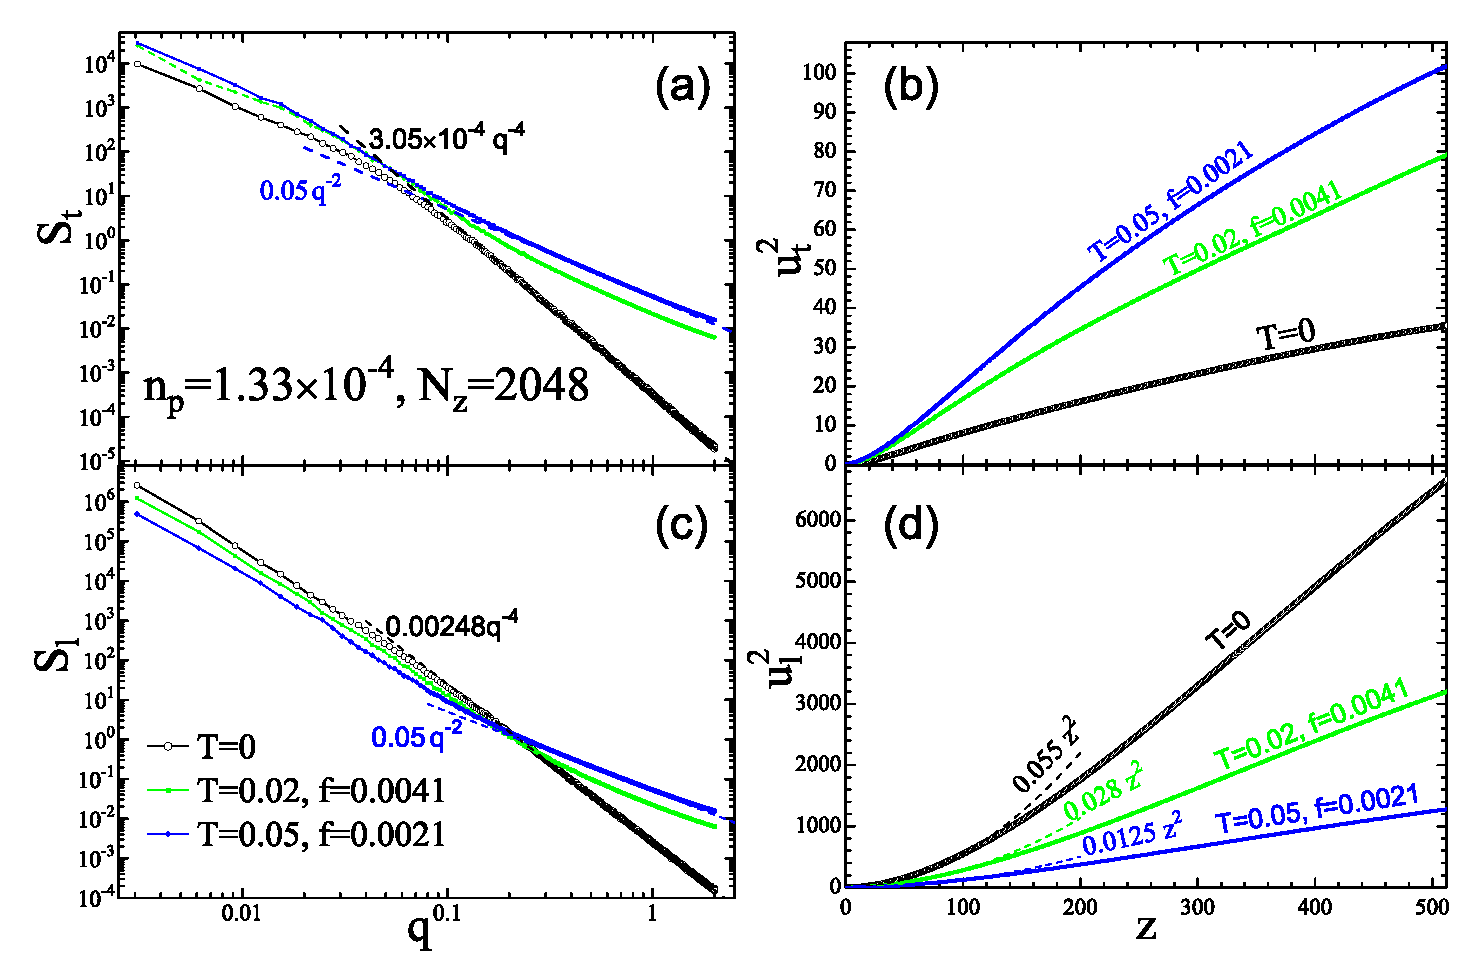
To characterize the long-range displacements of the line, we studied behavior of the structure factors, the Fourier transforms of the displacement correlation functions,
| (27) |
Examples of these quantities are presented in Fig. 8 (left) for two pin densities. Similar to local quantities, the long-range displacements are also strongly anisotropic. Such anisotropic scaling of the displacements is a general property of the driven lines in the critical regime independent of the pinning mechanism.ErtasKardarPRB For both components we clearly observe two regions of characterized by different power-law dependences . For the smallest ’s we found the roughness exponents and . The value of for the transverse direction corresponds to the line displacements increasing as at large . On the other hand, the value of found for the longitudinal displacements implies that the assumed elastic approximation is not self-consistent in the thermodynamic limit, the average local stress increases with the line length as . In this case the longitudinal line displacements grow quadratically with the coefficient increasing with the line length as .LeschhornTangComment93 This provides a natural explanation for the strong size dependence of the longitudinal pin-to-pin displacement in the lower plot of Fig. 6. The negative size effects for the trapping lengths in the upper plot of the same figure can also be understood. Growing local stress with increasing forces the line to travel longer distances in the longitudinal direction which increases the probability of finding a pin separated by a smaller distance in the direction.
The found exponents are slightly different from the values and obtained in Ref. ErtasKardarPRB, from the approximate functional renormalization group calculations. However, a similar situation was found for elastic lines in a plane where the numerically computed index RossoPRE03 ; 2Dline also exceed the predicted value 2DzetaTheory . We see that the transverse displacements somewhat reduce the exponent value in the 3D case. Since the small- exponents are expected to be universal, i.e., independent of the pinning mechanism, our results suggest that the elastic description will also break down for the weak pinning case. Although we have considered the linear approximation for the elastic forces, this conclusion is expected to hold for the full non-quadratic energy of the deformed vortex line.RossoPRE03
At larger ’s we observe the regime where both components behave as giving the short-scale indices . This corresponds to displacements induced by a short-range-correlated random force, and such behavior is actually similar to the static Larkin regime for weak pinning. However, the random forces in our case clearly have a very different origin.
The crossover between different regimes occurs at a wave vector that scales approximately as . This allows us to approximately collapse the structure factors at different pin densities into a single curve using the scaling . We found and . These scaled dependencies are shown on the right-hand side of Fig. 8. Scaling works better for the longitudinal structure factor. This scaling is consistent with the identification of the trapping parameter as a geometric crossover length at , between a short-distance roughness regime with exponents and a large-distance universal regime with exponents and . This behavior is again very similar to the crossover between the Larkin regime and the random-manifold regime established for the case of weak collective pinning even though disorder is not weak in the present case.
We can also see from Fig. 8(left) that both structure factors increase with the pin density for all wave vectors. This means that, in contrast to elemental pin-to-pin displacements plotted in Fig. 6, the line displacements at fixed grow with increasing pin density. This behavior can be easily understood. The displacements at small distances are determined not only by the behavior of but also by the behavior of the trapping length . All these parameters decrease with increasing pin density, meaning that smaller displacements occur on a smaller length scale. The net increase of the line displacements at fixed coordinate with increasing is a consequence of a faster decrease than that of , as can be seen from Fig. 6.
V.2 Dynamics at finite temperatures
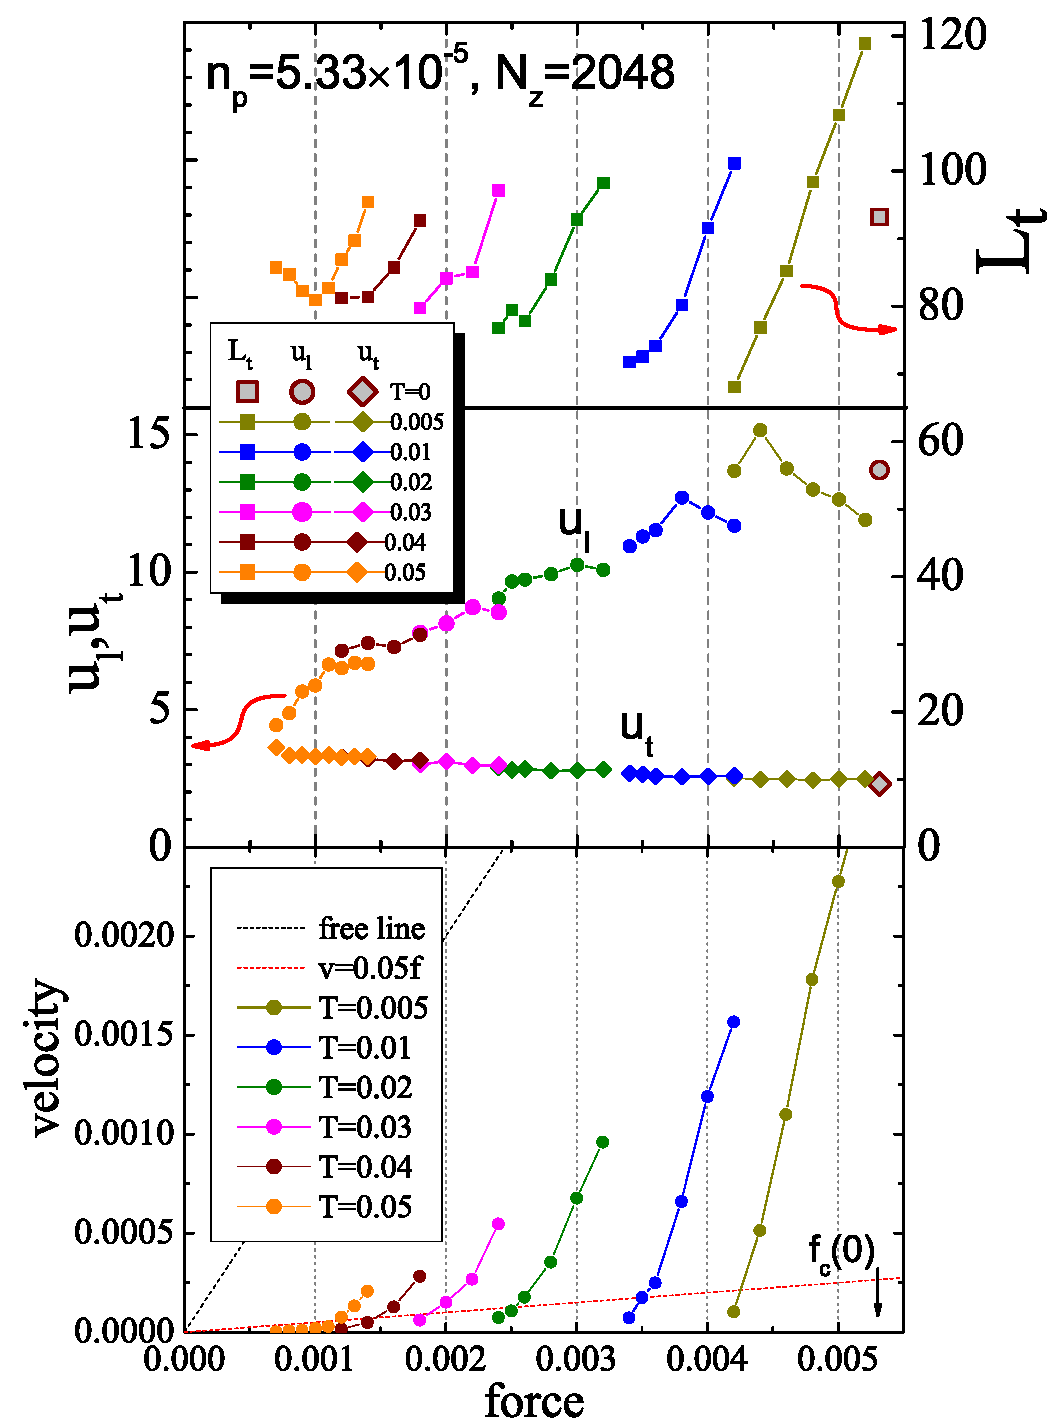
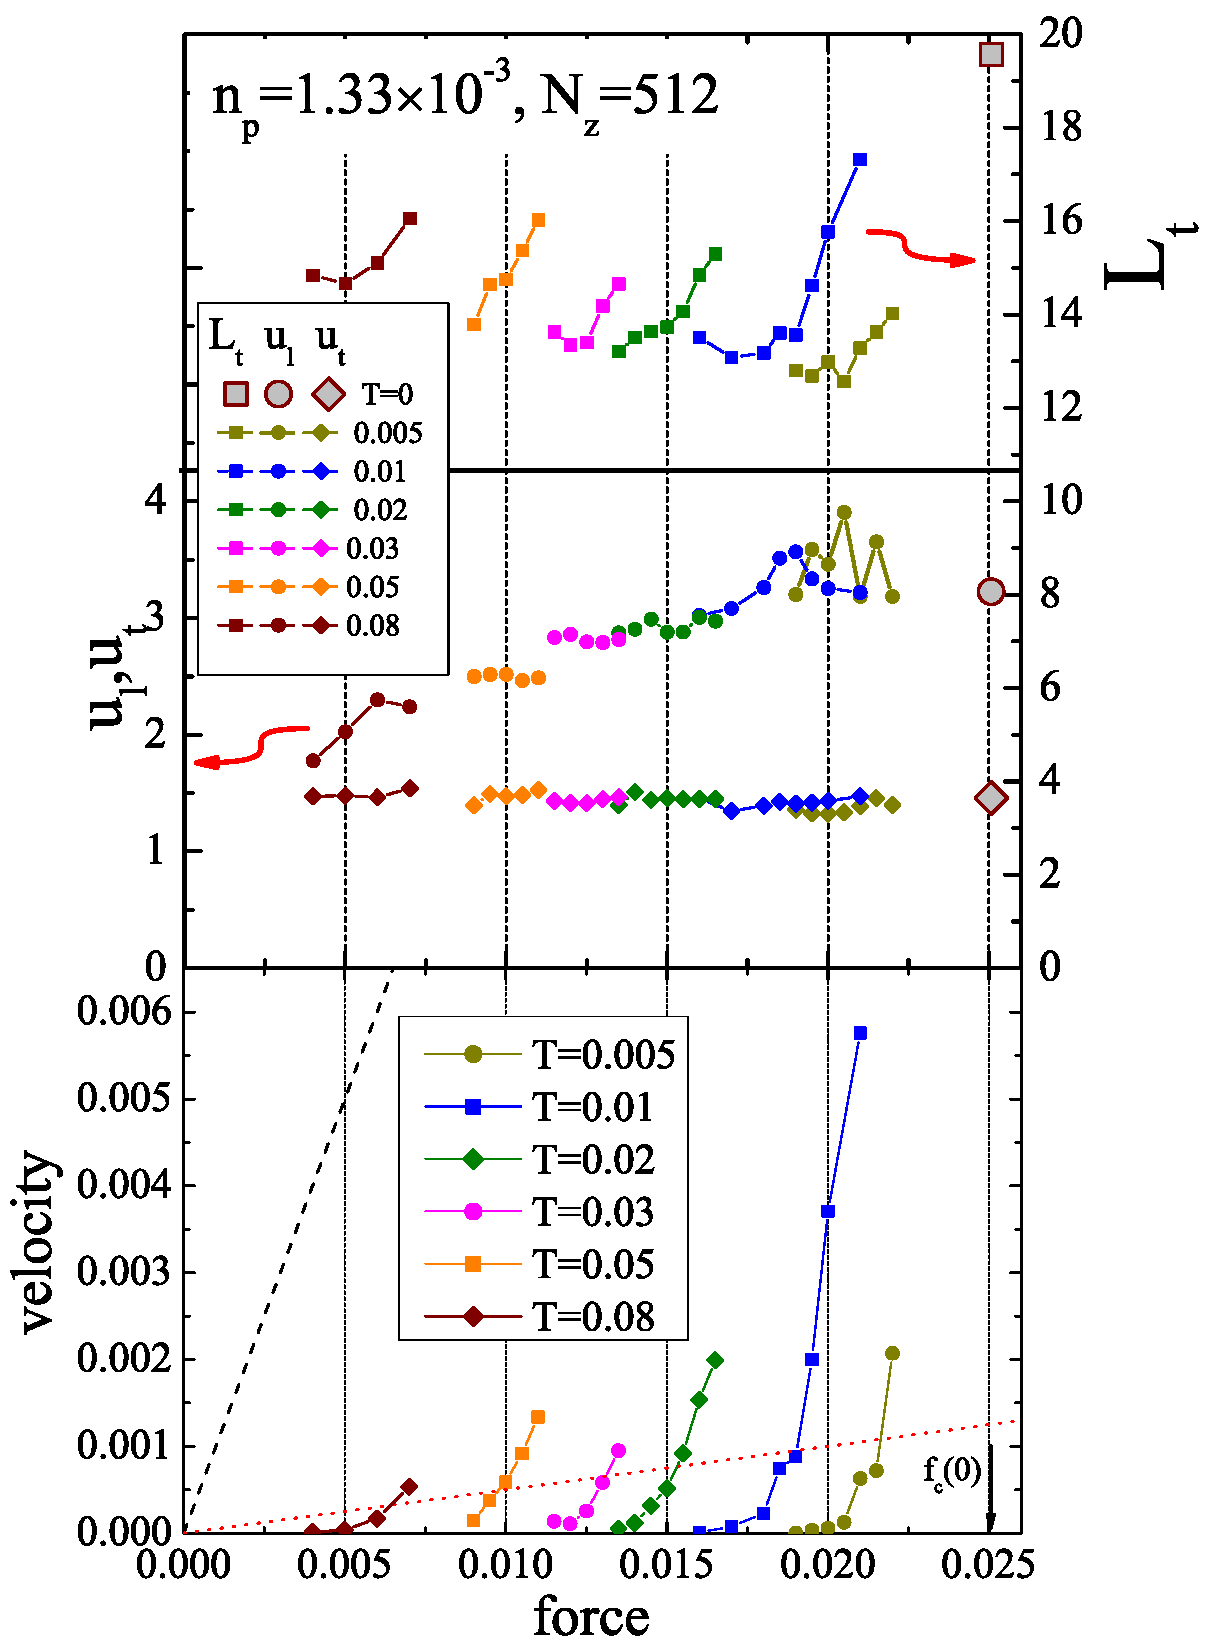
In this section we consider the influence of thermal noise on the dynamic response and configurations of vortex lines interacting with strong pins. Figure 9 presents the temperature evolution of the velocity-force dependences and trapping parameters in the critical region for two very different pin densities, and . We remind that we use the pinning energy of a single pin as the temperature unit. At finite temperatures the critical force does not have an exact meaning, because the line velocity is finite at all forces due to the thermal creep. Nevertheless, we can introduce a typical force corresponding to the crossover between the flow and creep regimes, similar to the voltage criterion widely used in experiment. We use the criterion for this force. The first important observation is that, independently of criterion, the apparent critical force is quite strongly suppressed by the thermal noise. For example, as we can see in Fig. 9, for the small pin density at the temperature only 5% of the pinning energy, the apparent critical force is already suppressed about fourfold. As one can see from the trapping-parameter plots, the longitudinal pin-to-pin displacement in the critical region very rapidly decreases with the temperature while the transverse displacement slightly increases with the temperature. As a consequence, at some temperature they become of the same order. The longitudinal displacement typically has a nonmonotonic dependence on the driving force and reaches a maximum at some force in the critical region (the maximum-stress force). The trapping length decreases with decreasing line velocity and its value at slightly increases with the temperature.
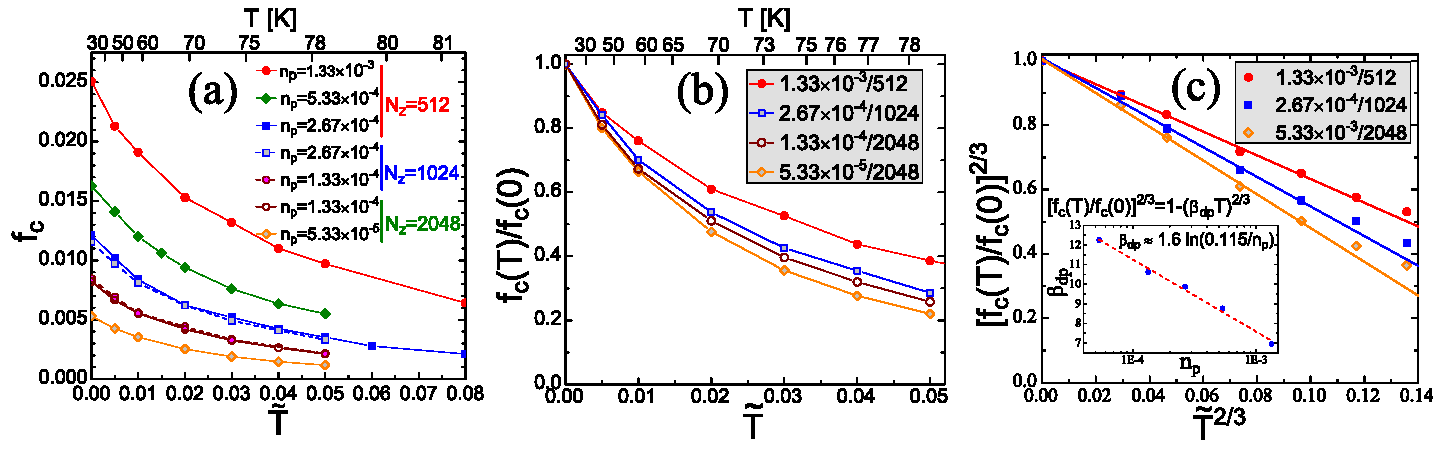
Figure 10(a) shows the temperature dependences of the apparent critical forces for a wide range of pin densities. We can see that these dependences are quite similar. However, plots of the relative critical forces in Fig. 10(b) clearly show that thermal suppression weakens with increasing pin density. This is consistent with the estimate for the temperature renormalization of the effective pin-breaking force, Eq. (21), due to the dependence under the logarithm. For illustration, we also present the real-temperature scales on the top axes of the plots in Fig. 10(a,b) computed for spherical particles with nm and typical YBCO parameters. This scale, however, is very sensitive to the value of . For example, the liquid nitrogen temperature K corresponds to the reduced temperature in the plot. For particles with nm the same real temperature would correspond to the much smaller value .
As we found approximately at , according to the estimate of Eq. (15) we also expect the relation . This means that, according to Eq. (21), we expect the dependence with . This is directly verified in Fig. 10(c) where we observe the approximate linear dependencies of versus . Moreover, as shown in the inset, the coefficient found from the linear fits for different pin densities indeed has a logarithmic dependence on , . These observations provide justification for our assumption that the reduction of the typical pin-breaking force is the main source of thermal suppression of the effective critical force.
We consider now the influence of thermal noise on the long-range behavior of the line displacements. Figures 11(a,c) present the evolution of the structure factor with increasing temperature for the pin density . We can see that the slope of the small- dependences does not change indicating that the roughening indices and are temperature independent. However, the coefficient is significantly reduced for the longitudinal displacements and is enlarged for the transverse displacements. Correspondingly, as one can see from the line wandering plots shown in Fig. 11(b,d), the components of displacements in the critical region have opposite tendencies: the longitudinal displacements decrease and the transverse displacements increase with increasing temperature. As the longitudinal displacements dominate, the lines become more straight in the critical region. Another important observation is that the random-force regime at large is rapidly washed out by thermal noise for both components and is replaced by the isotropic fluctuational line wandering .
VI Discussion and comparison with experiment
Using the square-root fit of the pin-density dependence of critical force in Fig. 5, we can restore the dependence of the critical force in real units
| (28) |
This coincides with the estimate (15) which is obtained assuming that the transverse trapping distance is on the order of the pin size . This does not contradict too much our numerical results, because our average values of only slightly exceed the pin size. Note that in our simulations the pin-breaking force is fixed by interaction with the pin while in real superconductors for large-size inclusions it is determined by the in-plane line energy, see Eq. (3). Substituting this estimate, our result leads to the following estimate for the critical force
where, assuming , we estimated .
For preliminary comparison with experiment we use results of the recent paper PolatPRB11, in which approximately spherical (Y-Gd)2O3 particles with radii nm were embedded into the YBCO films. The typical concentration of particles was cm-3. For estimates, we assume the temperature-dependent London penetration depth as nm with K and the anisotropy . Such parameters correspond to the reduced concentration . From the above zero-temperature result, we estimate and the critical current amp/cm2 which is close to the low-field experimental value at K, amp/cm2. The reduced temperature can be evaluated as . At 55 K this gives . According to Fig. 10(b), at this temperature thermal suppression of the critical current is expected to be around 50%. Taking this factor and the temperature dependence of the parameters into account, we expect a critical current amp/cm2, which again is quite close to the experimental value of amp/cm2. We can conclude that the our strong-pinning result for the critical current is in reasonable agreement with experiment.
Our results show that the wandering of dynamically pinned lines is strongly anisotropic, displacements in the direction of motion are much larger than displacements in the transverse direction. In principle, experimentally this can be directly demonstrated using flux visualization techniques, such as a scanning SQUID or Hall probes. With these techniques individual vortices can only be resolved at small fields. Usually statically pinned vortices are visualized after cooling in fixed magnetic field. Nevertheless, it should also be possible to visualize shapes of the dynamically-pinned vortices near the boundary of the Bean profile, which is formed when the magnetic field is applied after cooling of a superconducting sample in zero field. We expect the vortex field profiles to be strongly elongated along the direction of motion. The elongation length along the direction of motion is given by the longitudinal displacement at a distance on the order of the London penetration depth. This length is expected to decrease with increasing temperature.
In conclusion, we developed a quantitative description of individual vortex lines pinned by an array of nanoparticles. We found that the critical force grows roughly as the square root of the pin density. This result is consistent with qualitative estimates assuming that for our pin-density range trapping events mostly occur as a result of direct collisions with pinning centers. The apparent critical force is strongly suppressed by thermal noise. The relative suppression reduces with increasing pin density. The configurations of pinned lines are strongly anisotropic, displacements in the drive directions are much larger than those in the transverse direction. The displacement anisotropy is rapidly reduced by thermal noise mostly due to the rapid reduction of the longitudinal displacements. This leads to straightening of the lines in the critical region. Analyzing the behavior of the structure factors at small wave vectors, we found that the roughening index for the longitudinal displacements exceeds one. This means that the local stresses in the critical region increase with the line length indicating a breakdown of the elastic description in the thermodynamic limit. The behavior of the structure factor at large wave vectors for both directions is typical for the displacement induced by random force. At finite temperatures this random-force regime is rapidly replaced by the thermal displacements.
Acknowledgements.
The authors would like to thank J. R. Thompson for very helpful discussions and for providing unpublished parameters of the films studied in Ref. PolatPRB11, . The authors also acknowledge useful discussions with D. K. Christen, L. Civale, and V. B. Geshkenbein. A.E.K. was supported by UChicago Argonne, LLC, operator of Argonne National Laboratory, a U.S. Department of Energy Office of Science laboratory, operated under contract No. DE-AC02-06CH11357. This work was also supported by the “Center for Emergent Superconductivity”, an Energy Frontier Research Center funded by the U.S. Department of Energy, Office of Science, Office of Basic Energy Sciences under Award Number DE-AC0298CH1088. A.B.K acknowledges hospitality at Argonne National Laboratory and the support from CNEA, CONICET under Grant No. PIP11220090100051, and ANPCYT under Grant No. PICT2007886.References
- (1) L. Civale, B. Maiorov, A. Serquis, J. O. Willis, J. Y. Coulter, H. Wang, Q. X. Jia, P. N. Arendt, J. L. MacManus-Driscoll, M. P. Maley, and S. R. Foltyn, Appl. Phys.Lett., 84, 2121(2004).
- (2) T. Haugan, P. N. Barnes, R. Wheeler, F. Meisenkothen, and M. Sumption, Nature 430, 867 (2004).
- (3) X. Song, Zh. Chen, Sang-II Kim, D. M. Feldmann, D. Larbalestier, J. Reeves, Y. Xie, and V. Selvamanickam, Appl. Phys. Lett. 88, 212508 (2006).
- (4) J. Gutiérrez, A. Llordés, J. Gázquez, M. Gibert, N. Romà, S. Ricart, A. Pomar, F. Sandiumenge, N. Mestres, T. Puig, and X. Obradors, Nature Materials 6, 367 (2007); J. Gutierrez, T. Puig, and X. Obradors, Appl. Phys. Lett. 90, 162514 (2007).
- (5) H. Yamasaki, K. Ohki, H. Yamada, Y. Nakagawa and Y. Mawatari, Supercond. Sci. Technol. 21, 125011 (2008).
- (6) M. Miura, B. Maiorov, S. A. Baily, N. Haberkorn, J. O. Willis, K. Marken, T. Izumi, Y. Shiohara, and L. Civale, Phys. Rev. B 83, 184519 (2011).
- (7) Ö. Polat, J. W. Sinclair, Y. L. Zuev, J. R. Thompson, D. K. Christen, S. W. Cook, D. Kumar, Yimin Chen, and V. Selvamanickam, Phys. Rev. B 84, 024519 (2011). The concentration of (Y-Gd)2O3 precipitates in the studied (Gd-Y)Ba2Cu3O7 films was cm-3 and the low-field critical current for 2.8 m-thick film was amp/cm2 at 5K and amp/cm2 at 55k (private communication from J. R. Thompson, C. Cantoni, Ö. Polat, and D. K. Christen).
- (8) J. L. MacManus-Driscoll, S. R. Foltyn, Q. X. Jia, H. Wang, A. Serquis, L. Civale, B. Maiorov, M. E. Hawley, M. P. Maley, and D. E. Peterson, Nature Materials 3, 439 (2004); B. Maiorov, S. A. Baily, H. Zhou, O. Ugurlu, J. A. Kennison, P. C. Dowden, T. G. Holesinger, S. R. Foltyn and L. Civale, Nature Materials 8, 398 (2009).
- (9) S. Kang, A. Goyal, J. Li, A. A. Gapud, P. M. Martin, L. Heatherly, J. R. Thompson, D. K. Christen, F. A. List, M. Paranthaman, D. F. Lee, Science 311, 1911 (2006).
- (10) C. V. Varanasi, P. N. Barnes, and J. Burke, Supercond. Sci. Technol. 20, 1071 (2007); C. V. Varanasi, J. Burke, L. Brunke, H. Wang, M. Sumption, and P. N. Barnes, J. Appl. Phys. 102, 063909 (2007); C.V. Varanasi, J. Burke, and L. Brunke, H. Wang, J.H. Lee, and P.N. Barnes, J. Mater. Res., 23, 3363 (2008); C. V. Varanasi, J. Burke, H. Wang, J. H. Lee, and P. N. Barnes, Appl. Phys. Lett. 93, 092501 (2008).
- (11) Yu. N. Ovchinnikov and B. I. Ivlev, Phys. Rev. B 43, 8024 (1991).
- (12) C. J. van der Beek, M. Konczykowski, A. Abal’oshev, I. Abal’osheva, P. Gierlowski, S. J. Lewandowski, M. V. Indenbom, and S. Barbanera, Phys. Rev. B 66, 024523 (2002).
- (13) A. O. Ijaduola, J. R. Thompson, R. Feenstra, D. K. Christen, A. A. Gapud, and X. Song, Phys. Rev. B 73, 134502 (2006).
- (14) C. J. van der Beek, G. Rizza, M. Konczykowski, P. Fertey, I. Monnet, Th. Klein, R. Okazaki, M. Ishikado, H. Kito, A. Iyo, H. Eisaki, S. Shamoto, M. E. Tillman, S. L. Bud ko, P. C. Canfield, T. Shibauchi, and Y. Matsuda, Phys. Rev. B 81, 174517 (2010); C. J. van der Beek, M. Konczykowski, Sh. Kasahara, T. Terashima, R. Okazaki, T. Shibauchi, and Y. Matsuda, Phys. Rev. Lett. 105, 267002 (2010).
- (15) This formula is valid only for the case . When is comparable with , interpolation should be used.
- (16) E. W. J. Straver, J. E. Hoffman, O. M. Auslaender, D. Rugar, K. A. Moler, Appl. Phys. Lett. 93, 172514 (2008); O. M. Auslaender, L. Luan, E. W. J. Straver, J. E. Hoffman, N. C. Koshnick, E. Zeldov, D. A. Bonn, R. Liang, W. N. Hardy, K. A. Moler Nature Physics, 5, 35(2009); C. Reichhardt, Nature Physics 5, 15 (2009).
- (17) The cutoff lengths and depend on microscopic details. Typically, is determined by the length scale of line deformation in the direction, which in our case is given by the trapping length . The lower bound for is given by the c-axis coherence length . However, in layered superconductors more accurately can be estimated as the typical distance between the pancake vortices in the neighboring layers devided by the anisotropy factor .
- (18) G. Blatter, V. B. Geshkenbein, and J. A. G. Koopmann, Phys. Rev. Lett. 92, 067009 (2004).
- (19) Near depinning threshold, the pin-vortex potential as a function of the pinned-point displacement can be expanded as where and is the marginal equilibrium point. Below threshold this yields the barrier .
- (20) C. J. Bolech and A. Rosso, Phys. Rev. Lett. 93, 125701 (2004).
- (21) P. Le Doussal, and K. J. Wiese, Europhys. Lett. 77, 66001 (2007); A. Rosso, P. Le Doussal, and K. J. Wiese, Phys. Rev. B 75, 220201(R) (2007).
- (22) Follow this link to see animation of the line motion through array of the strong pins at finite temperature.
- (23) D. Ertaş, and M. Kardar, Phys. Rev. B 53, 3520 (1996).
- (24) H. Leschhorn and Lei-Han Tang Phys. Rev. Lett. 70, 2973 (1993).
- (25) A. Rosso, A. K. Hartmann, and W. Krauth, Phys. Rev. E 67, 021602 (2003).
- (26) A. B. Kolton, A. Rosso, E. V. Albano, and T. Giamarchi, Phys. Rev. B 74, 140201(R) (2006).
- (27) T. Nattermann, S. Stepanow, L.-H. Tang, and H. Leschhorn, J. Phys. II 2, 1483 (1992); O. Narayan and D.S. Fisher, Phys. Rev. B 48, 7030 (1993).