CS 5-4 survey toward nearby IR bright galaxies
Abstract
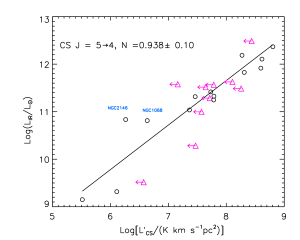
With the observations of the CS 5-4 line toward a sample of 24 infrared bright galaxies using HHSMT, we detected CS 5-4 emission in 14 galaxies, including 12 ULIRGs/LIRGs and 2 nearby normal galaxies. As a good dense gas tracer, which has been well used for studying star formation in the Milky Way, CS 5-4 can trace the active star forming gas in galaxies. The correlation between CS 5-4 luminosity, which is estimated with detected CS 5-4 line emission, and infrared luminosity in these 14 galaxies is fitted with correlation coefficient of 0.939 and the slope close to unity. This correlation confirmed that dense gas, which is closely linked to star formation, is very important for understanding star formation in galaxies.
keywords:
galaxies: ISM — ISM: molecules — radio lines: galaxies1 Introduction
The star formation law, the relation between star formation rate (SFR) and local gas density, is a fundamental tool to study star formation processes and understand galaxy evolution. This relation was first proposed by Schmidt (1959) as N, where and are the volume densities of SFR and gas, respectively, while 2 and the atomic gas density was used for discussion. With measurements of disk-averaged total gas surface density and the disk-averaged star formation surface density in 61 normal spiral galaxies and 36 infrared-selected starburst galaxies, Kennicutt (1998) gave the best fit for the Schmidt law with index . On the other hand, with pixel-by-pixel analysis at sub-kpc scales of 18 nearby galaxies, which include 7 spiral galaxies and 11 late-type/dwarf galaxies, Bigiel et al. (2008) found that a best-fit molecular Schmidt law of . Similar results () were obtained with the data of 23 nearby galaxies (Leroy et al., 2008), while the slope changes to 1.17 using galaxies including normal star-forming galaxies (Genzel et al., 2010). But if the ultraluminous infrared galaxies (ULIRGs) with extremely high star formation rate, which have the star formation efficiency four to 10 times than those normal star forming galaxies (Genzel et al., 2010), are included, the slope will be higher than the results from Bigiel et al. (2008), Leroy et al. (2008) and Genzel et al. (2010).
Lines of molecules with high dipole momentum, such as HCN, HNC, CN, HCO+ and CS, are thought to be better tracers of dense star forming gas than CO lines. These lines have been used to study star formation in the Milky Way, while they are generally difficult to be detected in extragalactic objects due to their faint emission. HCN, HNC and HCO+ lines (Graciá-Carpio et al., 2008; Bussmann et al., 2008) have been detected in a few galaxies with millimeter (IRAM 30m) and sub-millimeter telescopes (JCMT, HHSMT). CN line in several galaxies (Aalto et al., 2002) also has been observed with SEST. With the observations of dense gas tracers toward 65 galaxies (Gao & Solomon, 2004a), which is the largest extra-galatic sample with dense gas tracer observation up to now, Gao & Solomon (2004b) found a strong linear correlation between HCN and IR luminosity (1) with more than 3 orders of infrared luminosity range, including LIRGs and ULIRGs. This relation has been extended to the Milky Way dense cores (Wu et al., 2005) and possibly high- galaxies and QSOs as well (Gao et al., 2007). Such results agree well with that dense molecular gas is more directly related to final star formation than total molecular gas traced by CO lines from local universe to high-.
The line ratios of HCN, HNC, CN, and HCO+ molecules vary in different galaxies due to different chemical and physical conditions, and also maybe due to pumping mechanism, which means the dense gas mass estimated with the observation of only one dense gas tracer may be biased. As a good dense gas tracer, CS has been widely used to study dense cores in GMCs in the Milky Way. Since it is not affected by shock chemistry, which is the case for HCO+ molecule, and it is not related to HCN, HNC, and CN chemistry, CS can give an independed view of dense gas in galaxies from those based on HCN, HNC, CN, and HCO+. With critical density of about 10 times that of HCN 1-0 (Evans, 1999), CS 5-4 can trace dense gas in active star forming regions. CS 5-4 line has been detected in three nearby galaxies (IC342, NGC 253, and M82)(Mauersberger & Henkel, 1989), one nearby major merger NGC 4038/4039 (the Antennae galaxy) (Bayet et al., 2008), and the nearest ULIRG Arp 220 (Greve et al., 2009) with JCMT. CS 5-4 in several galaxies, including sources have been observed with other telescopes listed before and NGC 1068 & Maffei 2 have been detected with IRAM 30M (Martín et al., 2009). Most of such galaxies are not ULIRGs/LIRGs, which are galaxies with the most active star formation in local universe. So with observations of CS 5-4 toward a sample of galaxies with more total sources and including more ULIRGs/LIRGs, we can see if dense gas traced by different molecules can give similar correlation or not, by comparing with existing HCN results (Gao & Solomon, 2004b).
In this letter, we describe the observations and data reduction in §2, present our main results and discussion in §3, and give a brief summary in §4.
2 Observations and data reduction
Our sample is composed of 24 galaxies including 20 local (U)LIRGs and 4 nearby normal galaxies that have strong CO emissions. The (U)LIRGs are selected from RBGS (Sanders et al., 2003) with -20, 1011 , 25 Jy, 20 Jy. The nearby galaxies in our sample have been observed with millimeter telescopes for HCN 1-0 (Gao & Solomon, 2004b), which provides enough dense molecular gas traced by HCN 1-0, for higher possibility of CS 5-4 detection. Table 1 listed the information of sources in this sample, including source name, the coordinates (J2000), luminosity distance, red-shift, and also the infrared luminosity. The sources in Table 1 are ordered with the luminosity distance.
2.1 CS 5-4 observations with HHSMT
The 10 m Heinrich Hertz Submillimeter Telescope (HHSMT) on Mt. Graham, Arizona, was used to observe the CS 5-4 line in this sample. These observations were done in good ( 0.3) to medium ( 0.3-0.6) weather conditions, with typical system temperature of 210 K, during several runs on the HHSMT in February 2009, December 2009, and February 2010. The 1.3 mm ALMA receiver was employed with lower side-band tuning to the CS 5-4 frequency in the single-sideband (SSB) mode. The beam size at the frequency for CS 5-4 () is . In order to ensure the baselines as flat as possible, most observations were done in fast beam-switching mode with a chop throw of 2′ in azimuth (AZ) in a chopping frequency of 2.2 Hz. For a few nearby galaxies, position switching mode was used to avoid the background contamination. During the 2010 February run, the ALMA receiver had only H-pol working properly, while the dual polarization mode was used on other time.
We used both the Acoustic Optical Spectrometer (AOS) and Forbes Filter Banks (FFB) simultaneously, with 1 GHz bandwidth and 1024 channels to cover the full velocity-width of the expected broad lines. The data of both spectrometers were used to check with each other, but not combined together. Most of the final spectra were used the FFB data, for its relative stability. Our observing strategy involved pointing and calibration observations every 2 hr using Saturn, Jupiter or Venus when available. Calibration scans were obtained in position-switching mode with reference position of 5 in RA. We found typical pointing errors of 2-3 and measured the main-beam efficiency, , to be 0.6 for filter-bank A (H-polarization) and 0.8 for filter-bank B(V-polarization). The systematic flux calibration uncertainty is about 20%.
2.2 CS data reduction
All CS data reduction was performed using the CLASS program of the GILDAS package developed at IRAM. The velocity intervals based on the HCN or CO line profiles in literature are used to set the velocity range for all sources. Each baseline was inspected by eye and quantified into different levels by their baseline flatness, system temperature, standing wave, and etc. About 10% -15% bad spectra were discarded from the qualification. For each source, the spectra were co-added, weighted by the rms noise of each spectrum. The final spectra are zoomed in the velocity range to a little bit wider than CO 1-0 line width from literature, and a zero level baseline is subtracted to get the ‘local’ baseline level. We smoothed the spectra to resolution from 20 to 50 km s-1, depending on the noise levels, and convert from an antenna temperature, TA, to the main-beam temperature, Tmb, by scaling the main-beam efficiency, , using . Then the CS 5-4 line flux in each galaxy was integrated with the velocity range of CO line from literature, and listed as the second column in Table 2, including the integrated flux and error bar.
Single component gaussian profile is also used to fit each of the spectra with solid detections, to derive the area, system velocity, and line width of these lines. The fitted line flux of each galaxy was listed in the third column, while the fourth column was the line width.
The upper limits of the CS measurements correspond to sources without solid detections, where 3 are used in the following analysis. The upper limits were calculated through the relation
| (1) |
where is the FWZI (Full Width Zero Intensity) line width of galaxies; is the velocity resolution (in our case km s-1 after smoothing) and is from the baseline fitting.
2.3 CS line luminosity and the infrared luminosity correction
Most of the dense gas emission in galaxies with distance larger than that of NGC 2276 would be expected to concentrate within the SMT beam ( 33 for CS 5-4). We would like to consider that we have picked up most of the CS 5-4 emission and will compare with the total infrared luminosity of entire galaxy in those sources. On the other hand, infrared luminosity in 6 sources from NGC 6946 to NGC 2276 at the beginning of Table 1 have been corrected from the whole galaxy to the region within SMT beam. We used MIPS 24m image of those galaxies to obtain the ratio of such region to the whole galaxy and then derived infrared luminosity with CS 5-4 beam by scaling the total infrared luminosity listed in Table 1 from Sanders et al. (2003) with 24m flux ratio.
We computed the CS line luminosity using
| (2) |
, where is defined as:
| (3) |
, where is in the unit of . These 2 formulae were the formulae (1) and (2) in Gao & Solomon (2004a), where we used CS 5-4 instead of HCN 1-0. All of the measured line fluxes along with their errors are tabulated in Table 2. The errors include thermal and calibration errors, and also errors on the assumed aperture efficiencies. Each of these is assumed to be the uncorrelated and thus is added in the quadrature. The noise level was calculated for each line using , assuming all channels have the same response and are without any intereference between each other.
3 Results and discussion
We detected CS 5-4 with velocity integrated flux higher than 3 level in 13 galaxies. We used the CO line width to obtain velocity integrated flux, except for NGC 6240 in which we used CS 7-6 line range from Greve et al. (2009). Since CO line width is wider than that of dense gas tracers such as CS 5-4, we may over-estimate the noise level and all the 13 sources with velocity integrated flux higher than 3 should be solid detections. We show spectra of 2 detected galaxies in the top (Arp 220) and bottom (NGC 1068) of Figure 1. CS 2-1, 3-2, 5-4 and 7-6 lines in Arp 220 have been observed by Greve et al. (2009) and showed different line shapes for different transitions. The velocity range and total intensity of our CS 5-4 spectrum agree well with the result from Greve et al. (2009), but with a little bit difference in the line shape. Our CS 5-4 spectrum in NGC 6240 shows a similar velocity range to that of CS 7-6 observed by Greve et al. (2009), which is about 200-300 km/s blue shifted than CO lines. Even though the integrated flux of IRAS 23365+3604 is less than 3, the peak intensity at the velocity resolution of 23 km/s is more than 5mK, which is about 4 as shown at the top of Fig 2. We consider that CS 5-4 emission is detected in IRAS 23365+3604 and the flux derived from Gaussian fitting was used.
To avoid the system uncertainty between different telescopes, we have not included the CS 5-4 data detected with other telescopes for our study. The fit results for 14 sources with CS 5-4 detected sources is: , with correlation coefficient of 0.939. NGC 2146 and NGC 1068 have the largest deviations from the fit as shown in Figure 3. NGC 1068 is known to harbor active galactic nucleus with non-negligible contribution to the total 24 m emission. So the infrared luminosity within the CS 5-4 beam using the aperture correction of the 24m MIPS image could be over-estimated, and thus NGC 1068 is likely closer to the best fit. Our CS 5-4 spectrum has similar line shape and velocity range to those obtained with IRAM 30m (Martín et al., 2009), but with total flux about twice that from IRAM 30M. Since the beam size of IRAM 30m, which is about 10′′ for observing CS 5-4, is much smaller than the CS emission region, which is about 15′′ from high resolution observation of CS 2-1 with IRAM PdBI (Tacconi et al., 1997). So our observation with HHSMT can pick up more extended emission than that with IRAM 30m. On the other hand, as a nearby LIRG with only a possible low luminosity AGN (Inui et al., 2005; Israel, 2009), the infrared luminosity of NGC 2146 within CS 5-4 HHSMT beam should not be over estimated as that for NGC 1068. The large deviation should not be from the offset problem of beam switching mode, because the 2′ offset used in the observation is much far from the disk region with molecular gas based on CO mapping observation (Israel, 2009). Because of limited velocity coverage and broad line of CS 5-4 (see Figure 2) with the full line width of about 700 km/s, which is constant with the result of HCN 1-0 (Gao & Solomon, 2004a), the over subtracted baseline of CS 5-4 may cause under estimation of the line flux, which can cause the large deviation. Since it is hard to do re-calibration of CS 5-4 and/or infrared emission in NGC 2146 and NGC 1068, we will leave these two sources in this sample as solid detection and do fitting with original CS and infrared luminosity. We also tried to do the same fitting but without NGC 2146 and NGC 1068, which gave the result: , with correlation coefficient of 0.981.
The relationship between CS 5-4 and infrared luminosities presented in this work is consistent with close associations between star formation and dense gas which is also suggested by previous studies of correlations between SFR and HCN 1-0 (Solomon et al., 1992; Gao & Solomon, 2004b). With energy from upper level to the grand level , which is much higher than the temperature () of quiescent molecular cloud without star formation, and a little bit higher effective critical density than that of HCN 3-2 which is about 10 times that for HCN 1-0 (Evans, 1999), CS 5-4 is a good tracer of active star forming gas. Dense gas mass in galaxies estimated from individual types of dense gas tracers, such as HCN 1-0 and CS 5-4, may have systematic errors due to different physical conditions (temperature, density, etc.) excitation mechanisms (infrared pumping instead of collisional excitation) in different galaxies. . The contribution of nuclear activity to the total infrared luminosity can cause the over estimation of star formation rate, which can also introduce scatter to the correlation. Even though the line ratios of different dense gas tracers have been found to be variable in different galaxies (Aalto et al., 2002; Greve et al., 2009), the relation between dense gas mass, traced by both HCN 1-0 (Gao & Solomon, 2004b) and CS 5-4 in this work, and the star formation rate traced by infrared luminosity has an unity slope. So we suggest that dense gas, which is directly linked to star formation, is very important for understanding star formation in galaxies, and the relation between star formation and dense gas should be similar with the observations of different dense gas tracers, otherwise that dense gas tracer should be affected by other properties, such as shock or infrared pumping. Recent theoretical work (Krumholz et al., 2009) showed that both the total gas and the molecular gas star formation law can not even be fitted by a single power law. Theoretical predictions of dense gas star formation law and dense gas fraction in different type of galaxies are needed for comparing with observational results.
4 Summary and prospects
With the observations of CS 5-4 using the HHSMT 10m telescope toward 24 local infrared bright galaxies including 20 LIRGs/ULIRGs and 4 nearby normal galaxies, we detected CS 5-4 emission in 12 LIRGs/ULIRGs and 2 nearby normal galaxies. As the first extragalactic CS 5-4 survey with a sample larger than 10 galaxies, we found a correlation between CS 5-4 luminosity and infrared luminosity with an almost unity slope.
Since only 14 galaxies have CS 5-4 detection in our sample, it is necessary to enlarge the sample for CS 5-4 observation. The existing (sub-)millimeter telescopes, such as HHSMT, CSO, JCMT, IRAM 30m, APEX, and also the LMT can be used for such observations. The nearby star forming galaxies can be observed with the smaller telescopes (HHSMT, CSO, JCMT, and APEX), while the ULIRGs/LIRGs should be observed with IRAM 30m and the LMT which have better sensitivity. We have started a project to detect CS 5-4 in more ULIRGs/LIRGs with IRAM 30m. Other CS transitions, such as CS 1-0, 2-1, 3-2, and also 7-6 can also be considered to determine dense gas properties (volume density, temperature, etc.) for galaxies with strong CS emission based on one transition observation. CS lines in galaxies should also be a good choice to study star formation in galaxies for ALMA early science.
Acknowledgements
The authors thank the HHSMT staff for the help of remote observation and thank the anonymous referee for helpful comments. This work was supported by the Natural Science Foundation of China under grants of 10803002 and 10833006.
References
- Aalto et al. (2002) Aalto S., Polatidis A. G., Hüttemeister S., Curran S. J., 2002, A&A, 381, 783
- Bayet et al. (2008) Bayet E., Lintott C., Viti S., Martín-Pintado J., Martín S., Williams D. A., Rawlings J. M. C., 2008, ApJ, 685, L35
- Bigiel et al. (2008) Bigiel F., Leroy A., Walter F., Brinks E., de Blok W. J. G., Madore B., Thornley M. D., 2008, AJ, 136, 2846
- Bussmann et al. (2008) Bussmann R. S., Narayanan D., Shirley Y. L., Juneau S., Wu J., Solomon P. M., Vanden Bout P. A., Moustakas J., Walker C. K., 2008, ApJ, 681, L73
- Evans (1999) Evans II N. J., 1999, ARA&A, 37, 311
- Gao et al. (2007) Gao Y., Carilli C. L., Solomon P. M., Vanden Bout P. A., 2007, ApJ, 660, L93
- Gao & Solomon (2004a) Gao Y., Solomon P. M., 2004a, ApJS, 152, 63
- Gao & Solomon (2004b) Gao Y., Solomon P. M., 2004b, ApJ, 606, 271
- Genzel et al. (2010) Genzel R., Tacconi L. J., Gracia-Carpio J., Sternberg A., Cooper M. C., Shapiro K., Bolatto A., Bouché N., Bournaud F., Burkert A., Combes F., Comerford J., Cox P., Davis M., Schreiber N. M. F., Garcia-Burillo S., et al. 2010, MNRAS, 407, 2091
- Graciá-Carpio et al. (2008) Graciá-Carpio J., García-Burillo S., Planesas P., Fuente A., Usero A., 2008, A&A, 479, 703
- Greve et al. (2009) Greve T. R., Papadopoulos P. P., Gao Y., Radford S. J. E., 2009, ApJ, 692, 1432
- Inui et al. (2005) Inui T., Matsumoto H., Tsuru T. G., Koyama K., Matsushita S., Peck A. B., Tarchi A., 2005, PASJ, 57, 135
- Israel (2009) Israel F. P., 2009, A&A, 506, 689
- Kennicutt (1998) Kennicutt Jr. R. C., 1998, ApJ, 498, 541
- Krumholz et al. (2009) Krumholz M. R., McKee C. F., Tumlinson J., 2009, ApJ, 699, 850
- Leroy et al. (2008) Leroy A. K., Walter F., Brinks E., Bigiel F., de Blok W. J. G., Madore B., Thornley M. D., 2008, AJ, 136, 2782
- Martín et al. (2009) Martín S., Martín-Pintado J., Mauersberger R., 2009, ApJ, 694, 610
- Mauersberger & Henkel (1989) Mauersberger R., Henkel C., 1989, A&A, 223, 79
- Sanders et al. (2003) Sanders D. B., Mazzarella J. M., Kim D., Surace J. A., Soifer B. T., 2003, AJ, 126, 1607
- Schmidt (1959) Schmidt M., 1959, ApJ, 129, 243
- Solomon et al. (1992) Solomon P. M., Downes D., Radford S. J. E., 1992, ApJ, 387, L55
- Tacconi et al. (1997) Tacconi L. J., Gallimore J. F., Genzel R., Schinnerer E., Downes D., 1997, Ap&SS, 248, 59
- Wu et al. (2005) Wu J., Evans II N. J., Gao Y., Solomon P. M., Shirley Y. L., Vanden Bout P. A., 2005, ApJ, 635, L173
| Source name | R.A. | DEC | D | Redshift | Log() |
|---|---|---|---|---|---|
| (J2000) | (J2000) | Mpc | |||
| NGC 6946 | 20:34:52.3 | +60:09:14 | 3.65 | 0.000133 | 10.16 |
| NGC 891 | 02:22:33.4 | +42:20:57 | 4.43 | 0.001761 | 10.27 |
| NGC 2146 | 06:18:37.6 | +78:21:19 | 12.6 | 0.002979 | 11.07 |
| NGC 7331 | 22:37:04.1 | +34:24:56 | 14.5 | 0.002722 | 10.58 |
| NGC 1068 | 02:42:40.7 | -00:00:48 | 16.1 | 0.003793 | 11.27 |
| NGC 2276 | 07:27:14.3 | +85:45:16 | 33.8 | 0.008059 | 10.81 |
| NGC 4194 | 12:14:09.5 | +54:31:37 | 35.5 | 0.008342 | 11.06 |
| CGCG 049-057 | 15:13:13.1 | +07:13:32 | 55.5 | 0.012999 | 11.27 |
| NGC 992 | 02:37:25.5 | +21:06:03 | 55.7 | 0.013813 | 11.02 |
| IRAS 17578-0400 | 18:00:31.9 | -04:00:53 | 60.0 | 0.014043 | 11.35 |
| NGC 7771 | 23:51:24.9 | +20:06:43 | 60.9 | 0.014267 | 11.34 |
| MCG+12-02-001 | 00:54:03.6 | +73:05:12 | 67.1 | 0.015698 | 11.44 |
| NGC 1614 | 04:33:59.9 | -08:34:44 | 68.1 | 0.015938 | 11.6 |
| NGC 7469 | 23:03:15.6 | +08:52:26 | 69.8 | 0.016317 | 11.59 |
| NGC 828 | 02:10:09.6 | +39:11:25 | 76.8 | 0.017926 | 11.31 |
| Arp 220 | 15:34:57.1 | +23:30:11 | 77.6 | 0.018126 | 12.21 |
| NGC 2623 | 08:38:24.1 | +25:45:17 | 79.3 | 0.018509 | 11.54 |
| VV 114 | 01:07:47.2 | -17:30:25 | 86.1 | 0.020067 | 11.65 |
| NGC 6240 | 16:52:58.9 | +02:24:03 | 106 | 0.024480 | 11.85 |
| NGC 6090 | 16:11:40.7 | +52:27:24 | 126.6 | 0.029304 | 11.51 |
| Mrk 231 | 12:56:14.2 | +56:52:26 | 184.0 | 0.042170 | 12.51 |
| IRAS 17208-0014 | 17:23:21.9 | -00:17:00 | 187.0 | 0.042810 | 12.39 |
| VII zw31 | 05:08:15.3 | +79:36:46 | 236.1 | 0.053670 | 11.94 |
| IRAS 23365+3604 | 23:39:01.3 | +36:21:09 | 286.0 | 0.064480 | 12.13 |
Total Infrared Luminosity is from RBGs (Sanders 2003), and corrected with the distances.
The sources from NGC 6946 to NGC 2276 have been corrected from total infrared luminosity from this table to the emission within the region of CS 5-4 beam, using MIPS 24 m image, to compare with CS 5-4 luminosity.
| Source name | ICS5-4 | Area(CS5-4) | VCS5-4 | On source time |
|---|---|---|---|---|
| K km/s | K km/s | km/s | Minutes | |
| NGC 6946 | 1.299 0.097 | 1.400.19 | 480 70 | 45 |
| NGC 891 | 3.692 0.327 | 3.640.50 | 377 54 | 20 |
| NGC 2146 | 0.611 0.060 | 0.600.07 | 315 54 | 110 |
| NGC 7331 | 0.626 0.266 | —- | —- | 15 |
| NGC 1068 | 0.883 0.180 | 0.670.14 | 130 29 | 60 |
| NGC 2276 | 0.72 0.361 | —- | —- | 15 |
| NGC 4194 | 0.976 0.298 | —- | —- | 45 |
| CGCG 049-057 | 1.100 0.304 | 1.110.43 | 304105 | 45 |
| NGC 992 | 0.138 0.159 | —- | —- | 30 |
| IRAS 17578-0400 | 0.908 0.133 | 0.900.16 | 28350 | 45 |
| NGC 7771 | 0.419 0.124 | 0.460.16 | 29688 | 60 |
| MCG+12-02-001 | 0.642 0.060 | 0.690.08 | 36841 | 70 |
| NGC 1614 | 0.088 0.044 | —- | —- | 140 |
| NGC 7469 | 0.244 0.167 | —- | —- | 40 |
| NGC 828 | 0.202 0.124 | —- | —- | 20 |
| Arp 220 | 1.631 0.128 | 1.700.22 | 46768 | 60 |
| NGC 2623 | 0.147 0.083 | —- | —- | 100 |
| VV 114 | -0.441 0.249 | —- | —- | 15 |
| NGC 6240 | 0.993 0.118 | 1.060.18 | 28958 | 80 |
| NGC 6090 | 0.110 0.160 | —- | —- | 100 |
| Mrk 231 | -0.390 0.117 | —- | —- | 45 |
| IRAS 17208-0014 | 0.981 0.330 | 0.860.32 | 14165 | 20 |
| VII zw31 | 0.393 0.109 | 0.460.12 | 34181 | 140 |
| IRAS 23365+3604 | 0.309 0.177 | 0.320.09 | 6425 | 60 |
ICS5-4 is the flux integrated from the spectrum with the line width of CO 1-0 from literature.
Area(CS5-4) is the flux using gaussian fitting for sources with solid detection except for NGC 4194, which has the line shape more complicated than one gaussian component. The derived line width was listed as
VCS5-4.