Application of the equipartition theorem to the thermal excitation of quartz tuning forks
Abstract
The deflection signal of a thermally excited force sensor of an atomic force microscope can be analyzed to gain important information about the detector noise and about the validity of the equipartion theorem of thermodynamics. Here, we measured the temperature dependence of the thermal amplitude of a tuning fork and compared it to the expected values based on the equipartition theorem. In doing so, we prove the validity of these assumptions in the temperature range from 140 K to 300 K. Furthermore, the application of the equipartition theorem to quartz tuning forks at liquid helium temperatures is discussed.
Over the last decades quartz tuning forks have been used to build self-sensing sensors in many research fields, for example hydrodynamics of quantum fluidsClubb et al. (2004); Bradley et al. (2010), spectroscopic gas sensingKosterev et al. (2005); Wojcik et al. (2006) and scanning probe microscopyGünther, Fischer, and Dransfeld (1989); Karrai and Grober (1995); Giessibl (2000). In this paper we focus on quartz tuning forks used in frequency modulation atomic force microscopy, although the results are also applicable to other fields utilizing quartz tuning forks. Frequency modulation atomic force microscopy (FM-AFM) with quartz tuning forks has put forth a number of impressive results Giessibl et al. (2000); Ternes et al. (2008); Gross et al. (2009), e.g. FM-AFM was used to resolve the chemical structure of a molecule Gross et al. (2009). In FM-AFM the frequency shift of an oscillator measures the local interaction of the microscope tip with the sample. The force between tip and sample can be calculated from the frequency shift if the sensor’s resonance frequency, stiffness and oscillation amplitude are known Giessibl (2001); Sader and Jarvis (2004). Thus for determining relevant physical quantities out of the observed frequency shift those properties must be well-characterized.
A tuning fork is a cut piezoelectric quartz crystal with two prongs and gold electrodes along the prongs. When one or both prongs are deflected, charge accumulates on the electrodes. The sensitivity describes the relation between the piezoelectric output signal and the deflection of a tuning fork. It is therefore essential to know in order to determine the deflection amplitude. One method to determine the sensitivity is to compare the output of the tuning fork due to thermal excitation with the expected result based on the equipartition theorem and the assumption that the first harmonic mode is the only mode significantly excited. The equipartition theorem is also used in FM-AFM to calculate the fundamental noise limits in force detection due to thermal excitationAlbrecht et al. (1991); Colchero et al. (2011). Understanding the fundamental noise limits is very important for judging and improving a system’s performance. In this paper we show the validity of using the equipartition theorem in the temperature range from 140 K to 300 K and discuss its application at liquid helium temperatures.
The equipartition theorem states that each degree of freedom holds a thermal energy of , where is Boltzmann’s constant and is the temperature in Kelvin. For a coupled oscillator like the tuning fork with one degree of freedom this leads to the relation
| (1) |
where is the spring constant and is the thermal deflection amplitude of one prong.
Experimentally, the piezoelectric signal of a tuning fork is measured with a transimpedance amplifier. The voltage output of the transimpedance amplifier can be converted to the thermal deflection amplitude by knowing the sensitivity of the quartz tuning fork:
| (2) |
In this notation the sensitivity depends on the amplifier. The theoretical sensitivity of a tuning fork calculated with beam theoryGiessibl (2000) is given by
| (3) |
where is the resonance frequency and is the feedback resistor of the transimpedance amplifier. Compared with the equation given in reference Giessibl, 2000, the two dimensionless factors and have been added to account for the limited bandwidth of the transimpedance amplifier and the geometrical configuration of the tuning fork’s electrodes. The geometry factor is independent of the amplifier and reduces the generated charge per deflection by the factor . It was determined by a strobe microscopy deflection measurement similar to that reported in reference Bradley et al., 2010.
In our experiments we use an encapsulated tuning fork with a resonance frequency of Hz, a quality factor of , and a spring constant of . This tuning fork is mounted into a bore in a metal slab that serves as a thermal mass. The metal slab with the tuning fork is first immersed in liquid nitrogen until it is thermalized, which is indicated by the end of the heavy boiling of the liquid nitrogen. Subsequently, the cold metal slab is put inside polystyrene insulation. As the metal slab warms up, the tuning fork’s output is continually being measured. The generated current is converted to a voltage by a transimpedance amplifier consisting of an op-amp (AD823) with a 100 feedback resistor. The op-amp and feedback resistor are both kept at room temperature. The transimpedance gain of of the amplifier is reduced by the factor due to its limited bandwidth of . The output of the transimpedance amplifier is fed into a spectrum analyzer (SRS SR760) where the power spectral density is recorded.
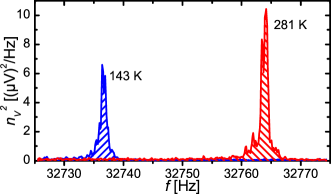
In figure 1 two spectra of the power spectral density are shown at two different temperatures. The temperature in Kelvin of each spectrum is determined by the shift of the actual resonance frequency with respect to the resonance frequency Mic (2010): . It should be noted that the frequency shift is always negative off the resonance. This dependence was previously verified for a tuning fork in the temperature range from 150 K to 300 K Hembacher, Giessibl, and Mannhart (2002). The power spectral density has two components and . The density is the contribution of the thermal energy to the deflection of the tuning fork, whereas is the electrical noise density of the transimpedance amplifier. The relevant output is the area under the resonance peak without the contribution of the electrical noise density . Thus the squared voltage output of the thermally excited tuning fork can be expressed as
| (4) |
Here the electrical noise density is assumed to be white over the bandwidth , which is the local frequency range around the thermal peak. Experimentally, a bandwidth of and a center frequency of are used for all measurements as shown in figure 1. The electrical noise density corresponds to the baseline of the density . It can be estimated by averaging away from the thermal peak which leads to a value of Note (1).
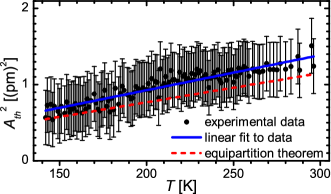
Figure 2 shows the temperature dependence of the squared thermal deflection amplitude. The thermal deflection amplitudes are determined out of the temperature dependent spectral noise densities using equations (2), (3) and (4). The measurements are averaged in 1 K intervals and the error bars show the maximum standard deviation. The dashed, red line depicts the expected thermal deflection amplitude according to the equipartition theorem, equation (1). It has to be noted that there are no free parameters neither in the measurements of nor in the calculation of used in figure 2. The experimental data resembles the expected linear temperature dependence in , as shown by the solid, blue linear fit without offset. However, there is a slight deviation in the slopes between the linear fit and the theoretical temperature dependence. We propose that this can be explained by an inaccuracy in the sensitivity . The sensitivity according to equation (3) results in at the resonance frequency. If the sensitivity is assumed to be a free parameter, the optimal sensitivity to fit the data to the equipartition theorem is , which is a 9% change. The change in the sensitivity due to frequency shift can be ignored as the frequency changes with temperature less than 0.1%. However, the qualitative and quantitative agreement proves within the measurement accuracy the validity of using the equipartition theorem for thermally excited tuning forks.
Of course, the above argument only holds, if the tuning fork is solely excited by thermal energy. It must be ensured that there are no mechanical excitations due to vibrations. In order to compare mechanical noise with the thermal noise the equivalent white noise driveColchero et al. (2011)
| (5) |
can be used. The white noise drive given in describes an equivalent mechanical drive of a harmonic oscillator in accordance with the equipartition theorem.
In general, tuning forks are very robust against vibrations of the base plate because vibrations would lead to a symmetric oscillation mode of the prongs, whereas the tuning fork oscillates preferably in the anti-symmetric mode. In the anti-symmetric oscillation mode the tuning fork’s center of mass stays at rest leading to less dissipation in the baseplate. Furthermore, charges produced by the symmetric mode cancel out each other due to the asymmetric electrode configuration, which suppresses the symmetric mode.
In FM-AFM tuning forks are often used in the qPlus configurationGiessibl (2000), where one prong of the tuning fork is glued to a massive substrate. Though the qPlus sensor has proven itself Giessibl et al. (2000); Ternes et al. (2008); Gross et al. (2009), it is more sensitive to vibrations of the baseplate. This plays a serious role especially at low temperatures. At liquid helium temperatures the quality factor of the qPlus sensor can raise up to . This means that even very small vibrations of the baseplate can notably excite the qPlus sensor. For example, the theoretical thermal amplitude at 4.4 K is fm according to a thermal white noise drive of . With a quality factor of any vibration bigger than 1.84 am (!) would result in a deflection amplitude bigger than the thermal deflection amplitude. If the tuning fork is mounted on a dither piezo for mechanical excitation, the vibrations can result from noise in the excitation voltage applied to the piezo. The white noise drive can be compared with this electrical noise knowing the sensitivity of the dither piezo. In our Omicron LT qPlus AFM/STM the white noise drive corresponds to an electrical noise density of the excitation voltage. Thus in this setup the noise on the excitation voltage needs to be better than in order to justifiably exploit the equipartition theorem for determining the thermal deflection amplitude at liquid helium temperatures.
Conversely, if this stability is not provided, the equipartition theorem can be used to assign an effective temperature to the qPlus sensor:
| (6) |
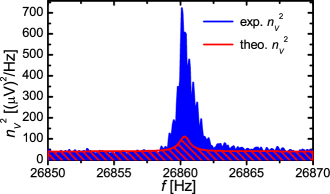
The amplitude is determined like the thermal amplitude before by recording the power spectral spectral density without active driving and using equations (2) and (4). This effective temperature can be significantly higher than the temperature of the thermal bath. Figure 3 shows a spectrum of qPlus sensor measured in our Omicron LT qPlus AFM/STM at 4.4 K without active driving and the piezos grounded. The sensitivity of the sensor was determined in situ with a tunneling current controlled amplitude determinationSimon, Heyde, and Rust (2007) resulting in . The deflection amplitude is given by , which corresponds to an effective temperature of K. Therefore also the frequency noise and the minimum detectable force gradient rise according to equations (18) and (19) in reference Albrecht et al., 1991.
In summary, we have shown the temperature dependence of the thermal deflection amplitude of a quartz tuning fork. This dependence shows clearly a linear behavior in as expected by the equipartition theorem. Furthermore, the application of the equipartition theorem to qPlus sensors at liquid helium temperatures was discussed. It was shown that the mechanical stability has to be in the order of attometers in order to gain thermal-noise-limited performance. But the equipartition theorem can also be used to determine a realistic minimum detectable force gradient for a given setup.
We acknowledge Florian Pielmeier, Thomas Hofmann and Alfred J. Weymouth for fruitful discussion and support.
References
- Clubb et al. (2004) D. O. Clubb, O. V. L. Buu, R. M. Bowley, R. Nyman, and J. R. Owers-Bradley, J. Low Temp. Phys. 136, 1 (2004).
- Bradley et al. (2010) D. I. Bradley, P. Crookston, M. J. Fear, S. N. Fisher, G. Foulds, D. Garg, A. M. Guénault, E. Guise, R. P. Haley, O. Kolosov, G. R. Pickett, R. Schanen, and V. Tsepelin, J. Low Temp. Phys. 161, 536 (2010).
- Kosterev et al. (2005) A. A. Kosterev, F. K. Tittel, D. V. Serebryakov, A. L. Malinovsky, and I. V. Morozov, Rev. Sci. Inst. 76, 043105 (2005).
- Wojcik et al. (2006) M. D. Wojcik, M. C. Phillips, B. D. Cannon, and M. S. Taubman, Appl. Phys. B 85, 307 (2006).
- Günther, Fischer, and Dransfeld (1989) P. Günther, U. C. Fischer, and K. Dransfeld, Appl. Phys. B 48, 89 (1989).
- Karrai and Grober (1995) K. Karrai and R. D. Grober, Appl. Phys. Lett. 66, 1842 (1995).
- Giessibl (2000) F. J. Giessibl, Appl. Phys. Lett. 76, 1470 (2000).
- Giessibl et al. (2000) F. J. Giessibl, S. Hembacher, H. Bielefeldt, and J. Mannhart, Science 289, 422 (2000).
- Ternes et al. (2008) M. Ternes, C. P. Lutz, C. F. Hirjibehedin, F. J. Giessibl, and A. J. Heinrich, Science 319, 1066 (2008).
- Gross et al. (2009) L. Gross, F. Mohn, N. Moll, P. Liljeroth, and G. Meyer, Science 325, 1110 (2009).
- Giessibl (2001) F. J. Giessibl, Appl. Phys. Lett. 78, 123 (2001).
- Sader and Jarvis (2004) J. E. Sader and S. P. Jarvis, Appl. Phys. Lett. 84, 1801 (2004).
- Albrecht et al. (1991) T. R. Albrecht, P. Grutter, D. Horne, and D. Rugar, J. Appl. Phys. 69, 668 (1991).
- Colchero et al. (2011) J. Colchero, M. Cuenca, J. F. G. Martínez, J. Abad, B. P. García, E. Palacios-Lidón, and J. Abellán, J. Appl. Phys. 109, 024310 (2011).
- Mic (2010) DS-Series Watch Crystal 32.768 kHz, Micro Crystal AG, Mühlestrasse 14, CH-2540 Grenchen, Switzerland (2010).
- Hembacher, Giessibl, and Mannhart (2002) S. Hembacher, F. J. Giessibl, and J. Mannhart, Appl. Surf. Sci. 188, 445 (2002).
- Note (1) The electrical noise density is smaller than the Johnson noise of the feedback resistor (), because the Johnson noise is attenuated due to the limited bandwidth of the amplifier.
- Simon, Heyde, and Rust (2007) G. H. Simon, M. Heyde, and H. Rust, Nanotechnology 18, 255503 (2007).