On Rapid Disk Accretion and Initial Conditions in Protostellar Evolution
Abstract
Low-mass protostars may accrete most of their material through short-lived episodes of rapid disk accretion; yet until recently evolutionary tracks for these protostars assumed only constant or slowly-varying accretion. Important initial steps toward examining the potential effects of rapid accretion were recently made by Baraffe, Chabrier, & Gallardo, who showed that in the limit of low-temperature (”cold”) accretion, protostars may have much smaller radii than found in previous treatments. Such small radii at the end of protostellar accretion would have the effect of making some young stars appear much older - perhaps as much as 10 Myr - than they really are. However, we argue that very rapid disk accretion is unlikely to be cold, for two reasons. First, observations of the best-studied pre-main sequence disks with rapid disk accretion outbursts - the FU Ori objects - have spectral energy distributions which imply large, not small, protostellar radii. Second, theoretical models indicate that at high accretion rates, protostellar disks become internally hot and geometrically thick, making it much more likely that hot material is added to the star. In addition, the very large luminosity of the accretion disk is likely to irradiate the central star strongly, heating up the outer layers and potentially expanding them. Finally, observed HR diagram positions of most young stars and even estimated properties of some Class 0 protostars are inconsistent with the rapid cold accretion models. Nevertheless, the Baraffe et al. calculations emphasize the importance of initial protostellar radii for subsequent evolution. As these initial properties are controlled by the amount of thermal energy incorporated into the protostellar core during initial hydrodynamic collapse, significant variations in initial protostellar radii for a given final stellar mass are quite possible if not likely. These variations could well affect the apparent ages of low-mass stars near the nominal 1 Myr isochrones.
1 Introduction
Isochrones for pre-main sequence stars are of great importance for our understanding of early stellar evolution, histories of star formation in molecular clouds, and evolutionary timescales of protoplanetary disks. The contraction of these non-hydrogen-burning stars can be used to estimate their ages, provided the “initial” radius at the end of protostellar accretion is known. The starting radius is important for age-dating the youngest stars; theoretical studies long ago indicated that solar-mass protostars have radii only a few times larger than their main sequence values (Larson 1969, 1972; Stahler, Shu, & Taam 1980a,b; Stahler 1983, 1988), a result which has been reinforced over the years (Palla & Stahler 1992, 1999; Omukai & Palla 2003; Hosokawa & Omukai 2009).
The protostellar radius is sensitive to the exact amount of thermal energy added during accretion (in the absence of nuclear fusion), as gas pressure provides the support against gravity. Fully hydrodynamic collapse calculations from realistic turbulent and time-dependent initial conditions usually assume simplistic energy equations (e.g., Klessen, Burkert, & Bate 1998; Bate, Bonnell, & Bromm 2003), because of the large range of scales that must be followed (for example, the recent calculations of Greif et al. 2011 follow collapse down to accretion radii of 100 ). Therefore most calculations of the detailed evolution of protostellar properties have assumed some initial protostellar core mass and radius with some assumed infall rate to resolve the accretion flow - and thus, the heat transport - much more finely.
The most self-consistent treatments of thermal energy addition during accretion have assumed spherical (or quasi-spherical) infall (Stahler et al. 1980a,b; Stahler 1983; Hosokawa & Omukai 2009). However, it seems likely that much, if not most of the protostellar mass must be accreted through a disk, rather than spherically, given the small sizes of protostars relative to their progenitor cloud and the likelihood that the cloud had some finite angular momentum. This greatly increases the difficulty in calculating the amount of thermal energy transported into the protostar. For one thing, the problem can no longer be treated in spherical geometry; for another, the details of the disk structure depend upon the nature and properties of the viscous transport, which are uncertain (see, e.g., Hartmann et al. 2006). To get around this difficulty, Siess, Forestini, & Bertout (1997, 1999; SFB) and Hartmann, Cassen, & Kenyon (1997; HCK) treated the amount of thermal energy added to the star via disk accretion as a free parameter. SFB and HCK further showed that for modest accretion rates, the assumption of negligible thermal energy addition (“cold accretion”) was arguably adequate. Moerover, these results were roughly consistent with the spherical accretion calculations of Stahler (1988), basically because the onset of D fusion lead to protostellar evolutionary tracks near what might be termed the “D-fusion main sequence” (important in establishing the protostellar “birthline” (end of major accretion) positions in the HR diagram; Stahler 1983, 1988). The above investigations led to birthlines in reasonable agreement with observations, in that they were situated modestly above the observed positions of pre-main sequence stars in the HR diagram, consistent with the expectation that the stars contract toward the main sequence after the main phase of accretion has ended. In addition, recent improvements in directly estimating protostellar radii during the Class I phase also show reasonable agreement with theory (White et al. 2007, and references therein).
These investigations of protostellar properties generally assumed steady or slowly-varying accretion as a function of time. However, there is increasing evidence that low-mass protostars accrete a substantial part, if not most, of their material through short bursts of extremely rapid disk accretion (Kenyon et al. 1990, 1994; Enoch et al. 2009; Dunham et al. 2010), with extended periods of low mass accretion interspersed (Muzerolle et al. 1998; White & Hillenbrand 2004; Doppmann et al. 2005; Covey et al. 2005). Motivated by these considerations, Baraffe, Chabrier, & Gallardo (2009; BCG) and Baraffe & Chabrier (2010; BC) made an important first step by calculating models with bursts of rapid protostellar accretion. Because of the major difficulties involved in computing the thermal energy added through disk accretion described above, BCG and BC adopted the limiting case of cold accretion. BCG and BC showed that it was possible to obtain much smaller birthline radii than found in previous studies, even lying well below many of the HR diagram positions of young populations in molecular clouds.
Given the potential significance of the BCG and BC results for determining ages of young stars, we attempt here to address the question: can such rapid disk accretion be treated in the cold limit? We suggest that the answer is no, based on both observational and theoretical considerations. However, the BCG and BC results also depend on the assumption of a small initial radius. As some variation in initial protostellar radii must occur, depending upon the specific circumstances in which individual stars form, the BCG and BC investigations serve as a reminder of the potential importance of initial conditions (a point made previously by HCK). Based on current observations and limitations on the possibility of rapid cold accretion, we argue that while uncertainties of order 10 Myr are very unlikely, uncertainties of 1 Myr due to variations in initial protostellar core radii seem probable.
2 An observational test
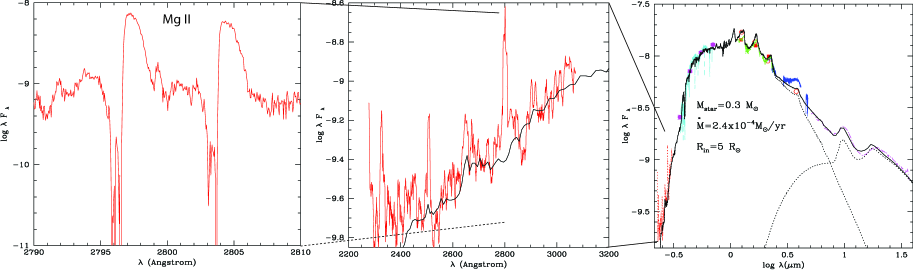
The outbursts of FU Ori objects result from disk accretion at (Hartmann & Kenyon 1996), similar to the rates assumed in BCG and BC. In Figure 1 we show a revised version our recent fit for spectral energy distribution (SED) of FU Ori itself using a steady disk model (Zhu et al. 2007, 2008; Figure 1). Here we use the HST STIS spectrum (Project 8627, Calvet PI) to extend results to the near-ultraviolet without changing the model or estimated extinction. As can be seen, the simple steady disk model fits the SED very well from Å to m, beyond which the spectrum changes from that of an internally-heated viscous disk to that of a flared disk heated mostly by radiation from the inner regions.
Using our measurements of Keplerian rotation from m to m (Zhu et al. 2009a) and the estimated inclination of from near-infrared interferometry, the central star mass is , the inner disk radius is , and the accretion rate is . This radius, though consistent with previous estimates for other well-studied FU Ori objects (e.g., Kenyon, Hartmann, & Hewett 1988; KHH), differs strongly from the low-luminosity models of BC and BCG. For instance, BC find a radius of in their Figure 5 for a protostar which has undergone rapid cold accretion. As the maximum disk temperature scales as , for the same total luminosity an inner disk radius of would change the peak disk temperature from our model result of K to K. The optical-near UV spectral features, which are independent of accretion, would then have the appearance of a late B star rather than the observed early G star, well beyond any observational uncertainties. Indeed, the inferred inner radius is also larger than that of typical birthline estimates, leading to suggestions that rapid disk accretion leads to stellar expansion, not contraction (Hartmann & Kenyon 1985; Kenyon et al. 1989).
One way of potentially reconciling this observational result with a smaller central star radius is if a stellar magnetosphere is truncating the disk. However, as shown in the middle panel of Figure 1, there is no evidence for accretion shock emission at a level of the overall accretion luminosity. Furthermore, the observed line profiles show no evidence for magnetospheric infall, as discussed in Hartmann & Kenyon (1996); the major emission lines simply show outflow, as in the case of the Mg II resonance lines, with blue-shifted absorption (left panel of Figure 1). Indeed, the absence of a noticeable high-temperature component either as a result of magnetospheric accretion shock or boundary layer emission poses some interesting theoretical questions, as discussed in the following section.
3 Rapidly-accreting disks
The accretion luminosity (ignoring boundary layer emission) of a (steady) disk is
| (1) |
Initially, the masses of of the BCG and BC objects are quite low, , with radii on the order of ; at this stage, the intrinsic (stellar) luminosities are also low, or smaller. Later on, for protostellar masses of and radii , luminosities are . Thus, during the presumed cold rapid accretion phase, the accretion luminosities are three orders of magnitude larger than that of the (sub)stellar central object. For cold accretion to be a reasonable approximation, it is therefore necessary for only or less of the accretion energy to enter the star as thermal energy; at larger rates, expansion of the star is likely (see, e.g., Prialnik & Livio 1985). This is a very stringent requirement, for the following reasons.
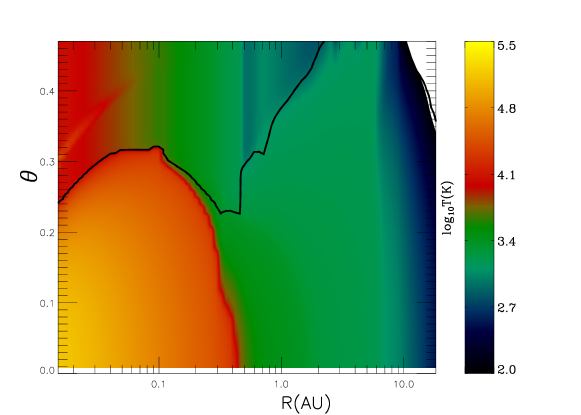
Models have long indicated that FU Ori disks should have very high midplane temperatures at small radii, K, and thus should become geometrically thick (Clarke, Lin, & Pringle 1990; Bell & Lin 1994; Zhu et al. 2009c; Figure 2). As Clarke et al. (1990) pointed out, this geometrical thickness helps explain the absence of boundary layer radiation; where in standard disk models slowing from Keplerian rotation occurs over a narrow radial region, resulting in high effective temperatures, the diffusion of this energy over a radial region eliminates this emission (see also Popham et al. 1996). Indeed, the steady disk model without boundary layer emission fits the HST spectrum remarkably well (Figure 1). The absence of hot emission, either from a boundary layer or a magnetospheric accretion shock, led Hartmann & Kenyon (1985) and Kenyon et al. (1989) to suggest that significant amounts of thermal energy from the disk are being more widely distributed, not just within the disk but into the star.
It is worth emphasizing that the advection of hot material into the star is not the only way in which rapid accretion can heat the central protostar. Simply by virtue of being geometrically thick, the disk blocks a significant fraction of the protostellar surface, so that a freely-radiating boundary condition is no longer appropriate. Perhaps more importantly, some of the radiation emitted by the disk can be absorbed by the stellar outer layers. While for low accretion rates and geometrically thin disks such heating is relatively unimportant (e.g., Adams & Shu 1986), this is probably not the case when .
The radius interior to which the disk is expected to make the transition to a state with a high central temperature, and thus become geometrically thick, is (see Appendix):
| (2) |
where is the central star mass, is the (assumed steady disk) accretion rate in units of , and is the usual viscosity parameter. The prediction of equation (2) compares well with the detailed numerical simulations of Zhu et al. (2009b) at higher accretion rates. This result reinforces the conclusion that the assumption of thin cold disk accretion is unlikely to be reasonable at , and there may be effects even at accretion rates of onto a low-mass protostars.
It is plausible that even if the stellar magnetosphere is crushed down to the stellar surface at FU Ori accretion rates, at lower mass fluxes the magnetosphere could hold off the disk from the stellar photosphere. However, even in this case, if the disk outside the magnetosphere is geometrically thick as indicated by equation (2), some accretion energy will be radiated out of the inner disk “wall” at the magnetospheric truncation radius; for , very little of this radiation need be intercepted by the star to change the outer boundary condition radically. We conjecture that this would inevitably heat the outer layers of the star significantly even in the absence of direct advection of thermal energy by mass accretion.
4 Initial radii
While BCG and BC assumed cold accretion occurred during disk accretion outbursts (Vorobyov & Basu 2005, Vorobyov 2009, Zhu et al. 2009 a,b,c), BCG note that outbursts are not necessary to produce small protostellar radii; rather, the radius at the onset of the calculation was crucial. To see qualitatively why the initial radius is so important, we construct the following highly simplified model. Following HCK, we model the protostar as an polytrope, assume cold accretion, and neglect any blocking of the stellar photospheric radiation by optically-thick accreting material. The evolution of the protostar is then determined by the equation (HCK)
| (3) |
Here parameterizes the thermal energy addition per unit mass, and the deuterium fusion luminosity is given by
| (4) |
(Stahler 1988). Here is the fractional concentration of deuterium relative to its initial number abundance, which is taken to be .
We evolve the protostellar properties using equation (3) for for high mass accretion rates that are constant in time. The method of solution is essentially the same as in HCK, except that we adopt a simple estimate of the effective temperature as an approximation to the Baraffe et al. (1998) tracks near Myr between :
| (5) |
This essentially assumes that the Hayashi tracks are vertical in the HR diagram. While this is not quite correct, the results are not very sensitive to this simplification.
Figure 3 shows protostellar calculated as above for a variety of initial radii for a rapid mass accretion rate of as in BCG and BC. We begin with an initial core mass of because our polytropic approximation is not adequate at lower masses. It is evident that the initial radius is an extremely important parameter in establishing the subsequent evolutionary track. Starting with a relatively large initial radius allows the protostar to evolve for a period of time along the D fusion “birthline” (where the central temperature is K, the point at which D fusion can begin), while for smaller starting radii the protostar never moves up to the birthline beyond , but stays well below.
The reason for this behavior is straightforward. For the star not to contract under cold accretion, the energy available from the fusion of D must be sufficient to compensate for the increased gravitational potential energy due to the accreted mass. At a given mass, smaller radii imply larger gravitational potential energies, which D fusion energy release cannot counteract in steady state. Our simple model assumes an initial full complement of deuterium, instantaneous mixing of D throughout the star, and that the star remains an polytrope. With these assumptions, the star initially expands, moving up along the birthline, by fusing D faster than it is being accreted. This behavior is forced by the high temperature sensitivity of D fusion (Stahler 1988), which prevents the central temperature from increasing very much beyond the point at which D begins to be fused. The initial phase of expansion rapidly exhausts the initial D content, using the released energy to expand the star such that constant. After the D is exhausted, the accretion of fresh material cannot keep up with the photospheric radiative losses, and the protostar adds mass at nearly constant or slightly decreasing radius.
The BCG and BC models do not show the initial rise from to seen in our calculation because the accretion turns on and off on timescales much shorter than the Kelvin timescale. However, the sense of the evolutionary behavior is the same, in the sense of producing much smaller protostellar radii. While BCG and BC emphasize episodic accretion, they point out that this is not essential; steady fast accretion yields the same basic results (see §5).
Figure 3 also shows results for , that is, 5% of the accretion luminosity is assumed to be added to the star as thermal energy, for the case of the smallest initial radius () (heavy curve). The results show a significant increase in the final protostellar radius. Such values of added thermal energy are not implausible; for instance, we estimate that for typical mass to radius protostellar values, inner disk temperatures K yield . However, it must be re-emphasized that the use of equation (3) at high accretion rates in any case is suspect, as it does not include any irradiation of the star by the disk. As noted above, the net effect of a large external accretion luminosity is likely to turn the outer layers of the star radiative and result in expansion (as occurs in Prialnik & Livio 1985 for sufficient heat addition during accretion).
5 Discussion
The post-protostellar HR diagram positions of the rapid cold accretion models of BCG and BC lie well below observations of young stars in many molecular clouds, as BCG themselves show (their Figure 1; see also, e.g., Rebull et al. 2002). They also lie below estimated protostellar positions (White & Hillenbrand 2004; Doppmann et al. 2005; see Figure 4 in White et al. 2007), though one must emphasize that these results are somewhat uncertain due to the difficulty of making appropriate extinction corrections. Moreover, some young clusters of age Myr show quite narrow empirical isochrones (Moitinho et al. 2001; Preibisch et al. 2002 Hernandez et al. 2007, 2008); this would not be the case if a substantial fraction of the stars exhibited offsets of several Myr in their isochrones. In all, the observational constraints on young stellar populations indicate that age uncertainties due to rapid accretion are generally considerably less than the maximum values suggested by BCG and BC.
On the other hand, this is not to understate the importance of the BCG and BC results in emphasizing the importance of initial protostellar radii ( “protostellar core radii”) for subsequent protostellar evolution. These radii are controlled by the amount of thermal energy incorporated into the initial protostellar core during the early phases of hydrodynamic collapse, and which, as discussed in the Introduction, are difficult to calculate. Given the likely variation in initial conditions for collapse (as indicated by models of turbulent star formation), there is no reason to suppose that all stars in a given region started out with the same initial core mass and radius, or even all stars of the same mass.
That variations in initial radii would result in protostars evolving in “birth regions” rather than strict birthlines has long been recognized, even in the case of steady accretion (see Figure 6 in HCK). To emphasize this point, in the right-hand panel of Figure 4 we show steady cold accretion tracks for the slower rates more appropriate to the use of equation 3. The results indicate that the initial “core” radius dominates the results, with hardly any difference between accretion rates of and . To place this in perspective, contraction from large radii of a fully convective star down vertical tracks in the HR diagram is such that the age (e.g., Hartmann 2009). The difference of about in shown in Figure 4 therefore corresponds to a difference in , or a change in the apparent age of a factor of two. (Of course, the age of the star immediately after the end of accretion is effectively zero). Although there are systematic uncertainties in comparing the results of this simple calculation to those of more sophisticated treatments, it is still worth noting that the two sets of evolutionary tracks for protostars with correspond to ages of and Myr in the Siess et al. (2000) tracks, as the latter have no birthline corrections. This suggests that uncertainties in ages could be of order 1 Myr for the low-mass stars; because D fusion is less important in intermediate mass stars, age uncertainties can be larger for these objects (Hartmann 2003). The need for birthline or birth region corrections to ages computed from non-accreting tracks, and its importance at early times, was the reason why Baraffe et al. (1998) did not provide evolutionary tracks and isochrones for ages less than 1 Myr (personal communication).
It is understandable that observers often do not include birthline corrections in determining age distributions, and instead use tracks assuming contraction from much larger radii, to avoid a number of problems. Birthline positions are theoretically uncertain, and might even be variable from star to star. In addition, there are significant uncertainties due to systematic effects in translating theoretical tracks into observable quantities. However, this does not mean that birth region corrections are unimportant. As BCG and BC suggest, this could have important implications for some of the variations in radius seen in among stars of the same mass in young clusters (e.g., Jeffries 2007, 2011) and in eclipsing young brown dwarf binaries (Stassun et al. 2006; Mohanty et al. 2009).
A robust calculation of the amount of thermal energy carried into a protostar by a rapidly-accreting thick disk is an enormously challenging problem, requiring three-dimensional simulation and careful treatment of viscosities in both disk and star. A more immediately feasible theoretical calculation, following the methods of BCG and BC, would be to include a plausible amount of thermal energy addition in rapid accretion burst models to see this can explain the factor of two increase in stellar radius implied by the spectral energy distribution fitting of FU Ori objects. Unfortunately, neither of these theoretical improvements will address the complex issue of what variations in initial protostellar core radii arise from hydrodynamic collapse in turbulent, structured molecular clouds. As it seems completely unreasonable to suppose that protostellar cores will all have the same starting masses and radii - or even the same starting radii, given a fixed mass - this variation will result in differing pre-main sequence radii at a given mass and true age after the end of major accretion.
On theoretical and observational grounds, rapid cold disk accretion is highly unlikely to occur; thus we argue that rapid episodic accretion is not a good candidate for producing very large variations in protostellar radii, with consequent uncertainties of 10 Myr in the ages of low-mass pre-main sequence stars. More modest uncertainties, of order 1 Myr (and more for intermediate mass stars; Hartmann 2003) are plausible, and can be produced by differences in initial conditions, most particularly the initial protostellar core radii; this can probably only be advanced through improved observational constraints. The results of BCG and BC emphasize the importance of further efforts to improve our understanding of the ages of the youngest stars.
6 Appendix
At high accretion rates, viscous heating dominates the disk temperature distribution. Vertically-averaging the disk, the relationship between the central temperature and the effective temperature is , where is the disk surface density and is the Rosseland mean opacity. Fitting the opacity as , where and are constants, and combining this with the steady disk results and to find the disk central pressure,
| (6) |
The disk central temperature is
| (7) |
Combing above two equations, we have
| (8) | |||||
The disk becomes geometrically thick when the thermal instability develops, which occurs for central temperatures above 5000 K. Setting , at , and , we have
| (9) |
Comparison with the two-dimensional simulations of Zhu et al. (2009b) indicates that the disk becomes geometrically thick at about a factor of two smaller radius, where the central temperature rises above K. Adopting this scaling, we arrive at an estimate of the radius interior to which the disk is geometrically thick and internally hot as
| (10) |
References
- Adams & Shu (1986) Adams, F. C., & Shu, F. H. 1986, ApJ, 308, 836
- Baraffe et al. (1998) Baraffe, I., Chabrier, G., Allard, F., & Hauschildt, P. H. 1998, A&A, 337, 403
- Baraffe et al. (2009) Baraffe, I., Chabrier, G., & Gallardo, J. 2009, ApJ, 702, L27 (BCG)
- Baraffe & Chabrier (2010) Baraffe, I., & Chabrier, G. 2010, arXiv:1008.4288 (BC)
- Bell & Lin (1994) Bell, K. R., & Lin, D. N. C. 1994, ApJ, 427, 987
- Clarke et al. (1990) Clarke, C. J., Lin, D. N. C., & Pringle, J. E. 1990, MNRAS, 242, 439
- Doppmann et al. (2005) Doppmann, G. W., Greene, T. P., Covey, K. R., & Lada, C. J. 2005, AJ, 130, 1145
- Dunham et al. (2010) Dunham, M. M., Evans, N. J., Terebey, S., Dullemond, C. P., & Young, C. H. 2010, ApJ, 710, 470
- Enoch et al. (2009) Enoch, M. L., Evans, N. J., Sargent, A. I., & Glenn, J. 2009, ApJ, 692, 973
- Hartmann (2009) Hartmann, L. 2009, Accretion Processes in Star Formation: Second Edition, (Cambridge University Press)
- Hartmann et al. (1997) Hartmann, L., Cassen, P., & Kenyon, S. J. 1997, ApJ, 475, 770
- Hartmann et al. (2001) Hartmann, L., Ballesteros-Paredes, J., & Bergin, E. A. 2001, ApJ, 562, 852
- Hartmann & Kenyon (1985) Hartmann, L., & Kenyon, S. J. 1985, ApJ, 299, 462
- Hartmann & Kenyon (1996) Hartmann, L., & Kenyon, S. J. 1996, ARA&A, 34, 207
- Hernández et al. (2007) Hernández, J., et al. 2007, ApJ, 662, 1067
- Hernández et al. (2008) Hernández, J., Hartmann, L., Calvet, N., Jeffries, R. D., Gutermuth, R., Muzerolle, J., & Stauffer, J. 2008, ApJ, 686, 1195
- Hosokawa & Omukai (2009) Hosokawa, T., & Omukai, K. 2009, ApJ, 703, 1810
- Jeffries (2007) Jeffries, R. D. 2007, MNRAS, 381, 1169
- Jeffries (2011) Jeffries, R. D. 2011, arXiv:1102.4752
- Kenyon & Hartmann (1991) Kenyon, S. J., & Hartmann, L. W. 1991, ApJ, 383, 664
- Kenyon et al. (1988) Kenyon, S. J., Hartmann, L., & Hewett, R. 1988, ApJ, 325, 231
- Kenyon et al. (1989) Kenyon, S. J., Hartmann, L., Imhoff, C. L., & Cassatella, A. 1989, ApJ, 344, 925
- Kenyon et al. (1990) Kenyon, S. J., Hartmann, L. W., Strom, K. M., & Strom, S. E. 1990, AJ, 99, 869
- Kenyon et al. (1994) Kenyon, S. J., Gomez, M., Marzke, R. O., & Hartmann, L. 1994, AJ, 108, 251
- Larson (1969) Larson, R. B. 1969, MNRAS, 145, 271
- Larson (1972) Larson, R. B. 1972, MNRAS, 157, 121
- Mohanty et al. (2009) Mohanty, S., Stassun, K. G., & Mathieu, R. D. 2009, ApJ, 697, 713
- Moitinho et al. (2001) Moitinho, A., Alves, J., Huélamo, N., & Lada, C. J. 2001, ApJ, 563, L73
- Muzerolle et al. (1998) Muzerolle, J., Hartmann, L., & Calvet, N. 1998, AJ, 116, 2965
- Omukai & Palla (2003) Omukai, K., & Palla, F. 2003, ApJ, 589, 677
- Palla & Stahler (1999) Palla, F., & Stahler, S. W. 1999, ApJ, 525, 772
- Popham et al. (1996) Popham, R., Kenyon, S., Hartmann, L., & Narayan, R. 1996, ApJ, 473, 422
- Prialnik & Livio (1985) Prialnik, D., & Livio, M. 1985, MNRAS, 216, 37
- Preibisch et al. (2002) Preibisch, T., Brown, A. G. A., Bridges, T., Guenther, E., & Zinnecker, H. 2002, AJ, 124, 404
- Rebull et al. (2006) Rebull, L. M., Stauffer, J. R., Ramirez, S. V., Flaccomio, E., Sciortino, S., Micela, G., Strom, S. E., & Wolff, S. C. 2006, AJ, 131, 2934
- Siess et al. (1997) Siess, L., Forestini, M., & Bertout, C. 1997, A&A, 326, 1001
- Siess et al. (1999) Siess, L., Forestini, M., & Bertout, C. 1999, A&A, 342, 480
- Siess et al. (2000) Siess, L., Dufour, E., & Forestini, M. 2000, A&A, 358, 593
- Stahler (1983) Stahler, S. W. 1983, ApJ, 274, 822
- Stahler (1988) Stahler, S. W. 1988, ApJ, 332, 804
- Stahler et al. (1980a) Stahler, S. W., Shu, F. H., & Taam, R. E. 1980a, ApJ, 241, 637
- Stahler et al. (1980b) Stahler, S. W., Shu, F. H., & Taam, R. E. 1980b, ApJ, 242, 226
- Stassun et al. (2006) Stassun, K. G., Mathieu, R. D., & Valenti, J. A. 2006, Nature, 440, 311
- Vorobyov & Basu (2005) Vorobyov, E. I., & Basu, S. 2005, ApJ, 633, L137
- Vorobyov (2009) Vorobyov, E. I. 2009, ApJ, 704, 715
- White et al. (2007) White, R. J., Greene, T. P., Doppmann, G. W., Covey, K. R., & Hillenbrand, L. A. 2007, Protostars and Planets V, 117
- White & Hillenbrand (2004) White, R. J., & Hillenbrand, L. A. 2004, ApJ, 616, 998
- Zhu et al. (2007) Zhu, Z., Hartmann, L., Calvet, N., Hernandez, J., Muzerolle, J., & Tannirkulam, A.-K. 2007, ApJ, 669, 483
- Zhu et al. (2008) Zhu, Z., Hartmann, L., Calvet, N., Hernandez, J., Tannirkulam, A.-K., & D’Alessio, P. 2008, ApJ, 684, 1281
- Zhu et al. (2009a) Zhu, Z., Espaillat, C., Hinkle, K., Hernandez, J., Hartmann, L., & Calvet, N. 2009a, ApJ, 694, L64
- Zhu et al. (2009b) Zhu, Z., Hartmann, L., & Gammie, C. 2009b, ApJ, 694, 1045
- Zhu et al. (2009c) Zhu, Z., Hartmann, L., Gammie, C., & McKinney, J. C. 2009c, ApJ, 701, 620
- Zhu et al. (2010) Zhu, Z., Hartmann, L., Gammie, C. F., Book, L. G., Simon, J. B., & Engelhard, E. 2010, ApJ, 713, 1134