Observation of Magnetic Edge State and Dangling Bond State on Nanographene in Activated Carbon Fibers
Abstract
The electronic structure of nanographene in pristine and fluorinated activated carbon fibers (ACFs) have been investigated with near-edge x-ray absorption fine structure (NEXAFS) and compared with magnetic properties we reported on previously. In pristine ACFs in which magnetic properties are governed by non-bonding edge states of the -electron, a pre-peak assigned to the edge state was observed below the conduction electron peak close to the Fermi level in NEXAFS. Via the fluorination of the ACFs, an extra peak, which was assigned to the -dangling bond state, was observed between the pre-peak of the edge state and the peak in the NEXAFS profile. The intensities of the extra peak correlate closely with the spin concentration created upon fluorination. The combination of the NEXAFS and magnetic measurement results confirms the coexistence of the magnetic edge states of -electrons and dangling bond states of -electrons on fluorinated nanographene sheets.
pacs:
73.22.Pr, 75.75.-cI INTRODUCTION
The magnetism of carbon-based materials has been one of the most important and challenging issues in carbon science and molecule magnetism since 1950s phi1954 , and it is still a matter of controversy due to difficulty in obtaining well characterized materials carbon . Recent works on nanographene and graphene edges have shed light on this long lasting problem and have proposed an edge state as a promising candidate explaining the magnetic origin in -electron-based carbon materials rev2009 ; sol2009 . The circumference of an arbitrary shaped piece of nanograpehene is described in terms of a combination of zigzag and armchair edges. According to theoretical studies, edge states of nonbonding -electron origin are created in the zigzag edge region even if all the edge carbon atoms are terminated by foreign atoms, in spite of the absence of such states in the armchair edges jpsj1996 ; jpsj1998 . Interestingly, the edge states are predicted to be strongly spin polarized. With these theoretical predictions as the impetus, many experimental works have been devoted to investigate the electronic structure and magnetic properties of nanographene inherent to the edge state by utilizing various techniques. These include scanning tunneling microscopy/spectroscopy (STM/STS), near edge x-ray absorption fine structure (NEXAFS), energy loss near edge fine structure (ELNES), magnetic susceptibility, electron spin resonance (ESR), magnetic force microscopy, etc prb2005 ; prb2010 ; prb2006 ; apl2006 ; nat2010 . STM/STS observations on graphene edges existing at a graphite step edge have demonstrated the existence of a finite local density of states assigned to the edge-state at the Fermi level (Dirac point) along the zigzag edge prb2005 ; prb2010 ; prb2006 . The presence of the edge-state around the Fermi level has also been suggested for nanographene grown on Pt(111) by carbon K-edge NEXAFS apl2006 . Recently, Seunaga succeeded to observe the atomically resolved electronic structure of the edge atom of graphene by ELNES nat2010 . From the magnetism point of view, magnetic susceptibility and electron spin resonance (ESR) measurements on nanoporous carbon consisting of nanographene sheets have demonstrated the detailed behavior of edge-state spins contributing to the magnetism of nanographene sol2009 . However, most of these experimental studies investigated either the electronic or the magnetic state only, without showing direct evidence that the edge state is responsible for the origin of the magnetism. Accordingly, it is an important requisite to investigate nanographene samples with a combination of electronic and magnetic techniques. Recently, we reported the existence of the edge states in nanographene and confirmed the magnetic feature of the edge state by investigating a graphene nanoribbons sample using NEXAFS and ESR prb2010j . However, the issue of the relationship between the edge state and its magnetic feature still remains not solved due to the presence of trace-level magnetic impurities mentioned in our previous report.
In addition to the edge state of -electron origin, there is another possible mechanism by which localized spins can be created; that is, the localized spins of -dangling bonds, which are believed to be the origin of carbon magnetism from the early stages of research on carbon magnetism phi1954 . For example, when the edge carbon atoms are unterminated, the -dangling bonds of these carbon atoms have localized spins. -dangling bonds can also be created by locally destroying the flat sp2/ hexagon network of a graphene sheet prb2007 . This can be done by bonding a foreign atom such as hydrogen or fluorine to a carbon atom in the interior of a graphene sheet. Indeed, for the latter case, the creation of localized spins was observed for highly fluorinated ACFs by magnetic measurements sol2009 ; jpsj2001 . The appearance of the localized spins in the above case was explained by dangling bond formation due to the local destruction of the -conjugation at the interior carbon sites via fluorination. Here, again, only the magnetic properties of the fluorinated ACFs have been investigated with the electronic structure remaining poorly understood.
In the present study, we discuss the electronic structure and magnetic properties of the edge and -dangling bond in nanographene in pristine and fluorinated ACFs on the basis of a combination of electronic (NEXAFS) and magnetic techniques (SQUID) we reported on previously jpsj2001 . ACF is a nanoporous piece of carbon consisting of a three dimensional disordered network of nanographite domains, each of which is a stack of 3-4 nanographene sheets with a mean in-plane size of about 2-3 nm. ACFs have a high density of edge carbon atoms (the number ratio of edge carbon atoms to the interior carbon atoms is ca. 30/200) due to the small size of nanographene sheets. ACFs are, thus, a good model system for investigating the magnetic edge state and -dangling bonds.
II EXPERIMENTAL
Pristine ACFs were commercially available samples (Kurary Chemicals, FR-20; specific surface areas of 2000 ) prepared by the activation of phenol-based precursor materials. Previous studies confirmed that magnetic impurities were well below the detection level in SQUID and ESR measurements jpsj2001 ; nex . Fluorination was carried out by the direct reaction between fluorine gas and ACFs. The carbon K-edge NEXAFS was measured at the soft x-ray beam line BL-7A in the Photon Factory in the Institute of Materials Structure Science. The ground powder sample was mounted on a Ta plate and loaded into the chamber maintained in ultrahigh-vacuum (10-7 Pa). NEXAFS spectra were then obtained by measuring the sample photocurrent. NEXAFS measurements were performed for the samples, which were characterized by X-ray photo emission spectra (XPS) and SQUID in our previous study jpsj2001 . The experimental details are described in this paper. Briefly, the degree of fluorination F/C, which represents the atomic composition ratio, was determined by the ratio of the C1s peak area to the F1s peak area in XPS spectra. Magnetic susceptibility measurement were carried out by a SQUID magnetometer (Quantum Design MPMS5) in a 1 T field between 2K and 380 K, where we used about 20 mg samples vacuum sealed in quartz tubes.
III MAGNETIC EDGE STATE ON ACFS
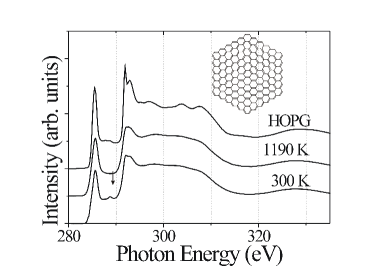
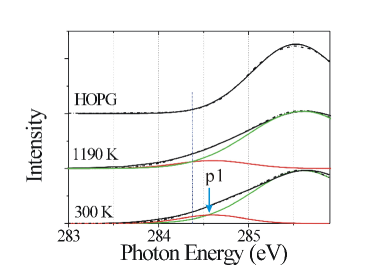
Figure 1 shows the C K-edge NEXAFS spectra of the ACFs at room temperature and ACFs heated at 1190 K, in addition to the spectrum of HOPG. The NEXAFS spectra were normalized with respect to the value of the edge jump at 340 eV, where the intensity was proportional to the amount of carbon atoms. All of the samples showed two peaks at 285.5 eV and 291.9 eV, which correspond to the C 1s to and the C 1s to transitions, respectively. An additional small feature was observed at 288.5 eV for the ACFs, which can be attributed to the C-OH, C-OOH and C-H groups of the foreign species bonded to ACFs nex . The feature disappeared for the ACFs heated at 1190 K. Figure 2 is the close-up of the pre-edge region of the NEXAFS spectra. We can see a tailing on the low energy side of the peak, which suggests the presence of an additional peak (p1) around the Fermi level. The spectral analysis was carried out for the NEXAFS spectra. First, the peak width of the peak was determined to be 1.5 eV from the spectrum of HOPG. Next, the spectra of the ACFs were fitted with two Gaussian peaks assuming that the energy and peak width of the peak were the same as those of HOPG. The energy and peak width of the additional peak (p1) was estimated as 284.5eV and 0.82 eV, respectively, from the fitting results shown in Fig. 2. The integrated intensity of the p1 peak was 11 and 9 of that of the peak for the ACFs and ACFs heated at 1190 K, respectively. The p1 peak survived after heating at 1190 K, although the intensity of the p1 peak slightly decreased.
Usually, the graphene edge is terminated by oxygen-containing functional groups such as carboxyl (-COOH), carbonyl (=CO), hydroxyl (-OH), and phenol (-C6H5OH) groups for the ACFs sample exposed to the air at room temperature jpc2010 . By heating the ACFs above 1190 K in UHV, these groups are completely decomposed, as evidenced by the negligible content of oxygen in the XPS spectra XPS . The edge would be terminated by oxygen-free functional groups such as hydrogen. Therefore, the existence of the p1 peak for the ACFs heated at 1190 K confirmed that the p1 peak originates from the intrinsic electronic state of the nanographene close to the Fermi level, that is, edge states in the nanographene sheet. Our recent experimental results with nanographene showed the decrease in intensity of the p1 peak with the heat treatment temperature above 1800 K XPS . Heat treatment at temperatures above the graphitization temperature (above 1800 K) makes nanographene sheets fuse with each other, resulting in the successive disappearance of the nanographene edge sol2009 . The decrease in the p1 intensity with temperature also confirmed the assignment of the p1 peak to the edge state. The decrease in the intensity of the p1 peak upon annealing at 1190K spectra can be explained by the interaction between nanographene and oxygen-containing functional groups, which bond to the graphene edge. The oxygen-containing functional groups that are abundant in the sample at 300 K act as electron acceptors, resulting in the downshift of the Fermi level from the Dirac point jpc2010 . Since the center of the edge state is just at the Dirac point in neutral nanographene, the downshift of the Fermi level leads to an increase in the density of unoccupied states, which is detected by NEXAFS. By heating the ACFs above 1190 K in UHV, the oxygen-containing functional groups are decomposed completely and the Fermi level shifts back jpc2010 . Accordingly, the density of unoccupied states, that is, the p1 peak decreased by heating to 1190 K.
According to a previous Raman study, the size of our nanographene was estimated as 2.5 nm jpsj2001 . This gives information on the composition ratio of the edge carbon atoms to the carbon atoms in the interior of a nanographene sheet. In order to allow us to get a concrete idea of nanographene sheet, a representative structure of a nanographene sheet with a mean size of 2.5 nm is shown in the inset of Fig. 1. It is a hexagonal shaped nanographene sheet consisting of 216 carbon atoms. The number of edge carbon atoms connected with two carbon neighbors is given to be 36, which corresponds to 17 of all of the carbon atoms involved. The estimated contribution of the edge carbon atoms is in good agreement with 10 contribution of the observed p1 integrated peak intensity ass . Meanwhile, our previous magnetic susceptibility and ESR measurements of the ACFs samples employed in the present NEXAFS observations revealed the presence of the localized spins which interact with each other through an exchange interaction sol2009 ; jpsj2001 . Accordingly, the combination of the NEXAFS and magnetic measurement results confirms the existence of the magnetic edge state for nanographene.
IV MAGNETIC EDGE AND DANGLING BOND STATE ON FLUORINATED ACFS
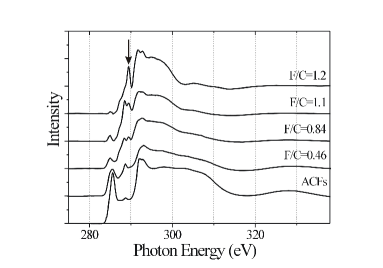
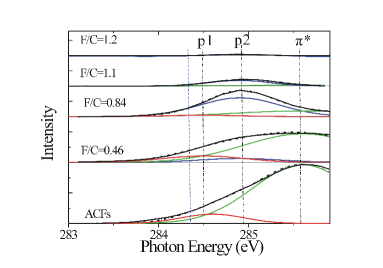
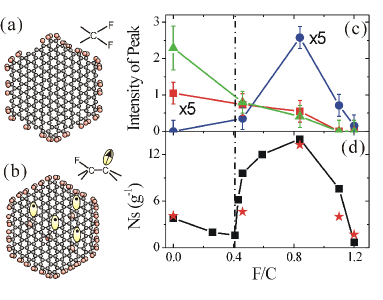
Let us discuss the effect of fluorination in the ACFs next. Figure 3 shows the C K-edge NEXAFS spectra of the fluorinated ACFs at various fluorine concentrations. With an increase in the fluorine concentration, the intensity of the peak decreased and a new peak appeared around 290 eV (denoted by the arrow in Fig. 3), which could be ascribed to the (C-F) mol2001 . It can be understood that the appearance of the new peak is a consequence of the formation of a C-F bond at the expense of a bond between the carbon atom attacked by a fluorine atom and the carbon atom adjacent to it. Interestingly, upon fluorination, an extra peak (p2) at 284.9 eV was created in addition to the edge-state peak (p1) and the -conduction band. This peak became pronounced at F/C0.84, and then it tended to get smaller above that concentration. Accordingly, the spectral analysis of the NEXAFS was carried out with three peaks as exhibited in Fig. 4. The energy and width of the p2 peak were determined by the spectrum of ACFs at F/C=1.1 with the energy and width of peak 2 being 284.9 eV and 0.71 eV, respectively. The energy and peak width of the and edge state peaks were fixed to the values of HOPG and the pristine ACFs. Figure 5(c) summarizes the integrated intensities of the , edge state and p2 peaks as a function of fluorine concentration. With the increase in fluorine concentration, the intensity of the and edge state peaks decreased monotonically. Peak 2 started appearing at F/C=0.46, and it increased to a maximum at F/C=0.8, after which it began to vanish as the fluorine concentration reached the saturated value of F/C1.2.
In understanding the behavior of the NEXAFS spectra, we recall the two-stage change in the localized spin concentration with a discontinuity around F/C0.4 as a function of fluorine concentration jpsj2001 . Figure 5(d) shows the localized spin concentration () observed from magnetic susceptibility measurements jpsj2001 . In the range of up to F/C0.4, decreased monotonically as fluorination proceeded. Above that fluorine concentration, increased to a maximum of around F/C0.8, after which it decreased toward zero as the fluorine concentration approached the saturation concentration of F/C=1.2. This change owes to the stepwise fluorination in the initial and successive stages, in which the chemically active edge carbon atoms and the less chemically active interior carbon atoms participate jpc1999 .
In the initial stage (Fig. 5(a)), the termination of edge carbon atoms with fluorine atoms leads to the conversion of a graphite sp2 bond into an sp3 bond at the expense of a bond in the edge region. Taking into account the schematic model of the nanographene sheet in ACFs consisting of 216 carbon atoms, the numbers of the edge carbon atoms connected with two and three carbon neighbors in the periphery are given to be 36 and 30, respectively. Carbon atoms at the former edge sites form CF2 bond and those at the latter sites give CF bonds. The fluorination at the edges is eventually completed at ca. (236+30)/216 47, which roughly meets the boundary concentration of F/C0.4. Accordingly, the fluorination of the edge carbon atoms, which makes the conjugated -electron system shrink, explains the decrease in the intensity of the peak upon the fluorination of the edge carbon. The termination with fluorine atoms also affects the edge state. Indeed, according to the band structure of graphene nanoribbons calculated by DFT, the flat band at the Fermi energy, which is assigned to the edge state, is modulated by fluorination jpsj2004 . Moreover, theoretical calculations indicate that the total magnetic moment for the fluorinated graphene nanoribbon, in which the edge on one side is monofluorinated and that on the other side is difluorinated, is only 1/3 of that of the hydrogenated nanoribbon jpsj2004 . This is what we observed in the edge-state peak in the NEXAFS spectra as well as in the magnetic behavior observed in the susceptibility. Here, we pay careful attention to the effect of fluorination on the magnetic properties of ACFs in the range of up to F/C0.4. The concentration of localized spin obtained from the spin susceptibility decreases monotonically with fluorination. This means that the termination of edge carbon atoms with fluorine atoms kills the localized spins successively. Here, we should reconfirm the origin of the localized spin, though the NEXAFS spectrum (p1) suggests it to be edge-state spin. In the fluorine concentration region below F/C0.4, the negative orbital susceptibility is observed for ACFs, which is the signature of the extended conjugated -electron system [16]. The orbital susceptibility monotonically decreases with fluorination in the fluorine concentration region below F/C0.4, indicating a decrease in the size of the -electron system, in accordance with the decrease in the intensity of the peak. Eventually, the localized spins observed in this fluorine concentration region were assigned to the edge-state spin of -electron origin.
After the fluorination is completed at the edge around F/C0.4, fluorine atoms begin to attack the carbon atoms in the interior of the nangraphene sheet, breaking the bonds (see Fig. 5(b)). The decrease in the intensity of the peak is explained by this fluorination process. When a fluorine atom is bonded to a carbon atom in the interior, a -dangling bond having a localized spin is created at the carbon site adjacent to the carbon atom that is fluorinated. The concentration of the dangling bonds becomes maximized when about half of the carbon atoms in the interior of the nanographene sheet are singly bonded to fluorine atoms. Again, considering the schematic model of the nanographene sheet consisting of 216 carbon atoms, the number of interior carbon atoms is 150. Therefore, the total number of fluorine atoms bonded to carbon atoms is 75 (interior site)+102 (edge site)=177 when half of the carbon atoms in the interior of nanographene sheet are bonded to fluorine. Then the fluorine concentration in this situation is F/C=0.82. This estimate coincides with the presence of the maximum spin concentration at F/C0.8 as shown in Fig. 5(d). The saturated fluorine concentration corresponds to the concentration at which all the carbon atoms are fluorinated, and is obtained from the schematic model of nanographene as F/C=(150 (interior site)+102(edge site))/2161.17, which agrees with the observed saturated fluorine concentration of F/C=1.2, at which the spin concentration decreased to zero as shown in Fig. 5(d). It is noteworthy that the change in the intensity of peak 2 (-dangling bond) tracks the change in the spin concentration shown in Fig. 5(d) with fidelity. The good quantitative agreement indicates that the -dangling bond observed as peak 2 is responsible for the localized spin observed in the fluorine concentration range of 0.4F/C1.2. This assignment is justified from the fact that the orbital susceptibility of -electron disappears above F/C0.4 jpsj2001 . Interestingly, peak 1 still survived even at concentrations higher than F/C0.4, although its intensity decreased significantly. The fluorination process might not be uniform in the ACFs. A part of the edge carbon atoms might not be fully terminated with fluorine atoms for some nanographenes sheets, even if fluorine atoms begin to attack the carbon atoms in the interior of other nanographenes sheets. Alternatively, the existence of the p1 peak might prove the edge-state can coexist even under the condition in which the -conjugated system in the interior of nanographene sheets is largely destroyed by fluorination.
Here, we briefly comment on the energy and peak width of the edge state and -dangling bond state peaks. The peak energy was higher for the -dangling bond state peak (p2: 284.9eV) than that for edge state peak (p1: 284.5eV). Furthermore, the peak width of p2 (0.71 eV) was slightly smaller than that of p1 (0.82 eV). The peak widths of the p1 and p2 were much smaller than that of the peak. These findings can be explained by considering the band dispersion and screening of the core hole formed during X-ray absorption. Namely, in contrast to the extended feature of the conduction electron state, both the -dangling bond state and the edge state are localized states with negligible dispersion jpsj1996 ; jpsj1998 ; jpsj2004 . These features are well reproduced in the observation that the peak widths of the -dangling bond state and the edge state peaks are much smaller than that of the peak. The experimental finding that the edge state has the width slightly wider than the -dangling bond is in good accordance with theoretical indication showing that it spreads along the zigzag edge carbon atoms jpsj2004 . The difference in the electronic features between the edge state and -dangling bond state has also been confirmed experimentally by the presence/absence of exchange interaction in the edge-state spins/-dangling bond spins jpsj2001 . The lower energy of the edge-state peak than the -dangling bond state peak is due to the strong and weak screening of the core hole for the former and latter, respectively; the larger local density of states at carbon atoms of zigzag edges, at which the edge states are populated, and the smaller local density of states of the -dangling-bond carbon atoms, at which -electron are absent jpc2011 .
Finally, we should note the importance of the combination of magnetic susceptibility and NEXAFS analyses in investigating the magnetic properties of F-ACFs, in which two types of localized spins coexist; edge state spins and -dangling bond spins. It is difficult to distinguish the spin species independently only by the magnetic measurement, whereas NEXAFS provides the relative density of states of the edge state and dangling bond states ass . Therefore, the combined analysis can allow us to estimate the magnetic moments of edge-state spins and -dangling bond spins using multivariable analysis. The total density of magnetic moments () of sample is given as
| (1) |
where the () and ( ) are the density and the magnetic moment, respectively, of the edge state (-dangling bond state). The and were obtained by minimizing
| (2) |
where was the number of samples. and were, thus, given by
| (3) |
and
| (4) |
respectively. The relative density of the edge state () and dangling bond state () were evaluated by the integrated peak intensity of the corresponding peaks in the NEXAFS spectrum of each fluorinated sample . Using obtained by the SQUID measurement, the ratio of the magnetic moments of the edge state to dangling bond state was determined to be as shown in Fig. 5(d). The magnetic moment of the edge state was smaller than that of the dangling bond state, in good agreement with theoretical prediction which gives an estimate of the magnetic moments of the edge state and the dangling bond state as 0.5 and 1, respectively prb2007 . The fractional magnetic moment of the edge state spin is associated with the itinerant nature of the edge-state electrons, whereas the localized nature of the dangling bond is responsible for non-fractional moment of 1.
V CONCLUSIONS
We investigated the electronic structure of ACFs and fluorinated ACFs using NEXAFS whose results were complementary to the magnetic measurement results of the same samples. From the NEXAFS spectra, the edge state, which is proved to have localized spins by the magnetic measurements, is suggested to exist below the peak of ACFs in NEXAFS. Upon fluorination, the intensity of the edge state peak and peak decreased monotonically. An extra peak appeared for ACF in the region of F/C=0.41. The intensity of this extra peak closely correlated with the fluorine concentration dependence of the localized spin concentration, which confirmed the existence of the magnetic -dangling bond state for the fluorinated ACFs. The experimental findings obtained by the combination of electronic (NEXAFS) and magnetic techniques importantly confirm the coexistence of the magnetic -edge state and -dangling bond state, the former and latter of which have itinerant and localized nature, respectively.
VI ACKNOWLEDGMENTS
The present work was performed under the approval of PF-PAC (No. 2009G022, 2010G036). The authors are grateful for the financial support from MEXT (the Grant-in-Aid for Scientific Research No. 20001006). We would like to express our sincere gratitude to Prof. K. Terakura at JAIST for the stimulating discussion.
References
- (1) D. J. E. Ingram and J. E. Bennett, Phil. Mag. 45, 545 (1954).
- (2) T.L. Makarova and F. Palacio, Carbon Based Magnetism (Elsevier, 2006).
- (3) H. Castro Neto, F. Guinea N. M. R. Peres K. S. Novoselov and A. K. Geim, Rev. Mod. Phys. 81, 109 (2009).
- (4) T . Enoki and K. Takai, Solid State Commun. 149, 1144 (2009).
- (5) M. Fujita, K. Wakabayashi, K. Nakada and K. Kusakabe, J. Phys. Soc. Jpn. 65, 1920 (1996).
- (6) K. Wakabayashi, M. Sigrist, and M. Fujita, J. Phys. Soc. Jpn. 67, 2089 (1998)
- (7) Y. Kobayashi, K. Fukui, T. Enoki, K. Kusakabe, and Y. Kaburagi, Phys. Rev. B 71, 193406 (2005).
- (8) K. Sakai, K. Takai, K. Fukui, T. Nakanishi, and T. Enoki Phys. Rev. B C81, 235417 (2010).
- (9) Y. Niimi, T. Matsui, H. Kambara, K. Tagami, M. Tsukada, and H. Fukuyama, Phys. Rev. B 73, 085421 (2006).
- (10) S. Entani, S. Ikeda, M. Kiguchi, K. Saiki, G. Yoshikawa, I. Nakai, H. Kondoh, and T. Ohta, Appl. Phys. Lett. 88, 153126 (2006).
- (11) K. Suenaga and M. Koshino, Nature 468, 1088 (2010).
- (12) Y. Shibayama, H. Sato, and T. Enoki, Phys. Rev. Lett. 84, 1744 (2000)
- (13) P. Esquinazi, D. Spemann, R. Ho Nhne, A. Setzer, K.-H. Han, and T. Butz, Phys. Rev. Lett. 91, 227201 (2003)
- (14) V. L. J. Joly, M. Kiguchi, S. Hao, K. Takai, T. Enoki et al., Phys. Rev. B 81, 245428 (2010).
- (15) O. V. Yazyev and L. Helm, Phys. Rev. B 75, 125408 (2007).
- (16) K. Takai, H. Sato, T. Enoki, N. Yoshida, F. Okino, H. Touhara, M. Endo, J. Phys. Soc. Jpn. 70, 175 (2001).
- (17) J. Stohr, NEXAFS Spectroscopy (Springer, New York, 1991).
- (18) G. U. Sumanasekera, G. Chen, K. Takai, V. L. J. Joly, N. Kobayashi, T. Enoki and P. C. Eklund, J. Phys. Cond. Matt. 22, 334208 (2010).
- (19) J. Takashiro et al., Private communication.
- (20) We assume that the center of the edge state or dangling bond state is positioned at the Fermi level, that is, the density of states for the occupied state is equal to that for the unoccupied state. We also assume that the transition moments from C 1s to , edge state, and dangling bond states are equal to each other.
- (21) K. Seki, R. Mitsumoto, E. Ito, Eisuke , T. Araki, et al., Mol. Cryst. Liq. Cryst. 355, 247 (2001).
- (22) R. Saito, M. Yagi, T. Kimura, G. Dresselhaus, M.S. Dresselhaus, J. Phys. Chem. Sol. 60, 715 (1999).
- (23) M. Maruyama and K. Kusakabe, J. Phys. Soc. Jpn. 73, 656 (2004).
- (24) Z. Hou, X. Wang, T. Ikeda, S. Huang, K. Terakura et al., J. Phys. Chem. C, in press.