Clustering of Color Sources and the Shear Viscosity of the QGP in Heavy Ion collisions at RHIC and LHC Energies
Abstract
We present our results on the shear viscosity to entropy ratio () in the framework of the clustering of the color sources of the matter produced at RHIC and LHC energies. The onset of de-confinement transition is identified by the spanning percolating cluster in 2D percolation. The relativistic kinetic theory relation for is evaluated using the initial temperature() and the mean free path (). The analytic expression for covers a wide temperature range. At 150 MeV below the hadron to QGP transition temperature of 168 MeV, with increasing temperatures the value drop sharply and reaches a broad minimum 0.20 at 175-185 MeV. Above this temperature grows slowly. The measured values of are 0.2040.020 and 0.2620.026 at the initial temperature of 193.63 MeV from central Au+Au collisions at = 200 GeV (RHIC) and 262.2 13 MeV in central Pb+Pb collisions at = 2.76 TeV (LHC). These values are 2.5 and 3.3 times the AdS/CFT conjectured lower bound but are consistent with theoretical estimates for a strongly coupled QGP.
pacs:
12.38.Mh; 25.75.NqI Introduction
The observation of the large elliptic flow at RHIC in non-central heavy ion collisions suggest that the matter created is a nearly perfect fluid with a very low shear viscosity brahms ; phobos ; star ; phenix . Recently, attention has been focused on the shear viscosity to entropy density ratio as a measure of the fluidity teaney ; teaney1 ; lacey ; rom . The observed temperature averaged , based on viscous hydrodynamics analyses of RHIC data, are suggestive of a strongly coupled plasma gul1 ; larry . The effect of the bulk viscosity is expected to be negligible. It has been conjectured, based on infinitely coupled super-symmetric Yang-Mills (SYM) gauge theory using the correspondence between Anti de-Sitter(AdS) space and conformal field theory (CFT), that the lower bound for is and is the universal minimal viscosity to entropy ratio even for QCD kss . However, there are theories in which this lower bound can be violated buchel . In this work, we use the color string percolation model (CSPM) pajares1 ; pajares2 to obtain as a function of the temperature above and below the hadron to QGP transition. The measured values are for Au+Au collisions at = 200 GeV at RHIC and for Pb+Pb collisions at = 2.76 TeV at LHC.
II Clustering of Color Sources
Multiparticle production is currently described in terms of color strings stretched between the projectile and the target, which decay into new strings and subsequently hadronize to produce observed hadrons. Color strings may be viewed as small areas in the transverse plane filled with color field created by colliding partons. With growing energy and size of the colliding system, the number of strings grows, and they start to overlap, forming clusters, in the transverse plane very much similar to disks in two dimensional percolation theory. At a certain critical density a macroscopic cluster appears that marks the percolation phase transition. This is the Color String Percolation Model (CSPM) pajares1 ; pajares2 . The interaction between strings occurs when they overlap and the general result, due to the SU(3) random summation of charges, is a reduction in multiplicity and an increase in the string tension hence increase in the average transverse momentum squared, . We assume that a cluster of strings that occupies an area of behaves as a single color source with a higher color field corresponding to the vectorial sum of the color charges of each individual string . The resulting color field covers the area of the cluster. As , and the individual string colors may be oriented in an arbitrary manner respective to each other , the average is zero, and .
Knowing the color charge one can obtain the multiplicity and the mean transverse momentum squared of the particles produced by a cluster of strings pajares2
| (1) |
where and are the mean multiplicity and of particles produced from a single string with a transverse area . For strings just touching each other , and , . When strings fully overlap, and therefore and , so that the multiplicity is maximally suppressed and the is maximally enhanced. This implies a simple relation between the multiplicity and transverse momentum , which means conservation of the total transverse momentum produced.
In the thermodynamic limit, one obtains an analytic expression pajares1 ; pajares2
| (2) |
where is the color suppression factor. With as and as , where is the percolation density parameter. Eq.(1) can be written as and . The critical cluster which spans , appears for 1.2 satz1 . It is worth noting that CSPM is a saturation model similar to the Color Glass Condensate (CGC), where plays the same role as the saturation momentum scale in the CGC model cgc ; perx .
III Experimental Determination of the Color Suppression Factor
The suppression factor is determined by comparing the and A+A transverse momentum spectra. To evaluate the initial value of from data for Au+Au collisions, a parameterization of events at 200 GeV is used to compute the distribution nucleo ; levente ; eos
| (3) |
where a is the normalization factor. and are parameters used to fit the data. This parameterization also can be used for nucleus-nucleus collisions to take into account the interactions of the strings pajares2
| (4) |
The color suppression factor is related to the percolation density parameter .
| (5) |
In pp collisions 1 at these energies due to the low overlap probability.
In this way the STAR analysis of charged hadrons obtained the preliminary results for the percolation density parameter, at RHIC for several collisions systems as a function of centrality nucleo . Figure 1 shows a plot of as a function of charged particle multiplicity per unit transverse area for Au+Au collisions at 200 GeV for various centralities for the STAR data levente ; eos . The error on is . decreases in going from peripheral to central collisions. The value is obtained using Eq. (5), which increases with the increase in centrality. The fit to the Au+Au points has the functional form
| (6) |
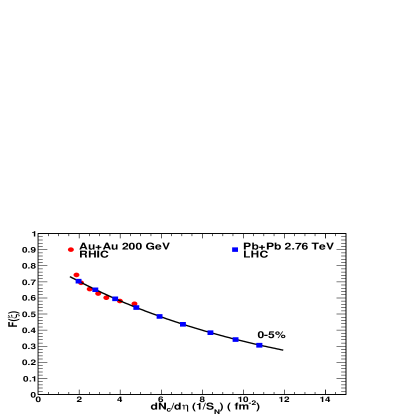
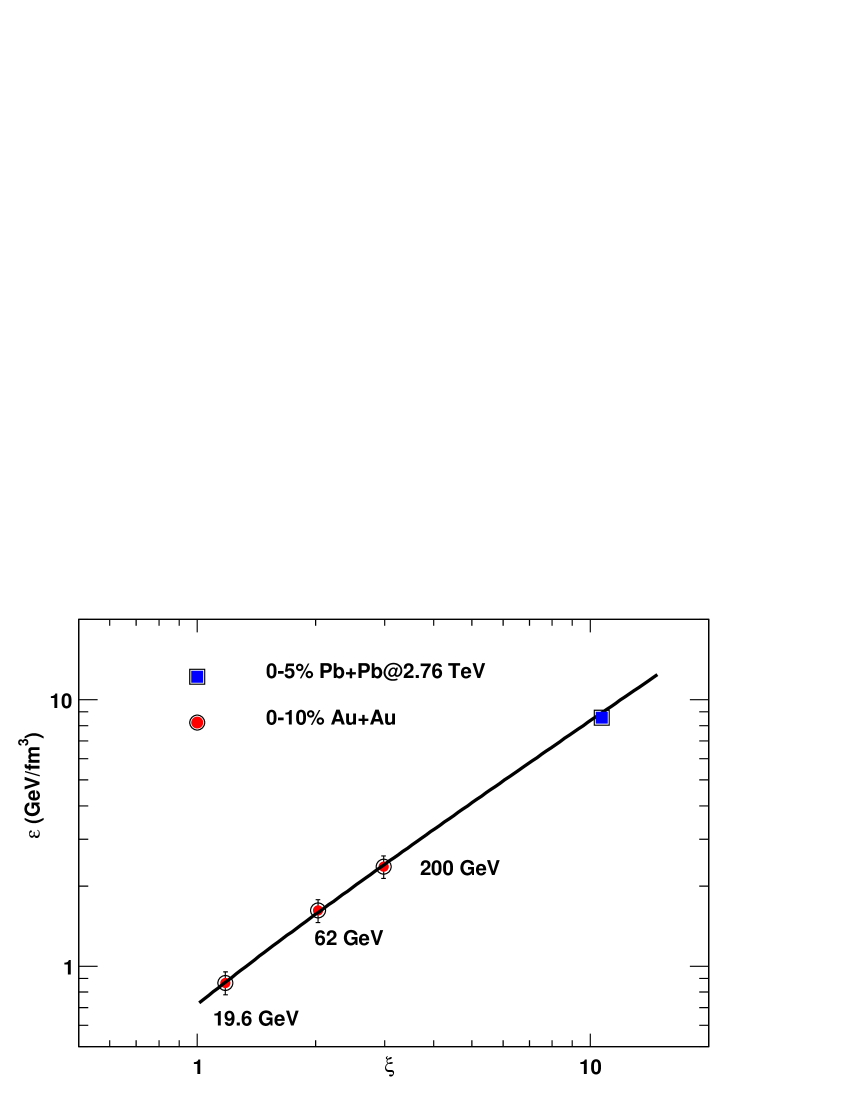
The STAR results for Au+Au collisions at = 200 GeV can be used to estimate F values for Pb+Pb collisions at different centralities using the fit function given by Eq.(6) for Au+Au. Recently, the ALICE experiment at LHC published the charged-particle multiplicity density data as a function of centrality in Pb+Pb collisions at = 2.76 TeV alice1 . The ALICE data points are shown in Fig.1. For central 0-5 in Pb+Pb collisions = 10.56 as compared to = 2.88 for central Au+Au collisions at 200 GeV. For Au+Au central collisions we have found that the Bjorken energy density in the collision is proportional to . To evaluate the charged pion multiplicity at mid rapidity and the Schwinger QED2 production time were used eos ; bjorken . Figure 2 shows a plot of energy density as a function of . for the range 1.2 . The extrapolated value of for central Pb+Pb collision at 2.76 TeV is 8.32 as shown in Fig.2.
IV Determination of the Temperature
The connection between the measured and the temperature involves the Schwinger mechanism (SM) for particle production. The Schwinger distribution for massless particles is expressed in terms of swinger ; wong
| (7) |
where the average value of the string tension is . The tension of the macroscopic cluster fluctuates around its mean value because the chromo-electric field is not constant. The origin of the string fluctuation is related to the stochastic picture of the QCD vacuum. Since the average value of the color field strength must vanish, it can not be constant but changes randomly from point to point bialas . Such fluctuations lead to a Gaussian distribution of the string tension for the cluster, which transforms SM into the thermal distribution bialas
| (8) |
with = .
The temperature is expressed as pajares3
| (9) |
Recently, it has been suggested that fast thermalization in heavy ion collisions can occur through the existence of an event horizon caused by a rapid de-acceleration of the colliding nuclei khar2 . The thermalization in this case is due to the Hawking-Unruh effect hawk ; unru . In CSPM the strong color field inside the large cluster produces de-acceleration of the primary pair which can be seen as a thermal temperature by means of the Hawking-Unruh effect. The string percolation density parameter which characterizes the percolation clusters measures the initial temperature of the system. Since this cluster covers most of the interaction area, this temperature becomes a global temperature determined by the string density. In this way at = 1.2 the connectivity percolation transition at models the thermal deconfinement transition.
We adopt the point of view that the experimentally determined universal chemical freeze-out temperature () is a good measure of the phase transition temperature, braunmun . is evaluated using Eq.(9) at = 1.2 with = 167.7 2.6 MeV bec1 . This gives = 207.2 3.3 MeV which is close to 200 MeV used in a previous calculation of the percolation transition temperature pajares3 . This calibrates the CSPM temperature scale. The dynamics of massless particle production has been studied in QED2 quantum electrodynamics. QED2 can be scaled from electrodynamics to quantum chromodynamics using the ratio of the coupling constants. Here the production time for a boson (gluon) is wong . This gives 1.13 fm for central Au+Au collisions at 200 GeV. The temperature obtained using Eq. (9) was 193.6 MeV for Au+Au collisions. For Pb+Pb collisions the temperature is 262.2 MeV for 0-5 centrality, which is expected to be 35 higher than the temperature from Au+Au collisions eos . A recent summary of the results from Pb+Pb collisions at the LHC has mentioned that the initial temperature increases at least by 30 as compared to the top RHIC energy summ . Table I gives the CSPM values , , and at =0.88, 1, 1.16 and 1.57.
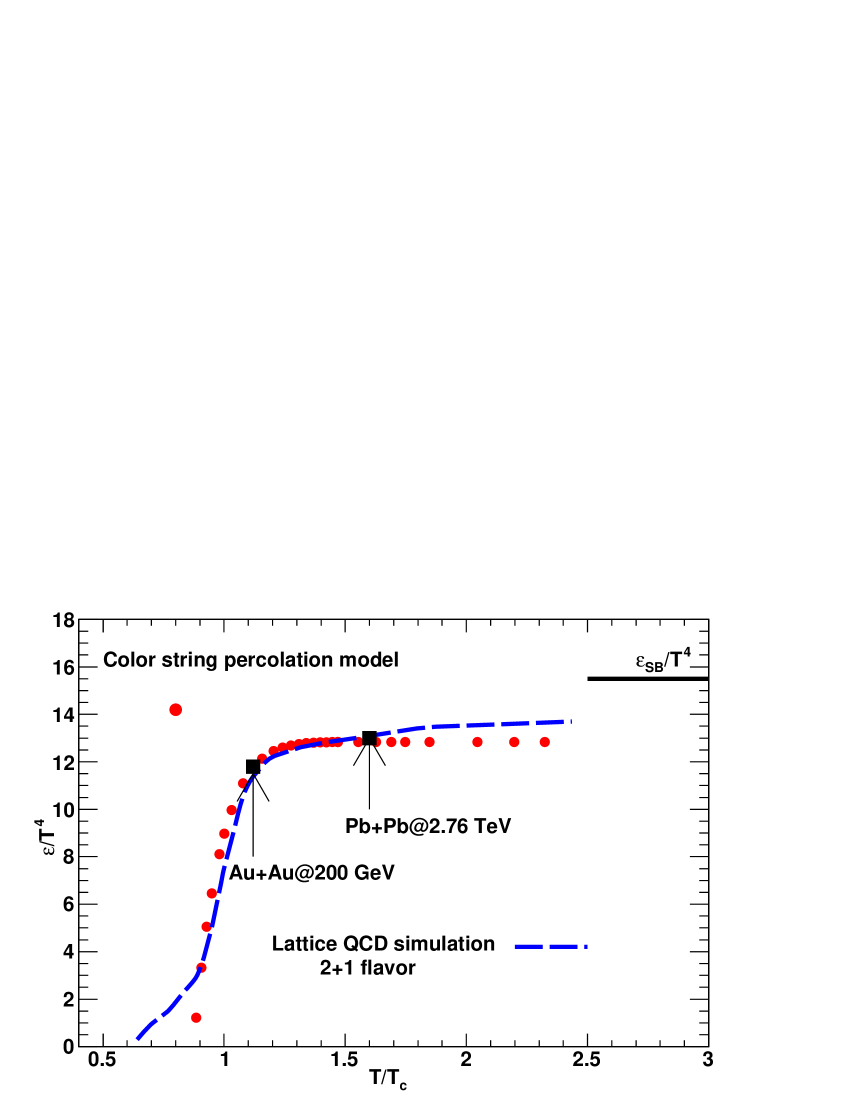
One way to verify the validity of extrapolation from RHIC to LHC energy is to compare the energy density expressed as with the available lattice QCD results. Figure 3 shows a plot of as a function of T/. The lattice QCD results are from HotQCD Collaboration hotqcd . It is observed that at LHC energy the CSPM results are in excellent agreement with the lattice QCD results. The lattice and CSPM results are available for T/.
V Shear Viscosity
The relativistic kinetic theory relation for the shear viscosity over entropy density ratio, is given by gul1 ; gul2
| (10) |
where T is the temperature and is the mean free path given by
| (11) |
is the number density of an ideal gas of quarks and gluons and the transport cross section for these constituents.
After the cluster is formed it behaves like a free gas of constituents. Eq. (10) can be applied to obtain the shear viscosity. In CSPM the number density is given by the effective number of sources per unit volume
| (12) |
L is the longitudinal extension of the source, L = 1 pajares3 . The area occupied by the strings is related to through the relation . Thus the effective no. of sources is given by the total area occupied by the strings divided by the effective area of the string .
| (13) |
In general is smaller than the number of single strings. equals the number of strings in the limit of = 0. The number density of sources from Eqs. (12) and (13) becomes
| (14) |
In CSPM the transport cross section is the transverse area of the effective string . Thus is directly proportional to and hence to . The mean free path is given by
| (15) |
For a large value of the reaches a constant value. is obtained from and the temperature
| (16) |
Well below , as the temperature increases, the string density increases and the area is filled rapidly and and decrease sharply. Above , more than 2/3 of the area are already covered by strings, and therefore the area is not filling as fast and the relatively small decrease of is compensated by the rising of temperature, resulting in a smooth increase of . The behavior of is dominated by the fractional area covered by strings. This is not surprising because is the ability to transport momenta at large distances and that has to do with the density of voids in the matter.
VI Results and Discussion
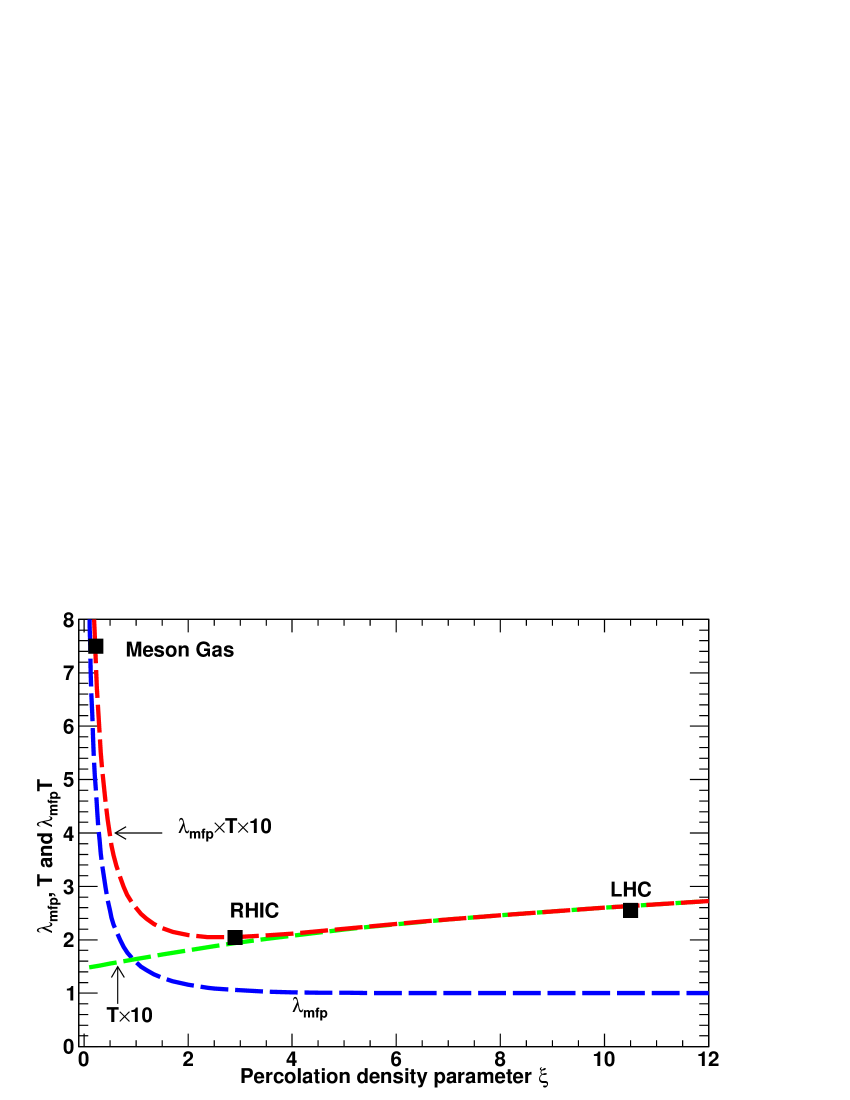
Figure 4 shows a plot of , and as a function of . Thus the product T() will have a minimum in . It has been shown that has a minimum at the critical point for various substances for example helium, nitrogen and water larry . Thus the measurement of as a function of temperature can indicate the critical point in the QCD phase diagram with 175-185 MeV.
| System | T (MeV) | |||
|---|---|---|---|---|
| Meson Gas | 0.22 | 150.0 | - | 0.76 |
| Hadron to QGP | 1.2 | 167.7 | 0.94 | 0.240 |
| Au+Au | 2.88 | 193.6 | 2.27 | 0.204 |
| Pb+Pb | 10.56 | 262.2 | 8.32 | 0.260 |
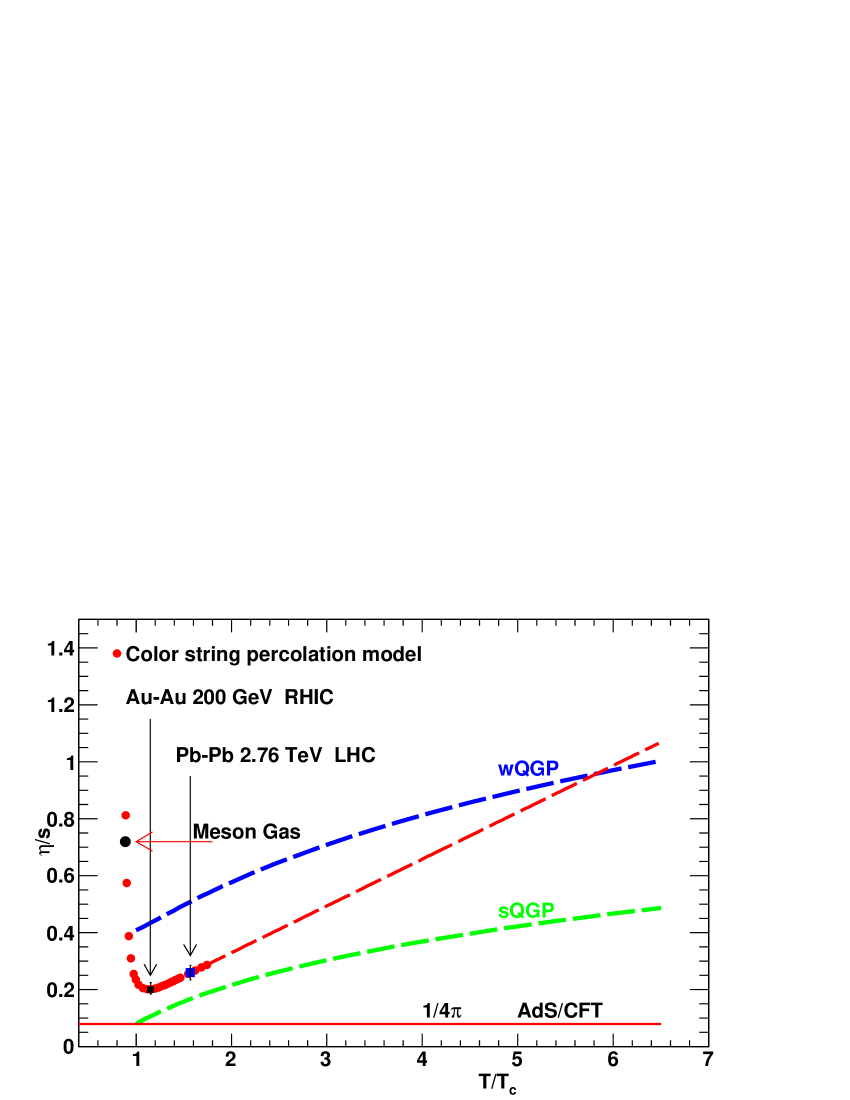
Figure 5 shows a plot of as a function of T/. The estimated value of for Pb+Pb is also shown in Fig. 5 at T/ = 1.57. The lower bound shown in Fig. 5 is given by AdS/CFT kss . These results from STAR and ALICE data show that the value is 2.5 and 3.3 times the KSS bound kss .
The theoretical estimates of has been obtained as a function of T/ for both the weakly (wQGP) and strongly (sQGP) coupled QCD plasma are shown in Fig. 5 gul1 . It is seen that at the RHIC top energy is close to the sQGP. Even at the LHC energy it follows the trend of the sQGP. By extrapolating the CSPM values to higher temperatures it is clear that could approach the weak coupling limit near 5.8. The CSPM value for the hadron gas is in agreement with the calculated value using measured elastic cross sections for a gas of pions and kaons prakash . has also been obtained in several other calculations for pure glue matter toneev , in the semi quark qluon plasma hidaka and in quasiparticle description bluhm . In pure SU(3) gluodynamics a conservative upper bound for was obtained = 0.134(33) at meyer . In the quasiparticle approach also low 0.2 is obtained for T and rises very slowly with the increase in temperature peshier . In CSPM also grows with temperature as 0.16T/.
The CSPM model calculations have also successfully described the elliptic flow and the nuclear modification factor at RHIC and LHC energies bautista . In addition CSPM has determined the equation of state of the QGP and the bulk thermodynamic value of and in excellent agreement with Lattice Gauge calculations eos . This emphasizes the quantitative nature of the CSPM when applied to the data at 1 TeV scale.
VII Summary
In summary the relativistic kinetic theory relation for shear viscosity to entropy density ratio was evaluated as a function of the temperature using the measured transverse momentum spectra and the Color String Percolation Model. The color suppression factor was extracted from the transverse momentum spectrum of charged hadrons. We found = 0.204 at = 1.15 ( RHIC ) and =0.260 at = 1.57 (LHC). In the phase transition region is 2-3 times the conjectured quantum limit for RHIC to LHC energies. The whole picture is consistent with the formation of a fluid with a low shear to viscosity ratio. The percolation framework provides us with a microscopic picture which predicts the early thermalization required for hydrodynamical calculations.
The minimum in can be studied as a function of the beam energy at RHIC that could locate the critical point/crossover in the QCD phase diagram seen in substances like helium, nitrogen and water teaney1 ; larry . The accurate determination of is also important for the evaluation of another transport coefficient, the jet quenching parameter muller ; wang .
VIII Acknowledgement
This research was supported by the Office of Nuclear Physics within the U.S. Department of Energy Office of Science under Grant No. DE-FG02-88ER40412.
J.D.D. thanks the support of the FCT/Portugal project PPCDT/FIS/575682004. C.P. was supported by the project FPA2011-022776 of MICINN the Spanish Consolider Ingenio 2010 program CPAN and Conselleria Education Xunta de Galicia.
References
- (1) I. Arsene et al., (BRAHAMS Collaboration), Nucl. Phys. A757, (2005) 1.
- (2) B. B. Back et al., (PHOBOS Collaboration), Nucl. Phys. A757, (2005) 28.
- (3) J. Adams et al., (STAR Collaboration), Nucl. Phys. A757, (2005) 102.
- (4) K. Adcox et al., (PHENIX Collaboration), Nucl. Phys. A757, (2005) 184.
- (5) D. Teaney, Phys. Rev. C68, (2003) 034913.
- (6) T. Schafer and D. Teaney, Rep. Prog. Phys. C72, (2009) 126001.
- (7) R. A. Lacey et al., Phys. Rev. Lett. 98, (2007) 092301.
- (8) P. Romatschke and U. Romatschke, Phys. Rev. Lett. 99, (2007) 272301.
- (9) T. Hirano and M. Gyulassy, Nucl. Phys. A769, (2006) 71.
- (10) L. P. Csernai, J. I. Kapusta and L. D. McLerran Phys. Rev. Lett. 97, (2006) 152303.
- (11) P. K. Kovtun, D. T. Son and A. O. Starinets, Phys. Rev. Lett. C94, (2005) 111601.
- (12) A. Buchel, R. C. Myers and A. Sinha, JHEP, 03, (2009) 084.
- (13) M. A. Braun and C. Pajares, Eur. Phys. J. C16, (2000) 349.
- (14) M. A. Braun, F. del Moral and C. Pajares, Phys. Rev. C65, (2002) 024907.
- (15) H. Satz, Rep. Prog. Phys. 63, (2000) 1511.
- (16) L. McLerran and R. Venugopalan, Phys. Rev. D49, (1994) 2233;49, (1994) 3352.
- (17) J. Dias de Deus and C. Pajares, Phys. Lett. B695, (2011) 455.
- (18) B. K. Srivastava, R. P. Scharenberg and T. Tarnowsky, (STAR Collaboration), Nukleonika 51, (2006) s109.
- (19) B. I. Abelev et al., (STAR Collaboration), Phys. Rev. C79, (2009) 34909.
- (20) R. P. Scharenberg, B. K. Srivastava and A. S. Hirsch, Eur. Phys. J. C71, (2011) 1510.
- (21) K. Aamodt et al., (ALICE Collaboration), Phys. Rev. Lett. 106, (2011) 032301.
- (22) J. D. Bjorken, Phys. Rev. D27, (1983) 140.
- (23) J. Schwinger, Phys. Rev. 128, (1962) 2425.
- (24) C Y. Wong, Introduction to high energy heavy ion collisions, 289 (1994).
- (25) A. Bialas, Phys. Lett. B466, (1999) 301.
- (26) J. Dias de Deus and C. Pajares, Phys. Lett. B642, (2006) 455.
- (27) D. Kharzeev, E. Levin and K. Tuchin , Phys. Rev. C75, (2007) 044903.
- (28) S. W. Hawking, Commun. Math. Phys. 43, (1975) 199.
- (29) W. G. Unruh, Phys. Rev. D14, (1976) 870.
- (30) P. Braun-Munzinger, J. Stachel and Christof Wetterich, Phys. Lett. B596,(2004) 61.
- (31) F. Becattini, P. Castorina, A. Milov and H. Satz, Eur. Phys. J. C66, (2010) 377.
- (32) B. Muller, J. Schukraft and W. Wyslouch, arXiv:hep-exp/1202.3233.
- (33) A. Bazavov et al., Phys. Rev. D80, (2009) 014504.
- (34) P. Danielewicz and M. Gyulassy, Phys. Rev. D31, (1985) 53.
- (35) D. Teaney in QGP4, page 207, Eds. R. C. Hwa and X. N. Wang, World scientific (2010).
- (36) M. Prakash et al., Phys. Rept.227 , (1993) 321.
- (37) A. S. Khvorostukhin, V. D. Toneev and D. N. Voskresensky, Phys. Rev. C83, (2011) 035204.
- (38) Y. Hidaka and R. D. Pisarski, Phys. Rev. D81, (2010) 076002.
- (39) M. Bluhm, B. Kampfer and K. Redlich, arXiv:hep-ph/1011:5634.
- (40) H. B. Meyer, Phys. Rev. D76, (2007) 101701(R).
- (41) A. Peshier and W. Cassing, Phys. Rev. Lett.94, (2005) 172301.
- (42) I. Bautista, J. Dias de Deus and C. Pajares, arXiv:hep-ph/1102:3837.
- (43) A. Majumder, B. Muller and Xin-Nian Wang, Phys. Rev. Lett.99, (2007) 192301.
- (44) J. Casalderrey-Solana and Xin-Nian Wang, Phys. Rev. C77, (2008) 024902.