Microwave Observations of Edge-on Protoplanetary Disks: Program Overview and First Results
Abstract
We are undertaking a multi-frequency Expanded Very Large Array (EVLA) survey of edge-on protoplanetary disks to probe the growth of solids in each disk, sedimentation of such material into the disk midplane, and the connection of these phenomena to the planet formation process. The projection of edge-on disk systems along our line of sight enables a study of the vertical stratification of large grains with fewer model dependencies than would be required for disks that are more face-on. Robust studies of the spatial distribution of grains up to 1 cm in size are possible with the wavelength range and sensitivity of the EVLA. In this contribution we describe target selection and observational strategies. First results concerning the Class 0 source IRAS 04368+2557 (L1527 IRS) are presented, including a study of this source’s 8.46 GHz continuum variability over short and long time baselines and an indication that its protoplanetary disk may have a dearth of pebble-sized grains.
1 Introduction
Both major contending theories of planet formation, core accretion and gravitational instability, require collection of solid material into a dense mid-plane layer within circumstellar disks (e.g., Pollack et al., 1996; Boss, 1997; Schräpler & Henning, 2004, and references therein). To understand this first stage in the generation of planetary embryos we must determine the necessary conditions for grain sedimentation and if the relevant physical processes act uniformly with particle size. Numerical simulations incorporating gas drag and stellar gravity predict that larger grains are expected to settle into the disk mid-plane more efficiently than smaller grains (e.g., Barrière-Fouchet et al., 2005; Laibe et al., 2008). However, these simulations predict extremely short timescales for the growth and migration of dust particles that are inconsistent with observations, suggesting that some additional disk physics needs to be included (see Brauer et al. 2007). Observational results, and modeling thereof (e.g., Duchêne et al., 2003; Pinte et al., 2007), have begun to lay the foundation for grain sedimentation and its relation to grain growth, providing evidence in support of larger grains being more concentrated towards the disk mid-plane. Although these works hint that grain growth, radial migration, and sedimentation are intimately connected, observations that resolve the spatial distribution of large grains are necessary to complete this picture.
Study of the largest dust grains and their spatial distribution requires observations at long wavelengths (commensurate with grain size; e.g., Natta et al. 2004; Wilner et al. 2005; Rodmann et al. 2006; Lommen et al. 2009). Unambiguous grain vertical distribution information can only come from protoplanetary disks which are edge-on to our line of sight (Section 2). Edge-on protoplanetary disk systems imaged in scattered light typically subtend 0.3-3′′ in the vertical direction (see Table Microwave Observations of Edge-on Protoplanetary Disks: Program Overview and First Results references). To identify vertical grain stratification, thermal emission from disk atmosphere grains must be separated from that of grains settled to the disk mid-plane with high angular resolution observations. Hence, to study the vertical distribution of large grains, one must map edge-on disk systems with a long-baseline radio interferometer such as the NRAO111The National Radio Astronomy Observatory is a facility of the National Science Foundation operated under cooperative agreement by Associated Universities, Inc. Expanded Very Large Array (EVLA; Perley et al. 2011).
In this contribution we present an EVLA survey of edge-on protoplanetary disk systems. Target selection and observations are discussed, and first results on the source IRAS 04368+2557 are reported.
2 Sample Definition
Edge-on disks are selected because of their favorable geometry: each beam of an edge-on disk map samples a single disk altitude. From spectral index maps of edge-on disk systems we will measure the maximum grain size per synthesized beam and hence the vertical distribution of grains as a function of grain size. Some assumptions regarding disk axisymmetry may be necessary to delineate optical depth effects from true grain size variation, especially near the disk mid-plane (see also discussion in Section 4.3).
We arbitrarily restrict our sample to disks with inclination angle 75∘ (where 0∘ is face-on to our line of sight) to limit confusion between radial and altitude flux variations. All sources in our sample have been selected based on the existence of scattered light images that allow a determination of the disk inclination to a few degrees. Ultimately, such a sample will enable more powerful global panchromatic analyses (e.g., Pinte et al., 2008; Duchêne et al., 2010).
Disk systems observed in the first EVLA observing cycle are listed in Table Microwave Observations of Edge-on Protoplanetary Disks: Program Overview and First Results.
3 Observational Strategy
Preliminary observations aim to identify microwave-bright disks for future mapping and to characterize the overall degree of grain growth for each disk system based on measurement of their long-wavelength opacity index (where β). The value of provides information on the size of grains relative to the observing wavelength, where 1 indicates grains comparable to or larger than the observing wavelength (e.g., Beckwith et al. 1990; Mannings & Emerson 1994; Rodmann et al. 2006; Lommen et al. 2009; Ricci et al. 2010; Section 4.3 discusses how disk optical depth affects the determination of ). These goals require total power measurements (i.e., unresolved disk measurements) which are best done in compact array configurations.
Disk flux measurements are made at 7 and 13 mm. Robust measurement of the opacity index requires removing emission from processes other than dust thermal emission. Young stellar objects are known to emit in the microwave due to free-free emission from ionized jets and disk-winds and gyrosynchrotron emission from coronal processes (see e.g., Osten & Wolk 2009, and references therein). Previous works have shown that free-free and gyrosynchrotron emission (hereafter non-disk emission) can contaminate the 7-13 mm wavelength region at a level that is anywhere from 0-100% of the detected flux (e.g., Natta et al., 2004; Rodmann et al., 2006). It is assumed that measurements longward of 20 mm are probing only non-disk emission (this is not always the case; see Wilner et al. 2005). We perform observations at both 35 and 60 mm so that there are two data points with which to determine the spectral slope of non-disk emission components.
Non-disk emission is known to be variable (e.g., Osten & Wolk, 2009). Proper removal of this variable emission requires observations of the non-disk component that are as close in time as possible to observations of the disk component. To obtain quasi-simultaneous observations across all bands, we intertwined scans at 7, 13, 35, and 60 mm within a continuous observing block (which can span 3-5 hours; see Table 2). Although these disk and non-disk measurements are not perfectly simultaneous, the assumption is that averaging 35 and 60 mm scans taken over the entire observing block will yield an accurate measurement of the non-disk emission component during 7 and 13 mm scans. We test this strategy in Section 4.2.
4 Case Study: IRAS 04368+2557
Of the 11 sources observed in the first EVLA cycle, 9 were detected (Table Microwave Observations of Edge-on Protoplanetary Disks: Program Overview and First Results). In this section observations of IRAS 04368+2557 (L1527 IRS) are presented as a case study of the methodologies outlined above.
IRAS 04368+2557 is an embedded class 0 object in the L1527 dark cloud in Taurus (White & Hillenbrand, 2004). Although optically faint (e.g., White & Hillenbrand 2004), IRAS 04368+2557 is bright in the sub-millimeter (Chandler & Richer, 2000; Andrews & Williams, 2005), millimeter (Ohashi et al., 1997; Motte & André, 2001), and microwave (Rodríguez & Reipurth, 1998; Loinard et al., 2002). Millimeter and sub-millimeter results to date show that IRAS 04368+2557 is composed of a substantial envelope that is infalling onto the central source (Ohashi et al., 1997; Chandler & Richer, 2000; Motte & André, 2001; Andrews & Williams, 2005). VLA imaging detects jet emission emanating from the central protostar (Rodríguez & Reipurth, 1998; Reipurth et al., 2004) and provides evidence of a 24 AU binary companion (Loinard et al., 2002). The disk surrounding the central source is probed most recently by Tobin et al. (2010) who present 3.78 m imaging that resolves the inner envelope and disk structure of IRAS 04368+2557. The only unambiguous detection of disk thermal emission comes from Loinard et al. (2002) who resolve the disk at 7 mm. Our observations provide the first nearly simultaneous, multiband, compact configuration radio frequency observations of IRAS 04368+2557.
4.1 Observations
IRAS 04368+2557 was observed with all 27 EVLA antennas. Some details of the observations are given in Table 2. The WIDAR correlator was set up with two 128 MHz sub-bands centered on the frequencies listed in Table 2. Each sub-band had 4 polarization products (RR, LL, RL, LR) and sixty-four 2000 kHz channels. Observations at 7 and 13 mm were performed in “fast-switching” mode; target source scans were interleaved with frequent visits to a nearby calibration source to freeze out rapid atmospheric phase fluctuations. Cycle times of 2 and 4 minutes were used for 7 and 13 mm, respectively. The primary calibration source 3C286 was used to measure the complex bandpass and to set the absolute flux scale.
To probe the stability of the non-disk emission component over long and short time baselines we retrieved VLA archival 35 mm observations of IRAS 04368+2557 (see Table 2). To maintain homogeneity in this data set we only use observations performed with all VLA antennas. VLA observations were made in both circular polarizations with an effective bandwidth of 92 MHz centered at a frequency of 8.46 GHz. Data from AR0350 and AR0465 are presented in Rodríguez & Reipurth (1998) and Reipurth et al. (2004), respectively. All other data are unpublished to the best of our knowledge. While our reductions agree well with those of Rodríguez & Reipurth (1998), we find a significantly lower flux density for IRAS 04368+2557 than do Reipurth et al. (2004). Further investigation shows that our measurement is consistent with what is displayed in Figure 2 of Reipurth et al. (2004), but that this and our measurement are both inconsistent with what is listed in their Table 2.
All data are reduced using the Astronomical Image Processing Software (AIPS; Greisen 2003). VLA data are edited and calibrated following standard VLA data reduction procedures. EVLA data are edited and calibrated in a similar manner, except for the addition of first pass fringe fitting to set the interferometer delays (performed on the primary calibrator, 3C286) and bandpass calibration. Standard high-frequency reduction techniques are employed for 7 mm data. IRAS 04368+2557 is detected at all observed frequencies with 10 significance. We assume absolute flux density scale systematic uncertainties of 15% and 5% for 7 and 13 mm, respectively; these are included in the Table 2 uncertainties. Absolute flux densities for 35 and 60 mm are assumed to be limited by the rms noise level in CLEANed maps. Figure 1 shows contour maps from the EVLA data; IRAS 04368+2557 is not resolved in any of the EVLA images.
4.2 Centimetric Variability
Figure 2 presents 35 mm measurements of IRAS 04368+2557 from each epoch listed in Table 2. Inter-epoch measurements are made by imaging all data obtained in the time interval listed for that epoch. Intra-epoch measurements are made by imaging the smallest time interval that yields an 10 detection of IRAS 04368+2557.
Except for the 2002 data, no significant (3) inter-epoch variability is detected. The 2002 observations were done with the most extended array configuration and emission structures could have been resolved out by the widely separated baselines resulting in lower than average flux densities. Intra-epoch measurements reveal two transient events. The first is a mini-flare observed near the end of the 26 minute long UT 1997 Aug 14 scan. The second is the radio jet detected by Reipurth et al. (2004) which appears only near the end of the UT 2002 Feb 08 data set. Out of eighteen 25 minute long 35 mm IRAS 04368+2557 sequences, one exhibits a flare event and one exhibits a jet event. The occurrence rate of such events in 25 minute windows is 6% if the events are unique and 11% if they are the same phenomenon.
Compared to previous studies of young stellar object centimetric variability (e.g., Forbrich et al., 2006, 2007; Choi et al., 2008; Osten & Wolk, 2009), the results presented herein appear to agree best with the Osten & Wolk (2009) study of short and long term variability in six young stellar objects. At a wavelength of 60 mm they find that 4 out of 6 young stellar objects show short term variability and that 3 out of 6 objects show long term variability (the positive variability detections are not necessarily from the same objects in each group). Hence, their results suggest that young stellar objects appear to be just as likely to have short term variability as they are to exhibit long term variability. Such conclusions seem to contradict the results of Forbrich et al. (2006, 2007) and Choi et al. (2008), where it is found that there are generally lower levels of variability on shorter timescales. However, of the above mentioned studies, only Osten & Wolk (2009) analyze variability on intra-epoch (less than day) timescales. It could be the case that even seemingly stable sources have sporadic variability that can only be probed on the shortest timescales. If the event occurrence rate derived above for IRAS 04368+2557 is representative of stars in the same class, then such sources might exhibit short-duration flares in as many as one out of ten 25 minute observing windows. However, since less than ten sources have been probed on intra-epoch timescales, it is likely premature to extend their results to other sources. Monitoring similar to that presented here and in Osten & Wolk (2009) of new and previously studied young stellar objects can further address variability timescales and strength in a more statistical sense.
For weak flare events like those detected here, averaging over the duration of an observing block sufficiently suppresses the flare effect. Stronger flares can likely be identified by analyzing all data in a time-series fashion. No strong flares are present in the EVLA data.
4.3 Disk Emission Spectral Index
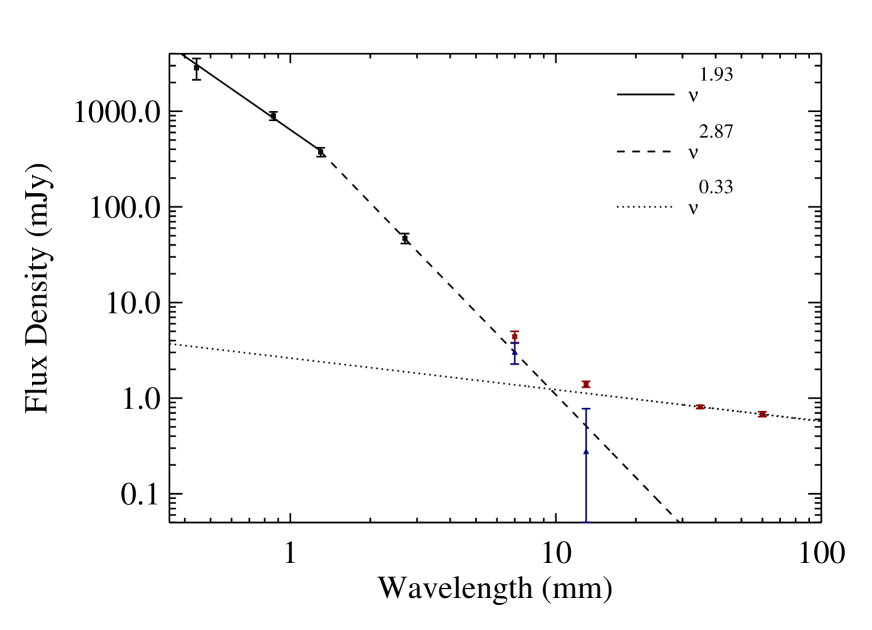
Figure 3 shows the EVLA flux measurements of IRAS 04368+2557 with literature measurements at millimeter and sub-millimeter wavelengths. The 450 and 850 m measurements (Andrews & Williams, 2005) were made with beam sizes of 9 and 15′′, respectively, while the 1.3 mm measurement (Motte & André, 2001) was made with a beam size of 11′′. The 2.7 mm measurement (Ohashi et al., 1997) was made with a synthesized beam size of 6′′ 4.9′′ (PA +163∘).
The non-disk emission component is fit with 35-60mm (where is the spectral index Fν α), consistent with non-disk indices assumed by Rodmann et al. (2006). An extrapolation of the non-disk emission fit is subtracted from 7 and 13 mm measurements; uncertainties of each flux measurement and the spectral index are propagated into the corrected flux uncertainties. We calculate for IRAS 04368+2557 0.45-1mm1.930.25 and 1-7mm2.870.17 using the corrected 7 mm flux density. We use different spectral indices for wavelengths 1 mm and 1 mm since single power-law fits to all sub-millimeter and millimeter data points are discrepant with the 450 m flux measurement at the 5 level. The spectral index from 450 m to 1.3 mm is consistent with Rayleigh-Jeans emission suggesting that the disk is opaque at these wavelengths. In the case of the 450 m to 2.7 mm measurements, there is likely contamination from extended envelope structure detected around IRAS 04368+2557 (see below and Ohashi et al., 1997; Chandler & Richer, 2000; Motte & André, 2001; Andrews & Williams, 2005). If these measurements are contaminated by envelope emission, then the disk-only 1-7mm is smaller (flatter) than the value quoted above. It is noted that the EVLA 7 mm flux measurement is roughly consistent with the total flux density estimated for the resolved structures detected by Loinard et al. (2002). This suggests that the disk structure is fairly compact (relative to the envelope structure), in agreement with scattered light images presented by Tobin et al. (2010). IRAS 04368+2557 is resolved at wavelengths shorter than 7 mm with beam sizes larger than the EVLA 7 mm synthesized beam implying that those flux measurements include envelope emission. Synthesis of the above suggests that accurate measurement of grain growth from spectral indices requires data sets having beam sizes comparable to the disk angular size when contaminating sources are present.
Extracting an opacity index from the above measured 1-7mm is complicated not only by envelope contamination but also by edge-on disk geometry. When calculating one must account for optically thick inner disk emission sampled by the flux measurements. Should no optically thick emission be present, then is simply 1-7mm2. In the case that optically thick emission is present in the measurements, takes the form of (2) where is the ratio of optically thick to optically thin emission (Beckwith et al., 1990). As discussed above, the disk orbiting IRAS 04368+2557 appears to be completely opaque out to wavelengths as long as 1 mm. Thus, significant optically thick emission may be present even at wavelengths near 10 mm. Estimates of are typically made assuming some disk mass density profile and by measuring the temperature profile from spectral indices and disk flux levels in the optically thick wavelength regime (Beckwith et al., 1990; Rodmann et al., 2006). However, Equation 10 of Beckwith et al. (1990) shows that mapping spectral indices and disk flux levels into temperature profiles is confounded when disks are nearly edge-on. Modeling of edge-on disk spectral energy distributions and resolved images can recover their true disk temperature profiles. Due to this additional modeling and envelope contamination uncertainties, we leave derivation of the opacity index for the IRAS 04368+2557 disk to future works.
The 13 mm measurement appears to fall short of the 2.87 fit after being corrected for non-disk emission. This flux deficit suggests a break in the disk emission spectral index from 7 to 13 mm, but is marginally significant. If envelope contamination is present as discussed above, then its removal would increase the significance of the deficient corrected 13 mm measurement. Comparison to other protoplanetary disk systems shows that such a break would be unusual (e.g., Wilner et al. 2005; Rodmann et al. 2006; Lommen et al. 2009) and suggestive of a cut-off near pebble-sizes in the disk grain size distribution. If these characteristics of IRAS 04368+2557 are confirmed, then there may be a connection between its potential 24 AU binary companion (Loinard et al. 2002), its apparent 7 mm outer disk truncation (Loinard et al., 2002), and its possible lack of large disk grains.
5 Conclusions
We are carrying out an Expanded Very Large Array program to map the vertical distribution of large grains in edge-on protoplanetary disks. The ultimate goal of this survey is to study grain growth and sedimentation as the first stages of planet formation. Our compact array observational strategy aims to provide accurate disk thermal emission measurements in the microwave by sampling non-disk emission in concert with disk measurements. First EVLA results for IRAS 04368+2557 show that the protoplanetary disk around this source is likely optically thick out to millimeter wavelengths and that it may have a dearth of “pebble-sized” grains.
References
- Andrews & Williams (2005) Andrews, S. M. & Williams, J. P. 2005, ApJ, 631, 1134
- Appenzeller et al. (2005) Appenzeller, I., Bertout, C., & Stahl, O. 2005, A&A, 434, 1005
- Bally et al. (1995) Bally, J., Devine, D., Fesen, R. A., & Lane, A. P. 1995, ApJ, 454, 345
- Barrière-Fouchet et al. (2005) Barrière-Fouchet, L., Gonzalez, J., Murray, J. R., Humble, R. J., & Maddison, S. T. 2005, A&A, 443, 185
- Beckwith et al. (1990) Beckwith, S. V. W., Sargent, A. I., Chini, R. S., & Guesten, R. 1990, AJ, 99, 924
- Bontemps et al. (2001) Bontemps, S., et al. 2001, A&A, 372, 173
- Boss (1997) Boss, A. P. 1997, Science, 276, 1836
- Brandner et al. (2000) Brandner, W., et al. 2000, A&A, 364, L13
- Brauer et al. (2007) Brauer, F., Dullemond, C. P., Johansen, A., Henning, T., Klahr, H., & Natta, A. 2007, A&A, 469, 1169
- Bujarrabal et al. (2009) Bujarrabal, V., Young, K., & Castro-Carrizo, A. 2009, A&A, 500, 1077
- Bujarrabal et al. (2008) Bujarrabal, V., Young, K., & Fong, D. 2008, A&A, 483, 839
- Chandler & Richer (2000) Chandler, C. J. & Richer, J. S. 2000, ApJ, 530, 851
- Choi et al. (2008) Choi, M., Hamaguchi, K., Lee, J., & Tatematsu, K. 2008, ApJ, 687, 406
- Devine et al. (2009) Devine, D., Bally, J., Chiriboga, D., & Smart, K. 2009, AJ, 137, 3993
- Duchêne et al. (2007) Duchêne, G., Bontemps, S., Bouvier, J., André, P., Djupvik, A. A., & Ghez, A. M. 2007, A&A, 476, 229
- Duchêne et al. (2003) Duchêne, G., Ménard, F., Stapelfeldt, K., & Duvert, G. 2003, A&A, 400, 559
- Duchêne et al. (2010) Duchêne, G., et al. 2010, ApJ, 712, 112
- Forbrich et al. (2006) Forbrich, J., Preibisch, T., & Menten, K. M. 2006, A&A, 446, 155
- Forbrich et al. (2007) Forbrich, J., et al. 2007, A&A, 464, 1003
- Greisen (2003) Greisen, E. W. 2003, Information Handling in Astronomy - Historical Vistas, 285, 109
- Grosso et al. (2003) Grosso, N., Alves, J., Wood, K., Neuhäuser, R., Montmerle, T., & Bjorkman, J. E. 2003, ApJ, 586, 296
- Krist et al. (1998) Krist, J. E., et al. 1998, ApJ, 501, 841
- Laibe et al. (2008) Laibe, G., Gonzalez, J., Fouchet, L., & Maddison, S. T. 2008, A&A, 487, 265
- Loinard et al. (2002) Loinard, L., Rodríguez, L. F., D’Alessio, P., Wilner, D. J., & Ho, P. T. P. 2002, ApJ, 581, L109
- Lommen et al. (2009) Lommen, D., Maddison, S. T., Wright, C. M., van Dishoeck, E. F., Wilner, D. J., & Bourke, T. L. 2009, A&A, 495, 869
- Mannings & Emerson (1994) Mannings, V. & Emerson, J. P. 1994, MNRAS, 267, 361
- Motte & André (2001) Motte, F. & André, P. 2001, A&A, 365, 440
- Natta et al. (2004) Natta, A., Testi, L., Muzerolle, J., Randich, S., Comerón, F., & Persi, P. 2004, A&A, 424, 603
- Ohashi et al. (1997) Ohashi, N., Hayashi, M., Ho, P. T. P., & Momose, M. 1997, ApJ, 475, 211
- Osten & Wolk (2009) Osten, R. A. & Wolk, S. J. 2009, ApJ, 691, 1128
- Perley et al. (2011) Perley, R. A., Chandler, C. J., Butler, B. J., & Wrobel, J. M. 2011, ApJ, in press
- Perrin et al. (2006) Perrin, M. D., Duchêne, G., Kalas, P., & Graham, J. R. 2006, ApJ, 645, 1272
- Pinte et al. (2007) Pinte, C., Fouchet, L., Ménard, F., Gonzalez, J., & Duchêne, G. 2007, A&A, 469, 963
- Pinte et al. (2008) Pinte, C., et al. 2008, A&A, 489, 633
- Pollack et al. (1996) Pollack, J. B., Hubickyj, O., Bodenheimer, P., Lissauer, J. J., Podolak, M., & Greenzweig, Y. 1996, Icarus, 124, 62
- Reipurth et al. (2004) Reipurth, B., Rodríguez, L. F., Anglada, G., & Bally, J. 2004, AJ, 127, 1736
- Ricci et al. (2010) Ricci, L., Testi, L., Natta, A., Neri, R., Cabrit, S., & Herczeg, G. J. 2010, A&A, 512, A15+
- Rodmann et al. (2006) Rodmann, J., Henning, T., Chandler, C. J., Mundy, L. G., & Wilner, D. J. 2006, A&A, 446, 211
- Rodríguez & Reipurth (1998) Rodríguez, L. F. & Reipurth, B. 1998, Rev. Mexicana Astron. Astrofis., 34, 13
- Ruiz et al. (1987) Ruiz, M. T., et al. 1987, ApJ, 316, L21
- Sauter et al. (2009) Sauter, J., et al. 2009, A&A, 505, 1167
- Schräpler & Henning (2004) Schräpler, R. & Henning, T. 2004, ApJ, 614, 960
- Stapelfeldt et al. (2003) Stapelfeldt, K. R., Ménard, F., Watson, A. M., Krist, J. E., Dougados, C., Padgett, D. L., & Brandner, W. 2003, ApJ, 589, 410
- Stark et al. (2006) Stark, D. P., Whitney, B. A., Stassun, K., & Wood, K. 2006, ApJ, 649, 900
- Tobin et al. (2010) Tobin, J. J., Hartmann, L., & Loinard, L. 2010, ApJ, 722, L12
- van Kempen et al. (2009) van Kempen, T. A., van Dishoeck, E. F., Salter, D. M., Hogerheijde, M. R., Jørgensen, J. K., & Boogert, A. C. A. 2009, A&A, 498, 167
- Vieira et al. (2003) Vieira, S. L. A., et al. 2003, AJ, 126, 2971
- White & Hillenbrand (2004) White, R. J. & Hillenbrand, L. A. 2004, ApJ, 616, 998
- Wilner et al. (2005) Wilner, D. J., D’Alessio, P., Calvet, N., Claussen, M. J., & Hartmann, L. 2005, ApJ, 626, L109
- Wolf et al. (2003) Wolf, S., Padgett, D. L., & Stapelfeldt, K. R. 2003, ApJ, 588, 373


| Name | RA | DEC | Spectral | Disk | Inclination | Disk SizeaaDisk angular diameter from optical scattered light or millimeter imaging. In its most extended array configuration the EVLA has synthesized beam sizes at 7 and 13 mm of 0.043′′ and 0.089′′, respectively. | Ref | Detected?bbIf source was detected in 7 and 13 mm observations. |
|---|---|---|---|---|---|---|---|---|
| (J2000 Phase Center) | Type | Class | (∘) | (′′) | ||||
| Haro 65B | 04 22 01.0 | +26 57 35 | K5 | II | 75 | 4 | 1,2,3 | Y |
| IRAS 04302+2247 | 04 33 16.5 | +22 53 20 | I | 87 | 2 | 1,3,4 | Y | |
| HV Tau C | 04 38 35.5 | +26 10 41 | M0 | II | 84 | 0.7 | 5,6,7 | Y |
| IRAS 04368+2557 | 04 39 53.6 | +26 03 06 | 0 | 85 | 1 | 1,8 | Y | |
| CB 26 | 04 59 50.7 | +52 04 44 | I-II | 85 | 2.8 | 9 | Y | |
| PDS 144 Ncc7 mm observations with the VLA in the CnB array configuration; no 13 mm observations were done. | 15 49 15.4 | 26 00 52 | A2 | II | 83 | 0.8 | 10,11 | Y |
| LFAM1ddArchival 7 mm observations with the VLA, program AR0698; no 13 or 60 mm observations were done. | 16 26 21.8 | 24 22 51 | I | 85 | 1 | 12,13,14 | Y | |
| Oph E MM3 | 16 27 05.9 | 24 37 08 | II | 87 | 1 | 12,15 | Y | |
| Flying Saucer | 16 28 13.2 | 24 31 39 | II | 86 | 4.3 | 12,16 | N | |
| Gomez’s Hamburger | 18 09 13.4 | 32 10 50 | A0 | II | 84 | 12 | 17,18,19 | Y |
| HH 200 | 20 57 06.6 | +77 36 56 | II | 87 | 1.5 | 20,21 | N | |
References. — (1) White & Hillenbrand (2004), (2) Krist et al. (1998), (3) Stark et al. (2006), (4) Wolf et al. (2003), (5) Appenzeller et al. (2005), (6) Stapelfeldt et al. (2003), (7) Duchêne et al. (2010), (8) Tobin et al. (2010), (9) Sauter et al. (2009), (10) Vieira et al. (2003), (11) Perrin et al. (2006), (12) van Kempen et al. (2009), (13) Bontemps et al. (2001), (14) Duchêne et al. (2007), (15) Brandner et al. (2000), (16) Grosso et al. (2003), (17) Ruiz et al. (1987), (18) Bujarrabal et al. (2008), (19) Bujarrabal et al. (2009), (20) Bally et al. (1995), (21) Devine et al. (2009).
| Project | Date | Flux Density | Beam Size | Observation Interval | TOSaaTime on source; aggregate of scan lengths only, does not account for slewing/settling of telescopes. | Calibrator | ||
|---|---|---|---|---|---|---|---|---|
| (UT start) | (GHz) | (mm) | (mJy) | (′′) | (UT time) | (minutes) | ||
| EVLA Observations | ||||||||
| AM1017 | 30 Jul 2010 | 43.3 | 7 | 4.40.6 | 1.96 1.44 (PA 76.1∘) | 11:5613:32 | 22 | J0438+300 |
| AM1017 | 30 Jul 2010 | 22.5 | 13 | 1.40.1 | 4.16 2.66 (PA +88.3∘) | 11:4113:16 | 26 | J0431+206 |
| AM1017 | 30 Jul 2010 | 8.5 | 35 | 0.810.03 | 7.90 7.56 (PA 85.4∘) | 11:1913:42 | 21 | J0431+206 |
| AM1017 | 30 Jul 2010 | 5.0 | 60 | 0.680.04 | 13.54 12.74 (PA 70.4∘) | 11:2913:52 | 21 | J0431+206 |
| VLA Observations | ||||||||
| AS0711 | 04 Jan 2003 | 8.5 | 35 | 0.670.04 | 2.45 2.18 (PA 51.3∘) | 06:4807:04 | 16.17 | J0431+206 |
| AR0465 | 04 Mar 2002 | 8.5 | 35 | 0.550.01 | 0.23 0.22 (PA +89.8∘)bbSynthesized beam size for all AR0465 data. | 20:5905:02 | 159.5 | J0403+260 |
| AR0465 | 02 Mar 2002 | 8.5 | 35 | 0.570.02 | 00:0605:44 | 116.83 | J0403+260 | |
| AR0465 | 08 Feb 2002 | 8.5 | 35 | 0.590.02 | 23:0307:06 | 156.5 | J0403+260 | |
| AS0653 | 26 Jan 1999 | 8.5 | 35 | 0.720.04 | 2.72 2.44 (PA +70.7∘) | 06:2906:50 | 20.5 | J0431+206 |
| AE0112 | 14 Aug 1997 | 8.5 | 35 | 0.650.04 | 2.28 2.20 (PA +39.0∘) | 12:4313:09 | 25.67 | J0431+206 |
| AR0350 | 12 May 1996 | 8.5 | 35 | 0.770.03 | 7.79 2.64 (PA 86.5∘) | 18:5219:51 | 35.5 | J0403+260 |