A differential chemical element analysis of the metal poor Globular Cluster NGC 6397$\dagger$$\dagger$affiliation: This paper includes data gathered with the 6.5 m Magellan Telescopes located at Las Campanas Observatory, Chile.
Abstract
We present chemical abundances in three red giants and two turn-off stars in the metal poor Galactic globular cluster (GC) NGC 6397 based on spectroscopy obtained with the MIKE high resolution spectrograph on the Magellan 6.5-m Clay telescope. Our results are based on a line-by-line differential abundance analysis relative to the well-studied red giant Arcturus and the Galactic halo field star Hip 66815. At a mean of (stat.) (sys.) the differential iron abundance is in good agreement with other studies in the literature based on -values. As in previous, differential works we find a distinct departure from ionization equilibrium in that the abundances of Fe I and Fe II differ by 0.1 dex, with opposite sign for the RGB and TO stars. The -element ratios are enhanced to 0.4 (RGB) and 0.3 dex (TO), respectively, and we also confirm strong variations in the O, Na, and Al/Fe abundance ratios. Accordingly, the light-element abundance patterns in one of the red giants can be attributed to pollution by an early generation of massive SNe II. TO and RGB abundances are not significantly different, with the possible exception of Mg and Ti, which is, however, amplified by the patterns in one TO star, additionally belonging to this early generation of GC stars. We discuss interrelations of these light elements as a function of the GC metallicity.
Subject headings:
Stars: abundances — stars: atmospheres — stars: individual (Arcturus, Hip 66815) — Globular Clusters: individual (NGC 6397) — Globular Clusters: abundances1. Introduction
Globular clusters (GCs) are amongst the oldest stellar aggregates in the Universe and therefore bear the traces of the earliest phases during which the Galaxy was assembled. While the Milky Way’s GC system appears homogeneous (e.g., Koch & Côté 2010, and references therein) and similar to halo field stars in many regards (Geisler et al. 2007), a number of characteristics are clearly at odds with the stellar halo (such as variations of the light chemical elements O, Na, Al; Gratton et al. 2004). Moreover, the second-parameter effect of remote GCs (i.e., variations of their horizontal branch morphology at a given metallicity) and the dual nature of stellar halos (Koch et al. 2008; Carrolo et al. 2010) emphasize the need to couple an accurate age- and distance scale for Population II objects with their chemical properties. This requires, however, an accurate, absolute abundance scale as well and, e.g., an age measurement to within 5% accuracy is only achievable once the clusters’ metallicities (accounting for Fe and -element abundances) are known to within 0.05 dex.
In the first two papers of a series (Koch & McWilliam 2008; Koch & McWilliam 2010; hereafter KM08 and KM10), we have initiated such a new GC scale. With NGC 6397 the present work concludes the establishment of this scale: NGC 6397 is a metal-poor system and therefore the three GCs (47 Tuc, M5, NGC 6397), and the reference star Arcturus, that define our scale cover a broad, representative range of 1.5 dex in [Fe/H].
NGC 6397 is the second closest GC (d⊙=2.3 kpc; dGC=6.0 kpc; Harris 1996 [2010 edition]) to the observer and thus an optimal target for abundance studies of the inner halo component. Previous studies have established NGC 6397 as a metal poor system below [Fe/H] dex, with clear evidence of variations in those light elements that are affected by proton-capture nucleosynthesis; in particular, Carretta et al. (2009a,b) found a pronounced Na-O anti-correlation. Iron-peak and the -elements were, however, reported to show the degree of homogeneity that is nowadays a definitive characteristic of Galactic GCs (Castilho et al. 2000; Carretta et al. 2009c; Lind et al. 2011), with the possible exception of abundance variations due to atomic diffusion and mixing acting in the hotter stars (Korn et al. 2007; Lind et al. 2008).
This paper is organized as follows; In §2 we present the data set and the standard reductions taken, while our atomic linelist, stellar atmospheres are briefly introduced in §3, where we also recapitulate our differential abundance analysis relative to Arcturus and discuss in depth the question of ionization equilibria. Our metallicity scale, abundance errors and results are discussed in §4. A brief note on mass-loss from the GC stars is given in §5. Finally, §6 summarizes our findings.
2. Data & Reduction
Observations were carried out over five nights in May–June 2005 using the Magellan Inamori Kyocera Echelle (MIKE) spectrograph at the 6.5-m Magellan2/Clay Telescope (see the observing log in Table 1).
| ID | Type | Date | Exp. | S/N | ||||||
|---|---|---|---|---|---|---|---|---|---|---|
| [s] | [pixel-1] | (J2000.0) | (J2000.0) | [mag] | [mag] | [mag] | [km s-1] | |||
| 13414 | RGB | 2005 Jun 03 | 3600 | 620 | 17:40:20.2 | 53:42:01.8 | 9.89 | 1.47 | 3.61 | 20.7 |
| 8958 | RGB | 2005 May 31 | 4230 | 580 | 17:40:38.9 | 53:45:25.2 | 10.28 | 1.32 | 3.32 | 24.4 |
| 7230 | RGB | 2004 May 04 | 9900 | 380 | 17:40:43.2 | 53:44:45.0 | 10.34 | 1.35 | 3.35 | 20.0 |
| 13552 | TO | 2005 May 31 | 10800 | 50 | 17:40:19.3 | 53:38:07.8 | 16.26 | 0.58 | 1.77 | 15.5 |
| 365 | TO | 2005 Jun 02 | 7200 | 40 | 17:40:19.4 | 53:43:08.3 | 16.27 | 0.58 | 1.77 | 18.9 |
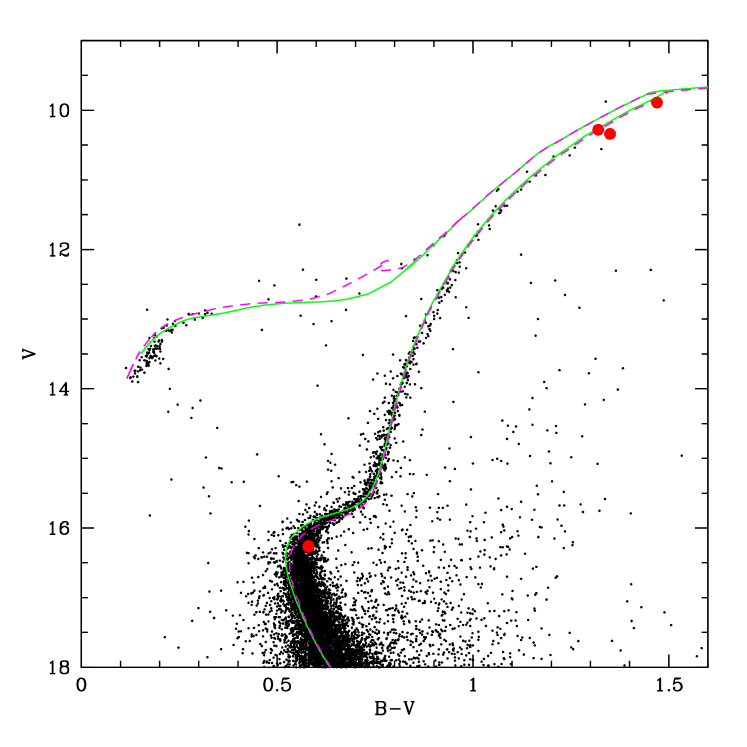
The targets for this project were selected from the catalogue of Kaluzny (1997), from which we adopt the identification numbers. Infrared colors were taken from the Two Micron All Sky Survey (2MASS; Skrutskie et al. 2006). In practice, we chose red giants that have photometric temperatures within 100 K of that of Arcturus, as well as turnoff (TO) stars similar to the well studied halo field reference star Hip 66815 (KM08), which will facilitate our differential analysis. Fig. 1 shows the location of our targets on a color magnitude diagram (CMD) using the Kaluzny (1997) data111We note, however, that Kaluzny (1997) cautions that his data “were not aimed of getting a deep and accurate photometry suitable for study of the cluster properties.”.. A list of the targeted stars is given in Table 1, together with their photometric properties.
None of our targets coincides with the spectroscopic studies of Castilho et al. (2000), Korn et al. (2007), Lind et al. (2008, 2011), nor with Carretta et al. (2009a,b,c). All the above studies focused on various evolutionary stages, from TO to RGB, addressing different questions and different chemical elements (chiefly the Li-abundances and the Na-O anti-correlation) in a total of some 70–80 cluster stars. Moreover, all studies performed element analyses using laboratory values so that it appears timely to place the stars in NGC 6397 on a homogeneous differential scale and to establish a firm comparison of the GC’s mean abundance patterns from both the differential and the absolute approach.
For the present data, we utilized both the red and blue echelle set ups, which yield a wavelength range of 3500–9300Å. By using a slit with a width of 0.5 and a CCD binning of 21 pixels, we obtained a spectral resolution of 40000. Typically, each star was observed for 45–60 minutes, where we split the observations into several exposures to facilitate cosmic ray removal. The seeing typically ranged from 0.5–0.9.
The data reduction proceeded in exact analogy to that described in KM08, i.e., by using the pipeline reduction software by Kelson et al. (2003) and subsequent continuum normalization using a high-order polynomial fit. Typically, our observing and reduction strategy results in S/N ratios of several hundreds per extracted pixel for the red giants (Table 1), as measured in the order containing the H-line and still as high as 200 per pixel at 5000Å. For the TO stars, the S/N ratios reach 50 per pixel on average and we chose to chiefly work on the blue part of the data (Section 3.1).
These high S/N ratios enabled us to measure accurate equivalent widths (EWs) down to the 1 mÅ level, which ensures that we can measure the same transitions as in our previous studies, despite the much lower metallicity of NGC 6397 compared to the previous targets.
Radial velocities of the target stars were determined from the Doppler shifts of typically 35 strong, unsaturated and unblended absorption features. Variations of the individual velocities are, however, not critical for our analysis, since the center of each spectral line is independently determined during our later EW measurement process. Overall, we find a mean heliocentric radial velocity of 19.91.2 km s-1 with a dispersion of 2.80.9 km s-1 (see Table 1), which is slightly higher than the value of found in the literature, yet agrees to within the uncertainties (Meylan & Mayor 1991; Milone et al. 2006; Lind et al. 2009).
3. Abundance analysis
For the present analysis we proceed in exact analogy to the methods outlined in detail in KM08 and KM10. Here, we briefly summarize our differential abundance approach.
3.1. Line list
In order to maintain our goal of a homogeneous abundance scale we opted to use the identical line list as in the previous works. The line data were taken from Fulbright et al. (2006) for the iron lines and Fulbright et al. (2007) for the -elements. These authors had assembled their list such to exclude any contamination from blended features. At an estimated mean [Fe/H] of below 2 dex (e.g., Carretta et al. 2009), NGC 6397 is more metal poor than M 5 by approximately 0.7 dex (KM10) and metal deficient by a factor of 20 compared to the metal rich 47 Tuc (KM08). Thus most of the transitions used for our measurements in those GCs will be very weak. Moreover, our chosen reference star, Arcturus, has a significantly higher iron abundance ([Fe/H]= dex; Fulbright et al. 2006). However, the present, high S/N red giant spectra allow us to still measure the majority of lines, at a few mÅ, to a high accuracy.
The reason for choosing relatively weak lines in Arcturus that are very weak in the program GC stars is that these lines are unsaturated, and so have the maximum sensitivity to abundance. In addition, systematic errors in the adopted damping constants and microturbulent velocity parameter do not affect the abundance result for such weak lines. In this way, these lines offer excellent advantage for measuring precise abundances. In fact, approximately 80 Fe I lines of sufficient strength could be reliably measured in the giants, allowing for an accurate abundance determination. Also the absorption lines of the heavier elements from the line lists of KM08 and KM10 are clearly visible in the spectra so that we did not attempt to supplement our line lists from other sources.
In practice, EWs of the absorption lines were derived using the semi-automated code GETJOB (McWilliam et al. 1995), based on a Gaussian fit to the line profiles. In this way we could achieve typical EW uncertainties of 5%, as determined from the r.m.s. scatter around the best-fit profile. The same lines on adjacent spectral orders agree to within this uncertainty and as the final value we adopted the error-weighted mean. Line-free continuum regions were adopted from the study of Fulbright et al. (2006), based on a detailed study of the metal rich giant Leo.
On the other hand, none of the absorption lines in the red spectra range could be used for the much fainter TO stars and also the line list used for the metal rich 47 Tuc TO stars of KM08 contains no measurable feature in the NGC 6397 stars. Therefore we compiled a new TO line list based on measurements of unblended transitions in regions with well defined continua in our reference dwarf star, Hip 66815, chiefly making use of the blue part of the echelle from 3500–5000Å. This way, we could identify 50 useable Fe I lines in the metal poor TO stars.
Neither hyperfine structure splitting for Na nor Al was included in our analyses. The final lists with our measured EWs are shown in Tables 2 and 3.
| E.P. | Equivalent Width [mÅ] | ||||
|---|---|---|---|---|---|
| Ion | [Å] | [eV] | 13414 | 8958 | 7230 |
| Fe I | 5432.95 | 4.45 | 28.9 | 22.9 | 26.8 |
| Fe I | 5460.87 | 3.07 | 3.2 | 1.4 | 2.9 |
| Fe I | 5462.96 | 4.47 | 44.0 | 36.4 | 38.4 |
| Fe I | 5466.99 | 3.57 | 9.7 | 7.7 | 8.0 |
| Fe I | 5470.09 | 4.45 | 4.0 | 2.6 | 4.8 |
| E.P. | Equivalent Width [mÅ] | |||
|---|---|---|---|---|
| Ion | [Å] | [eV] | 13552 | 365 |
| Fe I | 3552.83 | 2.88 | 20.1 | |
| Fe I | 3640.39 | 2.73 | 15.8 | |
| Fe I | 3760.05 | 2.40 | 15.2 | |
| Fe I | 3786.68 | 1.01 | 24.6 | |
| Fe I | 3790.09 | 0.99 | 35.6 | |
Note. — Tables 2 and 3 are published in entirety in the electronic edition of the Astronomical Journal. A portion is shown here for guidance regarding their form and content.
3.2. Stellar atmospheres and parameters
Stellar abundances for each of the absorption lines were computed using the abfind driver of the 2010 version of the synthesis program MOOG (Sneden 1973). The stellar atmospheres for this analysis were generated from the Kurucz LTE models222http://kurucz.harvard.edu without convective overshoot. Since both Arcturus and NGC 6397 are enhanced in the -elements by approximately dex (Arcturus: Fulbright et al. 2007) and dex (NGC 6397: Castilho et al. 2000; Lind et al. 2010), the -enhanced opacity distributions AODFNEW333http://wwwuser.oat.ts.astro.it/castelli by F. Castelli were used in our analysis. For Arcturus we resumed the same EWs and abundances for individual lines as in KM08, based on its well-established atmospheric parameters (Teff=4290 K, log =1.64, =1.54 km s-1, [/H]=0.49 dex).
3.2.1 The red giant sample
Photometric effective temperatures for the red giants in NGC 6397 were calibrated from the empirical VK color-temperature relation of Alonso et al. (1999). To this end, we combined the V-band photometry of Kaluzny (1997) with infrared K-band magnitudes from 2MASS (Skrutskie et al. 2006). In order to convert the photometry into the TCS system, needed for the Alonso et al. (1999)-calibrations, we applied the transformations from Alonso et al. (1998) and Cutri (2003).
For the reddening we adopt 0.180.01 mag as fiducial value from many recent studies (Richer et al. 2008, and references therein). In addition, we use the extinction law of Winkler (1997) throughout this work. As a result, the uncertainty on Teff from photometric and the calibration errors, is of the order of 30 K. As noted in KM08, in a differential analysis it is necessary to add a zero point shift of +38 K to the GC giant temperatures, due to a difference in the Alonso et al. (1999) color calibration for Arcturus compared to its value from angular diameter measurements. This is consistent with recent re-determinations of the (VK)–Teff relations by González Hernandez & Bonifacio (2009), who found tempertures for the RGB stars higher than the Alonso et al. (1999) scale by 54K.
We note, however, that while our zero-point adjustment is accurate for Arcturus, for RGB stars with [Fe/H] very far from that of Arcturus the correction to the Alonso et al. (1999) (VK) temperature-color relation may be different.
Secondly, we selected the spectroscopic temperature for each star that gave a zero slope for the trend of (differential) Fe I abundance versus excitation potential. As each abundance point in NGC 6397 is truly differential to the same absorption line in Arcturus, our spectroscopic temperatures are on the same physical Teff scale as the reference star. On average, the difference between excitation- and photometric temperatures, T(VK)T(spec), is 91 K with an r.m.s. scatter of 30 K so that the random error on the mean difference from the three RGB stars is 17.5 K. Since a reddening change of 0.01 in E(BV) induces a shift in temperature of 19 K, a reddening error of 0.05 mag would need to be invoked to account for the Teff differences, which is unlikely given the accurate determination of this parameter from deep CMDs. In practice, we used the average of both estimates in the subsequent abundance analyses.
We note that Kaluzny (1997) stated that his photometry for NGC 6397 was not aimed at acquiring deep and accurate photometry suitable for study of the cluster properties, and this limitation may be the reason why the main-sequence is not well matched in Fig. 1. In order to check the accuracy of the Kaluzny (1997) photometry we compared to the studies of Anthony-Twarog, Twarog & Suntzeff (1992), and Alcaino & Liller (1980). Stars common to all three studies showed very similar mean magnitudes, although there was significantly greater dispersion in the Alcaino & Liller (1980) data. The correlation between Anthony-Twarog et al. (1992) and Kaluzny (1997) photometry was excellent, with the Kaluzny (1997) V values smaller by 0.0410.007 mag. If we shift the Kaluzny (1997) V photometry onto the Anthony-Twarog et al. (1992) scale, our photometric Teff values would decrease by 24 K, and the difference between photometric and spectroscopic Teff would be reduced to 67 K, partially resolving the discrepancy between photometric and spectroscopic temperatures. However, this would reduce the adopted mean temperatures by only 12 K, resulting in a 0.01 dex decrease in our final [Fe I/H] values.
Surface gravities for the GC stars were derived from the stellar structure equations (Eq. 1 in KM08) and assume the previously determined Teff and standard Solar values. To obtain luminosities we used the dereddened V-band photometry of Kaluzny (1997) with bolometric corrections from the Kurucz database and a distance modulus to NGC 6397 of (mM)0=12.030.10 mag. The latter is an average from the studies of Reid & Gizis (1998); Gratton et al. (2003); Hansen et al. (2007), and Richer et al. (2008) and based on various methods such as fits to the subdwarf or white dwarf sequences.
Stellar masses of the red giants stars are based on a comparison with the most recent Teramo -enhanced isochrones (Pietrinferni et al. 2004) with element opacities from Ferguson et al. (2005). This is illustrated in Fig. 1, where we compare the observed CMD, from Kaluzny (1997), with 12 Gyr and 13 Gyr -enhanced, , Teramo isochrones, at [Fe/H]=2.14 dex. In Fig. 1 the isochrones pass somewhat to the blue of the bulk of the stars on the main-sequence, although within the scatter of the points, and the RGB and AGB branches appear well matched; however, the bluest BHB stars on the horizontal branch (HB) are better matched by the 13 Gyr isocrhone than the 12 Gyr isochrone. Unfortunately, we have no way to investigate possible zero-point corrections for the B-band data of Kaluzny (1997), so we refrain from an attempt to estimate the age of NGC 6397 from this B,V data.
We adopt an age for NGC 6397 of 12.0 Gyr, based on color-magnitude diagram studies by Anthony-Twarog & Twarog (2000) and Gratton et al. (2003), and the white dwarf cooling results of Hansen et al. (2007), increased by 0.5 Gyr for the for Ly- opacity correction suggested by Kowalski (2007). This age is in agreement with Kaluzny et al. (2008), who adopted 12.00.5 Gyr.
The 12 Gyr, -enhanced, [Fe/H]=2.14 Teramo isochrone was interpolated, giving stellar masses of 0.66 M☉ for the RGB stars and 0.73 M☉ for the TO stars; if our giant stars are, instead, on the AGB, the mass is decreased to 0.64 M☉, which would decrease log by only 0.01 dex. For more metal-rich isochrones the RGB masses increase, at roughly 0.02 M☉ for [Fe/H]=0.10 dex, while the AGB masses decrease by a mere 0.003 M☉. For an 11 Gyr isochrone the masses increase by 0.03 M☉, while for 13 Gyr the masses are decreased by 0.02 M☉. Thus, we estimate the total uncertainty in log due to the isochrones at 0.02 dex. Accordingly the log values given in Table 4 could be determined to within 0.06 dex, based on individual uncertainties in Teff, mass, and the main contribution from the uncertainty in the distance modulus of 0.10 mag.
Next, the microturbulent velocity was initially set to that of Arcturus (1.54 km s-1), and iterated by eliminating any slope in the plot of differential abundance with EW. A linear fit to the data then fixed to within 0.05 km s-1. Finally, the metallicities of the atmospheres [/H] were equated to the [Fe I/H] abundance from the previous iteration step. Table 4 lists the final stellar parameter set that defined our atmospheres for the abundance analysis.
| ID | T | log | |||
|---|---|---|---|---|---|
| (VK) | (spec.) | (average) | [cm s-2] | [km s-1] | |
| 13414 | 4167 | 4081 | 4124 | 0.29 | 1.74 |
| 8958 | 4355 | 4231 | 4293 | 0.63 | 1.70 |
| 7230 | 4330 | 4266 | 4298 | 0.66 | 1.56 |
| 13552 | 6253 | 6250 | 6250a | 3.95 | 1.18 |
| 365 | 6249 | 6250 | 6250a | 3.95 | 1.02 |
3.2.2 The Turnoff sample
For the unevolved, fainter TO stars, the K1.5 III star Arcturus does not provide a realistic reference; rather, it is necessary to perform differential analysis relative to a star with atmosphere parameters similar to the TO targets. Hence, we follow KM08 in measuring abundances on a line by line basis differential to the Galactic halo field dwarf Hip 66815, for which we adopt the stellar parameters derived differentially in KM08: Teff=5812 K, log =4.41, =1.13 km s-1, and [Fe i/H]= dex. Abundances for Hip 66815 were measured differentially, relative to the sun, and was facilitated by our very high S/N spectrum of Hip 66815, which permitted measurement of very weak lines that are also unsaturated in the solar spectrum.
Photometric temperatures for the TO sample are based on their BV, VH, VJ, and VK colors and are derived from the dwarf calibrations of Ramírez & Meléndez (2005). Owing to the large uncertainties on the 2MASS magnitudes of the order of 0.10 mag for the faint stars, the values from the four indicators show a broad 1 scatter of 170 K. While the BV and VK values are in good agreement, the H- and J-based color-temperatures yield much higher values, albeit with large uncertainties. The error-weighted mean Teff (phot.) is thus 6270 K, 6310 K, resp., for the two TO stars.
Secondly, we obtained an independent estimate of Teff from a fit of synthetic spectra with varying temperatures to the H line profiles (Gratton et al. 2005; KM08), which yields reddening-free temperatures of 6250150 K for either star, in good agreement with the above photometric values. In order to account for damping effects such as Stark and van der Waals broadening in the dense atmospheres of the dwarfs, we multiplied the damping constants in the classical Unsöld approximation by a constant factor of 6.5, both for H and for all subsequent metal absorption line studies.
Finally, as for the red giants above we also estimate the spectroscopic temperatures from the excitation plot. For each star, a spectroscopic Teff of 6250150 K is able to reproduce a reasonably flat slope of abundance against excitation potential. Since this is in good agreement with the overall values from the methods described above, we adopt an average Teff 6250150 K as the atmospheric temperature of our two TO stars.
The TO stars’ gravities are then based on the same isochrone tracks as above, which imply a stellar mass of 0.79 M⊙. As before, the uncertainties on log are primarily due to the distance error and amount to 0.06 dex. Lastly, microturbulent velocities are again based on the EW plot, where we restricted the measurements to the reliable regime of EW180mÅ, both for the dwarf stars’ lines and those measured in the more metal rich reference star.
3.3. Ionization equilibrium
The average [Fe I/Fe II], relative to the respective standard stars, of the entire RGB and TO sample is ,which would indicate that ionization equilibrium in the CG stars is fulfilled. However, since once possible explanation for the departure from this equilibrium in the GCs studies in KM08 and KM10 were non-LTE (NLTE) effects, it is necessary to consider the difference of ionized and neutral species for the target stars of either evolutionary status separately.
3.3.1 Red giants
As was shown in KM08, ionization equilibrium is not established in Arcturus, where neutral and ionized species differ by (Fe I)(Fe II)=0.08 dex. We remind the reader that the differential [Fe I/Fe II] abundance ratio in the 47 Tuc giants is +0.08 dex, while the ionization imbalance in the more metal poor GC M 5 follows the opposite trend of an over-ionization by 0.12 dex (Fig. 2).
In the present work we face the similar situation as for the M 5 stars of KM10 in that the iron ratio for the ionized species, differential to Arcturus, is higher than the neutral one by dex on average.
In the mean, ionization equilibrium could be enforced, at an [Fe/H] higher by 0.04 dex, by lowering log by 0.21 dex. As was elaborated in our previous works we start by resorting to systematic errors in mass, luminosity and/or Teff to investigate the apparent over-ionization of iron in the GC stars relative to Arcturus.
If stellar mass was the source of the discrepancy in surface gravity, our targets would need to have a mass of 0.44 M☉ on average, which is an unlikely option. If changes in log were due to luminosity effects, the distance modulus of NGC 6397 would have to be fainter by 0.5 mag (thus 5 with our conservative error estimate from above), rendering it more distant by at least 0.7 kpc. Given the good agreement of all the recent values in the literature this is also unrealistic. Likewise, the photometric accuracy of Kaluzny (1997) and the K-band magnitudes for the bright RGB stars are typically better than 0.02 mag. Moreover, the combined contributions of BC uncertainties (at mag) and the published errors on the reddening of typically 0.01 mag amount to an overall luminosity-effect on log of no more than 0.06 dex which is clearly below the 0.21 dex change in gravity required to explain the observed lack of ionization equilibrium of iron.
At a deviation of color- and excitation temperatures on our Arcturus scale of 91 K, it seems adequate to invoke changes in Teff as the source for the non-equilibrium. In fact, an increase in the temperatures of 43 K on average would we able to resolve the ionization imbalance in our stars (see also Table 6). This increase in Teff is possible if we favor our photometric temperatures over the excitation values, which seems possible if the correction to the color-temperature relations are larger for [Fe/H] near 2. Also, while the S/N of our spectra is easily sufficient to well measure EWs in excess of 6.0 mÅ, it is conceivable that systematic measurement errors for lines in the 6–15 mÅ range could occur, and thus affect the derived excitation temperatures. A 43 K discrepancy could be also accounted for by an increase in the reddening by 0.02 mag, which is, however, 2 of the current best estimates in the literature. These temperature changes would result in [Fe/H] abundances higher by 0.070.01 dex on average, which are in contrast to the low random and systematic uncertainties derived here (Sect. 4.1). These arguments indicate that temperature effects cannot be ruled out as a possible contributor to the non-equilibrium.
As another possible explanation we explored the sensitivity of the [Fe I/Fe II] ratio to the adopted -enhancement in the atmospheres. Switching from the opacity distributions with an [/Fe] abundance ratio of +0.4 (AODFNEW) to the scaled solar composition (ODFNEW) is well able to re-establish the ionization equilibrium in the cluster stars on average (see also Table 6) and we do in fact find that [Fe I/Fe II] dex. However, as we demonstrate in Section 4.2 (and Table 6), the average enhancement of the red giants of NGC 6397 in the -elements (O, Mg, Si, Ca, Ti) amounts to 0.390.03 dex, and 0.440.06 dex, if also the light elements Na and Al are included (see also Castilho et al. 2000; Lind et al. 2010). Therefore, lowering the atmospheric opacities to a Solar level is not a viable solution for the observed imbalance.
Deficient Fe I, relative to Fe II abundances, is the oft-cited sign of NLTE over-ionization of Fe I atoms. We note, however, that Korn et al. (2003) in a NLTE study of cool giants, and Korn et al. (2007) in an abundance study of NGC 6397 stars, found NLTE over-ionization corrections to Fe I abundances of a mere 0.03 dex; however, this result depends on the adopted efficiency of collisions with hydrogen. On the observational side we note that differential line by line abundances from Fulbright et al. (2007) show no trend in (FeIFeII), at less than 0.05 dex, over nearly 2.0 dex in [Fe/H] and 1000 K in temperature for cool RGB stars; similarly, Ti showed a similar, small, (TiITiII) with no change over the same range of parameters. It was concluded that any NLTE effect is small in cool RGB stars; because these stars have quite low temperatures there is an absence of UV flux in the atmosphere for over-ionization of metals. We conclude that the difference in abundance between Fe I and Fe II lines in this work is unlikely to have been caused by NLTE effects.
It is in principle conceivable that the lack of ionization equilibrium can be explained by an anomalous He content of the NGC 6397 giants in that a helium-enrichment yields a simple shift in the surface gravities. Following the formalism of Strömgren et al. (1982; see also Lind et al. 2011), we can show that the necessary gravity change of 0.21 dex would require Y=0.65 in the atmospheres, which is about three times the standard He admixture. In fact it appears likely that the combined effects discussed above conspire to lead to the observed order of magnitude for the lack of differential ionization equilibrium in the giant stars.
Finally, we note that Ti ionization equilibrium does not hold for the NGC 6397 giants, neither, with a mean difference (Ti ITi II)= dex. The sense of this departure is the same as for iron, i.e., the ionized species yields higher abundances on average than the neutral species.
3.3.2 Turnoff stars
In the TO stars we see the opposite trend, with a higher differential abundance of the neutral species, i.e., [Fe I/Fe II] = +0.090.08 dex444Note that the formal error on the mean is strictly zero so that we quote here the mean measurement error of 0.08 dex.. Thus ionization equilibrium is marginally fulfilled in the hotter dwarf stars. Similarly, for titanium we find (Ti ITi II)= dex. As was found in KM08, the equilibirum already holds in the reference star itself, where (Fe I)(Fe II)=0.02 dex.
In analogy to the above, this imbalance could be alleviated by an increase in surface gravity by 0.26 dex, corresponding to Teff lower by 180 K. In this case, the new balance would be settles at a mean [Fe/H] of dex – consistent with the values found from the RGB sample. As we outlined in the previous section, neither changes in mass, distance, nor the He content could reasonably account for the observed gravity changes needed to resolve the ionization imbalance. Likewise, at a mean of -enhancement of the TO stars of 0.290.06 dex, the choice of the atmospheres’ opacities is not a viable option. In conclusion, given the larger uncertainties of the TO stars’ temperature scale (both compared to the more accurate Teff of the RGB and the smaller errors on the TO’s other parameters) the choice of temperature is a feasible cause of the observed non-equilibrium in the two turn-off stars.
3.3.3 Other GCs
In the following we combine the issue of departures of ionization equilibrium in the metal poor NGC 6397 stars with our findings in the more metal rich GCs 47 Tuc (KM08) and M5 (KM10). Since we found a systematic difference between the (one) TO and (eight) RGB stars in 47 Tuc as well as for the present data, we distinguish these stages in Fig. 2.
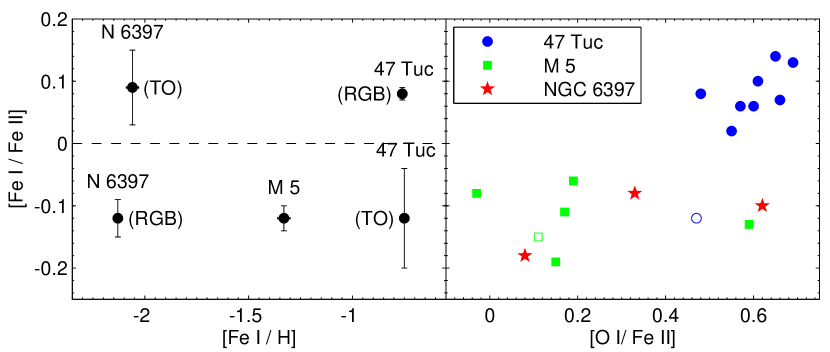
While the sense of the non-equilibrium is inverted for the most metal rich CG in our sample, no linear decline of the departure is discernible in the red giant stars; moreover, the [Fe I/Fe II] ratio appears to level off towards the value of 0.1 dex below a certain (yet to be defined) metallicity threshold. Unfortunately, the M5 study of KM10 did not include any turn-off stars555The giant sample in M5, however, contains one AGB star with an [Fe I/Fe II] ratio entirely consistent with the remainder of the RGB stars. to bolster any systematics, but we note that either TO sample in the metal rich 47 Tuc and the very metal poor NGC 6397 exhibits clearly opposite senses of the departure from equilibrium.
An intriguing trend is then seen in the right panel of Fig. 2: those stars with the largest enhancements in the O/Fe ratio also show the largest (positive) ionization imbalance Fe I/Fe II – the Pearson correlation coefficient between this ratio and the O-abundance ratio is 0.740.12. For 47 Tuc the deficiency of Fe II, relative to Fe I, cannot be explained by NLTE overioization; possible explanations are outlined in KM08. One scenario for explaining the trend is that enhanced low-ionization metals, including -elements, in 47 Tuc provide a source of electrons that significantly reduces the derived Fe II abundance, akin to the effect of increased gravity, while the Fe I abundances are mostly unchaged.
4. Differential abundance results
Table 5 lists the abundance ratios as determined from the atmospheres with the parameters discussed above. All ratios are given relative to Fe I, except for [O I], which, due to a similar sensitivity to surface gravity, we state relative to Fe II.
| #13414 | #8958 | #7230 | |||||||||
|---|---|---|---|---|---|---|---|---|---|---|---|
| Ion | [X/Fe] | N | [X/Fe] | N | [X/Fe] | N | |||||
| [Fe I/H] | 2.14 | 0.11 | 91 | 2.17 | 0.12 | 80 | 2.09 | 0.13 | 87 | ||
| [Fe II/H] | 1.96 | 0.09 | 6 | 2.09 | 0.09 | 5 | 1.99 | 0.05 | 6 | ||
| [O I]aaAverage including Teff (H) and the other color indices. | 0.08 | 0.01 | 2 | 0.33 | 0.12 | 3 | 0.62 | 0.02 | 3 | ||
| Na I | 0.37 | 0.09 | 4 | 0.28 | 0.22 | 3 | 0.20 | 0.13 | 4 | ||
| Mg I | 0.47 | 0.17 | 5 | 0.51 | 0.23 | 5 | 0.40 | 0.18 | 4 | ||
| Al I | 1.13 | 0.07 | 5 | 1.04 | 0.13 | 6 | 0.66 | 1 | |||
| Si I | 0.43 | 0.15 | 11 | 0.45 | 0.14 | 6 | 0.45 | 0.17 | 8 | ||
| Ca I | 0.41 | 0.11 | 10 | 0.38 | 0.13 | 9 | 0.41 | 0.07 | 9 | ||
| Ti I | 0.29 | 0.15 | 8 | 0.29 | 0.09 | 4 | 0.39 | 0.18 | 5 | ||
| Ti IIaaRelative to Fe II. | 0.32 | 0.18 | 4 | 0.37 | 0.15 | 4 | 0.41 | 0.14 | 4 | ||
| #13552 | #365 | ||||||||||
| Ion | [X/Fe] | N | [X/Fe] | N | |||||||
| [Fe I/H] | 2.03 | 0.14 | 53 | 2.09 | 0.14 | 39 | |||||
| [Fe II/H] | 2.12 | 0.18 | 7 | 2.18 | 0.22 | 7 | |||||
| Mg I | 0.11 | 0.11 | 3 | 0.34 | 0.20 | 3 | |||||
| Ca I | 0.42 | 0.20 | 7 | 0.46 | 0.19 | 10 | |||||
| Ti I | 0.15 | 0.40 | 4 | 0.21 | 0.36 | 4 | |||||
| Ti IIaaRelative to Fe II. | 0.15 | 0.22 | 21 | 0.29 | 0.25 | 18 | |||||
4.1. Abundance errors
In order to quantify the systematic errors on the chemical abundances due to uncertainties in the stellar atmosphere parameters, we performed the standard error analysis as in KM08 and KM10. Thus we varied the parameters by the following conservative uncertainties and re-computed new abundances: (T50K; log 0.2 dex; 0.1 km s-1; [/H]0.1 dex). The resulting changes in the abundance ratios is displayed in Table 6, exemplary for one red giant and one TO star.
| Teff | [M/H] | |||||||||
|---|---|---|---|---|---|---|---|---|---|---|
| Ion | 50 K | +50 K | 0.2 dex | +0.2 dex | 0.1 km s-1 | +0.1 km s-1 | 0.1 dex | +0.1 dex | ODF | |
| Fe I | 0.05 | 0.04 | 0.02 | 0.02 | 0.00 | 0.01 | 0.01 | 0.01 | 0.03 | |
| Fe II | 0.05 | 0.07 | 0.08 | 0.05 | 0.00 | 0.02 | 0.02 | 0.01 | 0.08 | |
| [O I] | 0.01 | 0.01 | 0.06 | 0.07 | 0.01 | 0.01 | 0.02 | 0.03 | 0.07 | |
| Na I | 0.05 | 0.05 | 0.04 | 0.02 | 0.01 | 0.01 | 0.02 | 0.01 | 0.06 | |
| Mg I | 0.02 | 0.02 | 0.02 | 0.01 | 0.00 | 0.01 | 0.01 | 0.01 | 0.03 | |
| #13414 | Al I | 0.04 | 0.03 | 0.02 | 0.02 | 0.01 | 0.01 | 0.01 | 0.01 | 0.04 |
| Si I | 0.01 | 0.01 | 0.01 | 0.01 | 0.01 | 0.01 | 0.01 | 0.01 | 0.01 | |
| Ca I | 0.07 | 0.06 | 0.04 | 0.03 | 0.03 | 0.03 | 0.02 | 0.02 | 0.06 | |
| Ti I | 0.08 | 0.09 | 0.05 | 0.02 | 0.00 | 0.01 | 0.02 | 0.01 | 0.07 | |
| Ti II | 0.01 | 0.02 | 0.05 | 0.03 | 0.03 | 0.03 | 0.01 | 0.01 | 0.04 | |
| Fe I | 0.03 | 0.03 | 0.01 | 0.01 | 0.01 | 0.01 | 0.01 | 0.01 | 0.01 | |
| Fe II | 0.01 | 0.01 | 0.06 | 0.08 | 0.01 | 0.01 | 0.01 | 0.01 | 0.01 | |
| Mg I | 0.02 | 0.02 | 0.01 | 0.01 | 0.01 | 0.01 | 0.01 | 0.01 | 0.01 | |
| #13552 | Ca I | 0.04 | 0.02 | 0.01 | 0.01 | 0.01 | 0.01 | 0.01 | 0.01 | 0.01 |
| Ti I | 0.05 | 0.04 | 0.01 | 0.01 | 0.01 | 0.01 | 0.01 | 0.01 | 0.01 | |
| Ti II | 0.02 | 0.02 | 0.07 | 0.07 | 0.01 | 0.01 | 0.01 | 0.01 | 0.01 | |
We also computed atmospheres with Solar scaled opacity distributions, ODFNEW, which reduces the -enhancement in the input models by 0.4 dex. The effect of this variation is listed in the column labeled “ODF”.
In practice, the r.m.s. scatter of 30 K in the comparison of T(VK) versus excitation temperature indicates a 1 random error on either indicator of 21 K. If we add in quadrature the systematic uncertainty of 30 K for Arcturus from KM08, we obtain a total error on the RGB Teff scale of 37 K. For the TO stars we adopt a higher representative error of 150 K, consistent with the r.m.s. scatter of the different color-temperatures and the allowed range of H fits.
By accounting for errors on distance modulus, reddening, V-magnitude, BC and stellar mass (Sect. 3.2) we estimate a surface gravity uncertainty of 0.06 dex. Moreover, we assume a of 0.05 km s-1, which is the allowed range to yield flat slopes in the EW vs. (Fe I) plot, and a 0.05 error on the models’ metallicity [/H]. Finally, we adopted an error on 0.1 dex on [/Fe], which corresponds to 1/4 of the difference when ODFNEW is used as opposed to the -enhanced atmospheres, and which is the typical random scatter in the abundances. Interpolating from Table 6, all these contributions are added in quadrature to obtain an upper limit for the final, uncorrelated systematic abundance uncertainty. Note, however, that the actual errors on our abundance ratios are probably smaller, due to the covariances of all atmospheric parameters (McWilliam et al. 1995). As a result, the total 1 systematic errors on the [Fe I/H] and [Fe II/H] abundance ratios of the RGB stars are 0.04 and 0.05 dex, respectively, and typically 0.02–0.06 dex for the light and -elements. Likewise, for the fainter TO stars, these ratios have systematic uncertainties of 0.11 (Fe I), 0.16 (Fe II), and 0.08 dex (other elements).
Table 5 additionally lists the number of features that were measured to derive the elemental abundances, and the statistical error in terms of the 1 scatter of our measurements from individual lines. This error component is small compared to those from the atmospheric uncertainties for Fe I, where a sufficient number of lines is detectable. For those elements with only a handful of lines present this random scatter will dominate the error budget. We find typical mean random errors of 0.05 dex per line.
4.2. Abundance ratios
4.2.1 Iron
From our five targets we derive a mean value of [Fe I/H= dex (random and systematic error). The former, statistical error is simply the standard deviation of the mean. At 0.05 dex, the star-to-star 1 scatter within NGC 6397 is small and consistent with the canonical notion of very homogeneous metallicities, at least as manifested in their iron content, of GCs (e.g., Carretta et al. 2009c). The larger systematic uncertainty above is mainly due to the contribution of the more uncertain temperature scale of the TO stars. The quoted mean is in excellent agreement with those found by Korn et al. (2007; NLTE) and Lind et al. (2009, 2011), averaged over all stellar types. Lind et al. (2008) find lower values around dex, although on the lower RGB and with a broad scatter dependent on the evolutionary status. Our new abundance scale and the literature values cited above are more metal poor than those given by Castilho et al. (2000) and Carretta et al. (2009c) by 0.1 dex. As a main reason for any discrepancy we consider the differential nature of our study versus the primary use of -values in all other literature studies to date.
At the respective, separate mean [Fe/H] of 2.130.02 (RGB) and 2.060.03 (TO), both evolutionary stages show iron abundances different at the level (accounting for the random errors only). While Castilho et al. (2000) find no evidence of variations of the metal abundance with evolutionary status, Korn et al. (2007) and Lind et al. (2008) discuss their observed trends of [Fe/H] with Teff in terms of atomic diffusion and mixing in the GC stars. On average, the Fe-abundance in their sample drops by 0.2 dex across 800 K, albeit in the opposite trend as observed from our sample. The coolest stars of sample, however, reach only as low as 5000 K, which is still 800 K warmer than the RGB stars analysed by us. Thus the difference of 0.07 dex between RGB and TO over 2000 K in the present work cannot be regarded as significant evidence for or against the acting of mixing processes in the sample GC stars.
All of the studies above either enforced ionization equilibrium and/or restricted their discussions to Fe I as the primary species, so that we will not pursue the comparison of [Fe II/H] with the literature any further. We note, however, that the Fe II based abundance scale of Kraft & Ivans (2003) favors a higher mean metallicity of this GC of dex.
4.2.2 Alpha-elements — Mg, Si, Ca, Ti
Fig. 3 illustrates the derived abundance ratios in a statistical box plot, which shows the mean and interquartile ranges for each element. Much information about the detailed abundance distribution of NGC 6397 is found in the literature and we do not opt to repeat the main arguments from those sources (see e.g., Castilho et al. 2000; Korn et al. 2007; Lind et al. 2011), which classify NGC 6397 as a typical metal poor Galactic halo cluster with star-to-star scatter in the light elements (Lind et al. 2009). Also our differential results classify NGC 6397 as representative of the population in that it is enhanced in the elements Mg, Si, and Ca to the plateau halo value of +0.4 dex (note that Ti is less enhanced by ca. 0.1 dex). Oxygen shows a broad spread, which we will discuss in Sect. 4.2.3.
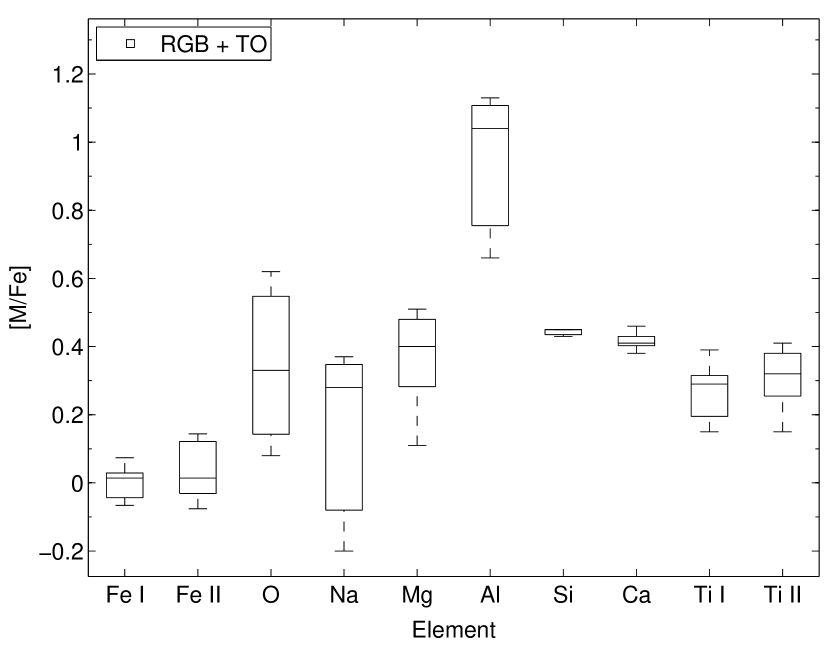
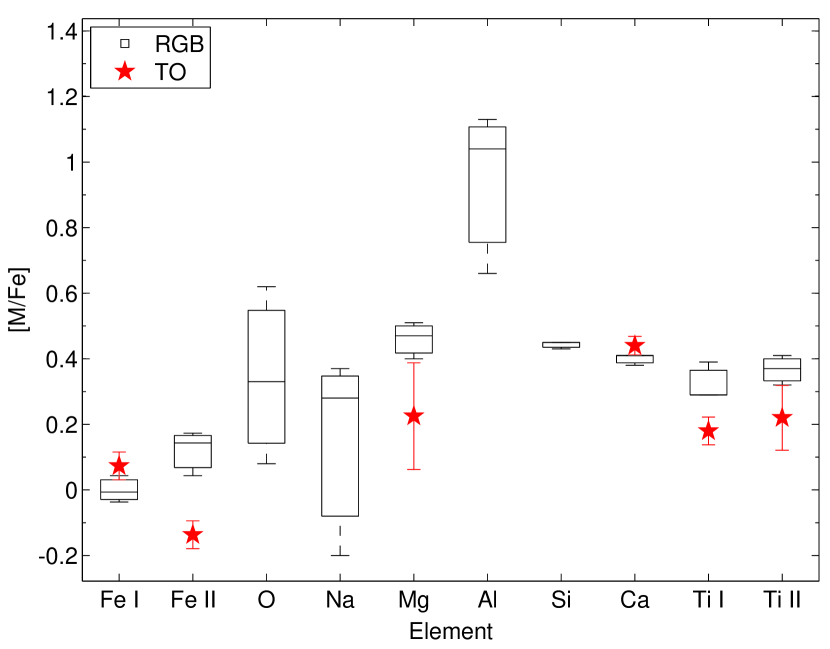
All other /Fe ratios in the RGB stars show a remarkable degree of homogeneity. Likewise, these elements do not show significant scatter between both TO stars, with the exception of Mg (and possibly Ti II), which we shall address in the next section. As already addressed above, Korn et al. (2007) and Lind et al. (2008) report on the variation of NGC 6397’s abundance ratios with evolutionary status, read: effective temperature. Thus we show in Fig. 4 the run of our measured abundances (relative to the respective mean values) with the atmospheric temperature.
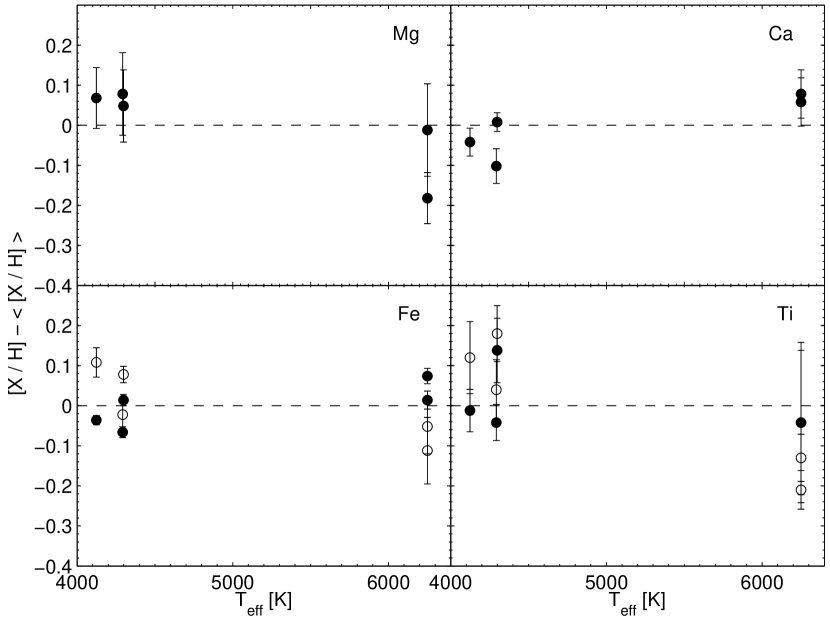
The general consensus of the aforementioned studies was that a Teff increase of 800 K incurs a decrease in the [X/H] ratios for Mg and Ca by 0.07 and 0.17 dex, respectively, while the opposite trend is seen for Ti, albeit only marginally (Table 2 in Lind et al. 2008). Over the temperature range covered by those authors, these trends were well described by stellar atomic diffusion models (e.g., Richard et al. 2005). As already shown for iron, our data, reaching far cooler stars, do not show the same decrease but exhibit a marginal constancy. Evidence for falling abundance ratios at the hotter end is caused by a lower value of [Mg, Ti/Fe] in TO star #13552 at most.
The -elements are predominantly produced in supernovae (SNe) of type II, that is, from massive, therefore short-lived, stars. While Mg and O are formed in the hydrostatic nuclear burning in the SNe II progenitors, Si, Ca, and Ti are synthesized during the explosive phase of the SNe II (e.g., Woosley & Weaver 1995). It can thus be expected to see different trends of in the abundance ratios of different -elements against each other (e.g., Fulbright et al. 2007; KM10). This is shown in Fig. 5, where we follow the respective element ratios as a function of metallicity. Those plots and the following Figures illustrate our data in comparison with the differential abundances in the Galactic bulge (Fulbright et al. 2007) and the two GCs studied in KM08, KM10.
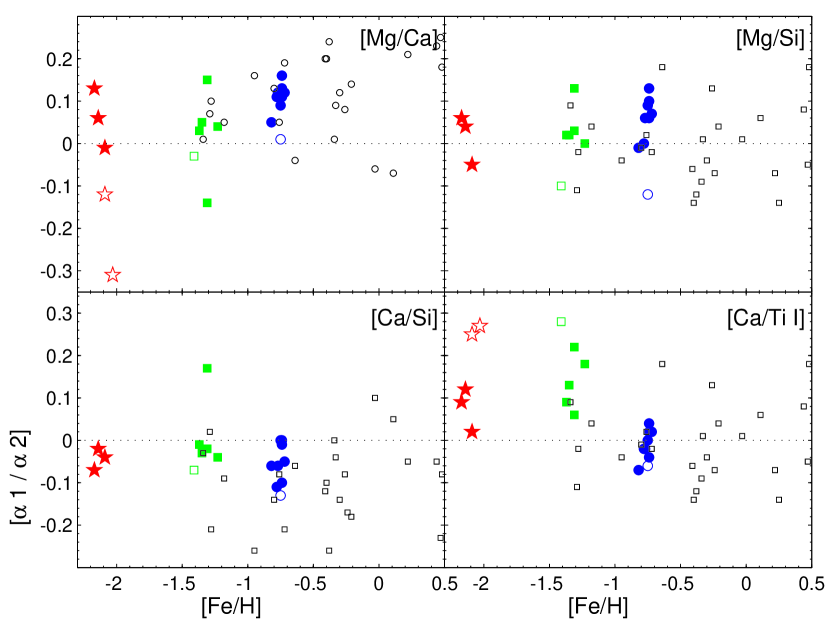
As a result, the [Ca/Si] ratios in all clusters are broadly consistent zero, as found in essentially all Galactic components, with only little scatter (r.m.s. of 0.03–0.08 dex). This confirms that the explosive -elements indeed trace each others’ element trends. This holds for the observed [Mg/Si] ratios as well, which are compatible with zero in our differential analyses (at a mean of 0.020.03 dex).
At a mean of 0.15 dex (1-scatter of 0.05 dex), the [Ca/Ti] ratios in the metal poor GCs NGC 6397 and M5 are slightly higher than the values for field stars. It is interesting to note that both these [Ca/Ti] values are higher by about 0.15 dex than in the metal rich 47 Tuc (KM08). As the [Mg/Ca] plot in the top panel of Fig. 5 shows, this ratio is, for NCG 6397 and M5, in full agreement within their scatter with the value of 0 found in the Galactic halo, bulge and disks. In fact, the 1 scatter in this element combination is larger than, e.g., in the Ca/Si and Ca/Ti ratio. It is, however, evident, that most of the scatter in the data from this work is due to different values as a function of evolutionary status.
4.2.3 Light elements — O, Na, Al
None of these elements could be measured in the TO stars, since the usual reliable transitions were too weak to be identified. On the other hand, the strong Na D lines were still too strong for meaningful measurements and also the blue Al 3940, 3960Å Al lines were too strong and close to the broad Ca K feature in the reference spectrum of Hip 66815. Note that we did not apply any NLTE corrections to our Na and Al results.
The oxygen abundances in the red giants are based on the [O I] 6300, 6363Å lines that we carefully deblended from telluric absorption, and the much weaker feature at 5577Å.
In previous works we had chosen to reject the stronger lines at 5682Å, which are heavily blended with other metal lines in more metal rich stars. In the metal poor NGC 6397, however, such blends are negligible and we use a mean from the 5682 and 6154Å lines as our final sodium abundance (Ivans et al. 2001).
Both Na and O show the broad range in their abundance ratios, in accord with the now well established light-element variations, in particular the Na-O anti correlation, in all GCs studied to date (Gratton et al. 2004; Carretta et al. 2009a,b), as also seen in NGC 6397 (e.g., Lind et al. 2011). Two of the red giants show [O/Fe] and [Na/Fe] ratios in the range of 0.1–0.4 dex, which are compatible with the majority of the GC stars and consistent with the dominant (intermediate, “I”) second generation of stars, enriched by the ejecta of (massive AGB or fast rotating) stars that could sustain proton-capture reactions in their interiors. One star (#7230), on the other hand, has a remarkably high oxygen-to-iron ratio and is accordingly depleted in sodium. This is attributable to a pure enhancement of an early generation of SNe II so that this star can be assigned to the “primordial” (P) cluster generation (Carretta 2009a). Although our sample size of three stars does not allow us to statistically investigate the fractions of stars in either population and thus to trace in detail the enrichment histories of the primordial and second stellar generations, we note that the ratio of P/I of 1:2 is fully consistent with the empirical ratio found in the majority of GCs irrespective of their metallicity (Carretta et al. 2009a).
Aluminum abundance ratios in the giants were measured from the moderately weak (32 mÅ) lines around 6696 and 7835Å and, for #8958, from the weak 5557Å transition. As a result, we see evidence for a Mg-Al correlation and, in the top panel of Fig. 6, we parallel the Mg/Al correlation with the Na O anti-correlation discussed above.
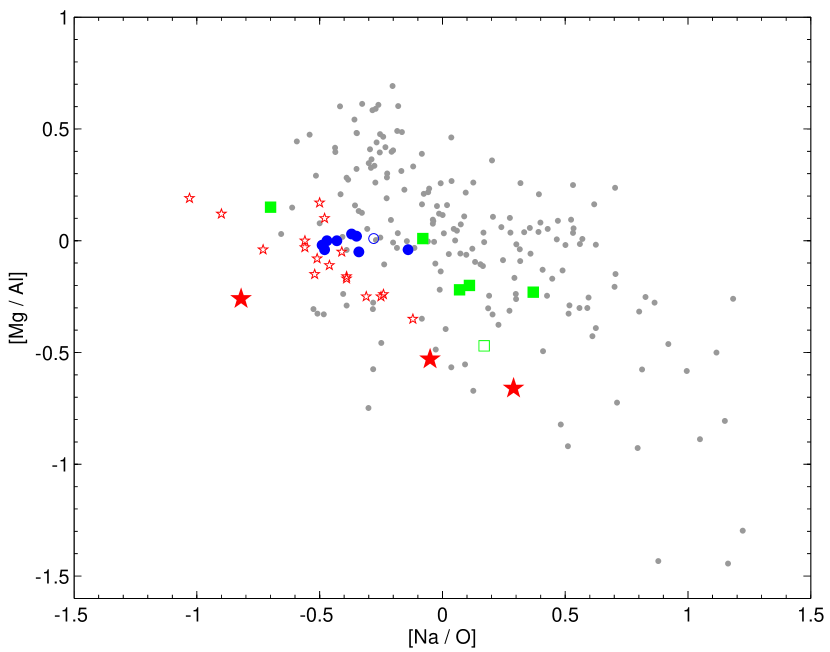
As before, it is evident that #7230, with the highest Mg/Al ratio, reflects the original, chemically unprocessed composition of this GC. Likewise, the different Mg/Fe ratio in the two TO stars may be indicative of their belonging to the different populations. A qualitative comparison of the Na D and Al 3940, 3960 line strengths indicates that, at the stronger Na features and slightly higher [Mg/Fe] of #365, this object is also coined by the first SNe II ejecta in the early enrichment phases of the GC (recall the very similar atmospheric parameters of these stars). Overall, our differential abundances thus confirm the occurrence of star-to-star variations in the light elements due to the canonical proton-capture synthesis processes seen in other metal poor Galactic halo GCs.
4.2.4 NLTE effects
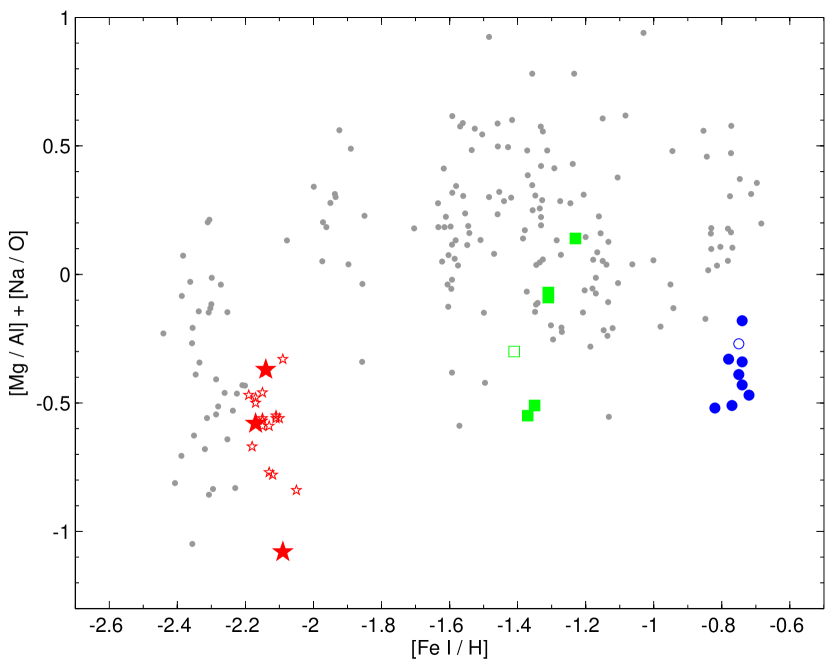
Fig. 6 (top panel) reveals an additional striking trend: at any given value of Na/O the stars in NGC 6397 show systematically lower Mg/Al ratios than the bulk of GCs studied in the literature. Also the data of Lind et al. (2011) are in agreement with this notion. The comprehensive data set of Carretta et al. (2009a,b) alone shows an indication of a detached sequence of stars with relatively low Mg/Al ratios. As it turns out, these belong to the metal poor M10 ([Fe/H]=; 2 out of their 10 stars), M15 (; 1/13), M30 (; 4/10), and M68 (; 9/12). We explore in the bottom panel Fig. 6 the sum [Mg/Al] + [Na/O], which, in other words, simply combines the ratio of hydrostatic -elements [Mg/O] with the ratio of the proton-capture elements [Na/Al]. The plot shows a clear dichotomy in that the mean and 1 scatter for GC stars with [Fe/H] dex amount to 0.28 dex, while the metal poor stars below dex have dex – a difference significant at the 80% confidence level.
Since both the literature and our data in this plot are based on LTE, we discuss here qualitatively NLTE corrections as a possible explanation for the observed discrepancy (see, e.g., Fulbright et al. 2007)
Oxygen: Since our O abundances are based on the meta-stable lines at 6300, 6363 Å, the quoted abundance ratios will only have negligible NLTE corrections.
Magnesium: Andrievsky et al. (2010) perform an extensive analysis of Mg NLTE corrections. Although their calculations only cover warmer stars (4500 K) at lower metallicities than in NGC 6397, we can qualitatively extrapolate the order of magnitude applicable to the cool red giants in the GC studies of interest. As the NLTE correction Mg (in the sense NLTELTE) is 0.10 dex at (Teff, [Fe/H])=(4600 K, 3 dex), and considering that tends to decrease with decreasing temperature and for lower-metallicity stars, we estimate the correction not to be in excess of 0.1 dex for the metal poor GC stars.
Sodium: For the more metal rich reference star, Arcturus, Fulbright et al. (2007) assume =0.17 dex based on the calculations for the 5682, 5688Å-lines of Takeda et al. (2003) and a smaller contribution from the 6154, 6160Å transitions. Following Takeda’s et al. (2003) results for stars at lower [Fe/H] as in NGC 6397, we expect Na NLTE values lower by dex.
Aluminum: Andrievsky et al. (2008) studied the strong resonance lines at 3944, 3962Å, while our RGB Al/Fe ratios are based on the red 6696, 6698Å-lines. If most of the effect on the resonance lines arises from over-ionization, then the red lines would show a similar result and we can estimate the likely NLTE-corrections from those resonance lines near the stars closest to our giants’ parameters as 0.4 dex.
In summary, a combination of the above NLTE effects on of dex is a viable option to account for the systematically lower Mg/Al abundance ratios for metal poor stars with respect to their Na/O ratios.
5. A note on mass loss
Most of the luminous giants in the present data set and in KM08 and KM10 showed notable red- and blue-shifted emission in the wings of H line. Therefore, we follow, e.g., Mészáros et al. (2008) in measuring the mass outflow velocities from the bisector of H. In Fig. 7 we correlate the respective measure of these stellar winds with the luminosities that are based on the isochrones discussed in Sect. 3.2.1.
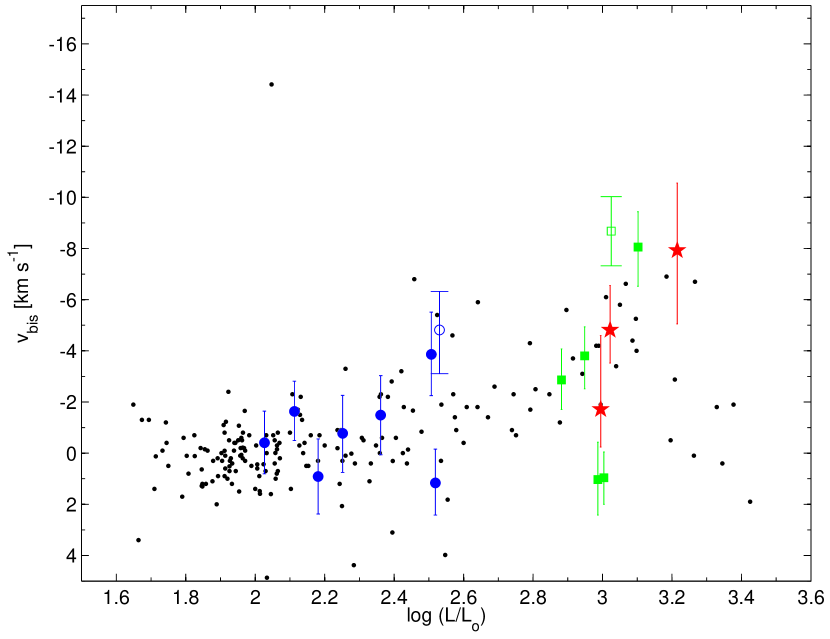
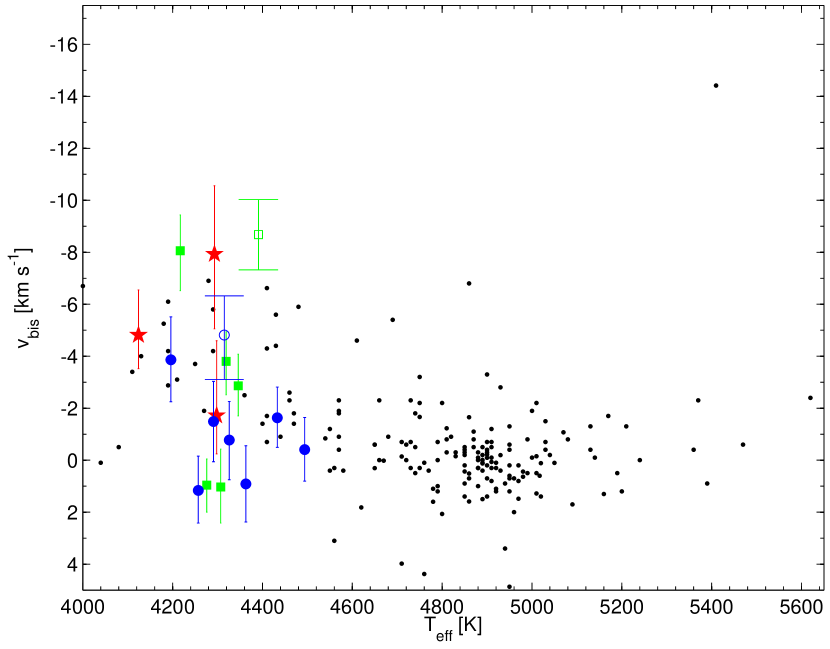
The figure also shows results from three other GCs at [Fe/H] = (, 2.26, 1.54) from Mészáros et al. (2008, 2009). Across the entire luminosity range covered in our samples the red giants in 47 Tuc, M5, and NGC 6397 are in good agreement with the literature data, thus confirming the empirical trends describing chromospheric expansions on the RGB. These are an onset of stronger winds at T K, at luminosities above , respectively. Moreover, the two AGB candidates in 47 Tuc (#3) and M5 (M5III-50) clearly show the fastest outflow velocities amongst the respective cluster stars. This behavior is dependent on the stellar metallicity on the AGB – the moderately metal poor M5 AGB star has an outflow velocity larger by 42 km s-1 than the metal rich equivalent in 47 Tuc. On the other hand, there is no systematic trend of the atmospheric velocities with cluster metallicity discernible in the RGB sample, as is substantiated by the comparison with the (moderately) metal poor GCs of Mészáros (2008, 2009).
6. Summary & Discussion
Here we have determined the chemical abundance ratios in three red giants and two TO stars in the metal poor Galactic halo globular cluster NGC 6397. Being a well-studied system, we indeed confirm that the majority of the -elements are enhanced to the +0.4 dex-halo plateau. Likewise, we find the canonical light element variations in O, Na, and Al indicating that one of our RGB targets and possibly one of the turn-off stars were affected by an early stage of SNe II pollution.
However, the present analysis vastly improves on the measurements of Fe, Na, Al, and -element-to-iron ratios (O, Mg, Si, Ca, Ti) by using line-by-line differential analyses relative to reference stars of similar stellar parameters (Arcturus and Hip 66815). This procedure serves to efficiently reduce uncertainties in atmosphere parameters and potentially erroneous atomic data. As a result, we derive an accurate mean LTE iron abundance of dex, in agreement with recent high-resolution measurements based on -values. We note, however, that some studies have revealed star-to-star variations as a function of stellar evolutionary type, which do not significantly witness in our data. Unfortunately a star-by-star comparison with other sources is prohibited by the lack of overlapping stars between these samples. However, other literature data place this GC at an [Fe/H] higher by 0.1 dex. Already in our earlier comparison of the newly established abundance scale of Koch & McWilliam we noted such differences (e.g., 47 Tuc being more metal poor than on other scales; KM08), while M5 was found in excellent agreement with the literature (KM10). Thus we emphasize again that, there is no systematic offset that defines the differential abundance scale, but that any comparison of GC scales must be considered on a case-by-case basis. In particular, with the three GCs studied in this differential manner, this homogeneous abundance scale now covers a broad range of Galactic GCs’ metallicities, from below 2 dex to the metal rich 47 Tuc, at 0.76 dex.
References
- Alcaino & Liller (1980) Alcaino, G., & Liller, W. 1980, AJ, 85, 680
- Alonso et al. (1998) Alonso, A., Arribas, S., & Martinez-Roger, C. 1998, A&AS, 131, 209
- Alonso et al. (1999) Alonso, A., Arribas, S., & Martínez-Roger, C. 1999, A&AS, 140, 261
- Andrievsky et al. (2008) Andrievsky, S. M., Spite, M., Korotin, S. A., Spite, F., Bonifacio, P., Cayrel, R., Hill, V., & François, P. 2008, A&A, 481, 481
- Andrievsky et al. (2010) Andrievsky, S. M., Spite, M., Korotin, S. A., Spite, F., Bonifacio, P., Cayrel, R., François, P., & Hill, V. 2010, A&A, 509, A88
- Anthony-Twarog et al. (1992) Anthony-Twarog, B. J., Twarog, B. A., & Suntzeff, N. B. 1992, AJ, 103, 1264
- Carollo et al. (2010) Carollo, D., et al. 2010, ApJ, 712, 692
- Carretta et al. (2009) Carretta, E., et al. 2009a, A&A, 505, 117
- Carretta et al. (2009) Carretta, E., Bragaglia, A., Gratton, R., & Lucatello, S. 2009b, A&A, 505, 139
- Carretta et al. (2009) Carretta, E., Bragaglia, A., Gratton, R., D’Orazi, V., & Lucatello, S. 2009c, A&A, 508, 695
- Castilho et al. (2000) Castilho, B. V., Pasquini, L., Allen, D. M., Barbuy, B., & Molaro, P. 2000, A&A, 361, 92
- Cutri (2003) Cutri R. M. 2003, Explanatory Supplement to the 2MASS All-Sky Data Release, http://www.ipac/caltech.edu/2mass/releases/allsky/doc/explsup.html
- Ferguson et al. (2005) Ferguson, J. W., Alexander, D. R., Allard, F., Barman, T., Bodnarik, J. G., Hauschildt, P. H., Heffner-Wong, A., & Tamanai, A. 2005, ApJ, 623, 585
- Fulbright et al. (2006) Fulbright, J. P., McWilliam, A., & Rich, R. M. 2006, ApJ, 636, 821
- Fulbright et al. (2007) Fulbright, J. P., McWilliam, A., & Rich, R. M. 2007, ApJ, 661, 1152
- Geisler et al. (2007) Geisler, D., Wallerstein, G., Smith, V. V., & Casetti-Dinescu, D. I. 2007, PASP, 119, 939
- González Hernández & Bonifacio (2009) González Hernández, J. I., & Bonifacio, P. 2009, A&A, 497, 497
- Gratton et al. (2003) Gratton, R. G., Bragaglia, A., Carretta, E., Clementini, G., Desidera, S., Grundahl, F., & Lucatello, S. 2003, A&A,408, 529
- Gratton et al. (2004) Gratton, R., Sneden, C., & Carretta, E. 2004, ARA&A, 42, 385
- Gratton et al. (2005) Gratton, R. G., Bragaglia, A., Carretta, E., de Angeli, F., Lucatello, S., Piotto, G., & Recio Blanco, A. 2005, A&A, 440, 901
- Hansen et al. (2007) Hansen, B. M. S., et al. 2007, ApJ, 671, 380
- Harris (1996) Harris, W. E. 1996, AJ, 112, 1487
- Ivans et al. (2001) Ivans, I. I., Kraft, R. P., Sneden, C., Smith, G. H., Rich, R. M., & Shetrone, M. 2001, AJ, 122, 1438
- Kaluzny (1997) Kaluzny, J. 1997, A&AS, 122, 1
- Kelson (2003) Kelson, D. D. 2003, PASP, 115, 688
- Koch et al. (2008) Koch, A., et al. 2008, ApJ, 689, 958
- Koch & McWilliam (2008) Koch, A., & McWilliam, A. 2008, AJ, 135, 1551 (KM08)
- Koch & McWilliam (2010) Koch, A., & McWilliam, A. 2010, AJ, 139, 2289 (KM10)
- Koch & Côté (2010) Koch, A., & Côté, P. 2010, A&A, 517, A59
- Korn et al. (2007) Korn, A. J., Grundahl, F., Richard, O., Mashonkina, L., Barklem, P. S., Collet, R., Gustafsson, B., & Piskunov, N. 2007, ApJ, 671, 402
- Korn et al. (2003) Korn, A. J., Shi, J., & Gehren, T. 2003, A&A, 407, 691
- Kowalski (2007) Kowalski, P. M. 2007, A&A, 474, 491
- Kraft & Ivans (2003) Kraft, R. P., & Ivans, I. I. 2003, PASP, 115, 143
- Lind et al. (2008) Lind, K., Korn, A. J., Barklem, P. S., & Grundahl, F. 2008, A&A, 490, 777
- Lind et al. (2009) Lind, K., Primas, F., Charbonnel, C., Grundahl, F., & Asplund, M. 2009, A&A, 503, 545
- Lind et al. (2011) Lind, K., Charbonnel, C., Decressin, T., Primas, F., Grundahl, F., & Asplund, M. 2011, A&A, 527, A148
- McWilliam et al. (1995) McWilliam, A., Preston, G. W., Sneden, C., & Shectman, S. 1995, AJ, 109, 2736
- Mészáros et al. (2009) Mészáros, S., Dupree, A. K., & Szalai, T. 2009, AJ, 137, 4282
- Meszaros et al. (2008) Mészáros, S., Dupree, A. K., & Szentgyorgyi, A. 2008, AJ, 135, 1117
- Meylan & Mayor (1991) Meylan, G., & Mayor, M. 1991, A&A, 250, 113
- Milone et al. (2006) Milone, A. P., Villanova, S., Bedin, L. R., Piotto, G., Carraro, G., Anderson, J., King, I. R., & Zaggia, S. 2006, A&A, 456, 517
- Pietrinferni et al. (2004) Pietrinferni, A., Cassisi, S., Salaris, M., & Castelli, F. 2004, ApJ, 612, 168
- Ramírez & Meléndez (2005) Ramírez, I., & Meléndez, J. 2005, ApJ, 626, 465
- Reid & Gizis (1998) Reid, I. N., & Gizis, J. E. 1998, AJ, 116, 2929
- Richer et al. (2008) Richer, H. B., et al. 2008, AJ, 135, 2141
- Richard et al. (2005) Richard, O., Michaud, G., & Richer, J. 2005, ApJ, 619, 538
- Skrutskie et al. (2006) Skrutskie, M. F., et al. 2006, AJ, 131, 1163
- Sneden (1973) Sneden, C. 1973, ApJ, 184, 839
- Stromgren et al. (1982) Strömgren, B., Gustafsson, B., & Olsen, E. H. 1982, PASP, 94, 5
- Takeda et al. (2003) Takeda, Y., Zhao, G., Takada-Hidai, M., Chen, Y.-Q., Saito, Y.-J., & Zhang, H.-W. 2003, CJA&A, 3, 316
- Winkler (1997) Winkler, H. 1997, MNRAS, 287, 481
- Ventura & D’Antona (2008) Ventura, P., & D’Antona, F. 2008, A&A, 479, 805
- Woosley & Weaver (1995) Woosley, S. E., & Weaver, T. A. 1995, ApJS, 101, 181