Surveying the Agents of Galaxy Evolution in the Tidally-Stripped, Low Metallicity Small Magellanic Cloud (SAGE-SMC). II. Cool Evolved Stars
Abstract
We investigate the infrared (IR) properties of cool, evolved stars in the Small Magellanic Cloud (SMC), including the red giant branch (RGB) stars and the dust-producing red supergiant (RSG) and asymptotic giant branch (AGB) stars using observations from the Spitzer Space Telescope Legacy program entitled: “Surveying the Agents of Galaxy Evolution in the Tidally-stripped, Low Metallicity SMC”, or SAGE-SMC. The survey includes, for the first time, full spatial coverage of the SMC bar, wing, and tail regions at infrared (IR) wavelengths (3.6 – 160 µm). We identify evolved stars using a combination of near-IR and mid-IR photometry and point out a new feature in the mid-IR color–magnitude diagram that may be due to particularly dusty O-rich AGB stars. We find that the RSG and AGB stars each contribute of the global SMC flux (extended point-source) at 3.6 µm, which emphasizes the importance of both stellar types to the integrated flux of distant metal-poor galaxies. The equivalent SAGE survey of the higher-metallicity Large Magellanic Cloud (SAGE-LMC) allows us to explore the influence of metallicity on dust production. We find that the SMC RSG stars are less likely to produce a large amount of dust (as indicated by the color). There is a higher fraction of carbon-rich stars in the SMC, and these stars appear to able to reach colors as red as their LMC counterparts, indicating that C-rich dust forms efficiently in both galaxies. A preliminary estimate of the dust production in AGB and RSG stars reveals that the extreme C-rich AGB stars dominate the dust input in both galaxies, and that the O-rich stars may play a larger role in the LMC than in the SMC.
Subject headings:
circumstellar matter – Magellanic Clouds – stars: AGB and post-AGB – stars: carbon – stars: mass-loss – supergiants1. INTRODUCTION
The recent Spitzer Space Telescope (Werner et al., 2004; Gehrz et al., 2007) Legacy program entitled “Surveying the Agents of Galaxy Evolution in the Tidally-stripped, Low Metallicity Small Magellanic Cloud” (SAGE-SMC; Gordon et al., 2011) has provided a spatially and photometrically complete infrared (IR) survey of the evolved star population in the SMC. The resulting database allows us to study thermal emission from circumstellar dust created around stars in the late stages of evolution and places constraints on the total dust budget of the SMC. In this work, we present an overview of the cool, evolved stars in the SMC, specifically Red Giant Branch (RGB) stars, Asymptotic Giant Branch (AGB) stars, and Red Supergiants (RSGs). We compare our findings to those of the SAGE survey of the Large Magellanic Cloud (SAGE-LMC; Blum et al., 2006; Meixner et al., 2006; Bonanos et al., 2009, 2010; Srinivasan et al., 2009; van Loon et al., 2010a).
The RGB is among the most prominent features of the near-IR color–magnitude diagram (CMD). All stars with mass spend time on the RGB after exhausting core hydrogen and before igniting core helium (Becker, 1981). Cool effective temperatures (3000 – 5000 K) cause their bolometric luminosities to peak near 1 µm, requiring mid-IR photometry to constrain their basic stellar parameters. Little to no dust () is expected to form around RGB stars, and mass-loss rates are typically lower than (e.g., Boyer et al., 2009a, 2010b; McDonald et al., 2009, 2011a, 2011b; Momany et al., 2011; McDonald et al., 2011c)
Following the RGB phase and the subsequent core He-burning phase, the low- to intermediate-mass stars () will begin to ascend the AGB. Both RGB and AGB stars initially generate stellar winds via acoustic and/or electromagnetic chromospheric processes (Hartmann & MacGregor, 1980; Hartmann & Avrett, 1984). In more evolved AGB stars, the primary drivers of mass loss are pulsation and dust-driving. Pulsations can levitate material from the stellar surface and provide density enhancements and shocks, which can encourage dust formation and re-processing (e.g., Bowen, 1988; Winters et al., 2000, 2003; Schirrmacher et al., 2003; Woitke, 2006, 2007; Mattsson et al., 2008; van Loon et al., 2008b). The dust composition depends on the atmospheric chemistry (abundance of carbon relative to oxygen), which is altered by dredging up newly formed carbon to the surface of the star (the third dredge-up; Iben & Renzini, 1983). Radiation pressure on dust grains and grain–gas momentum coupling accelerates the stellar wind from the star (e.g., Sedlmayr & Dominik, 1995; Elitzur & Ivezić, 2001, and references therein). This mass loss continues until the stellar envelope has been ejected.
Individually, AGB stars produce comparatively small amounts of circumstellar dust (10 yr-1; e.g., van Loon, 2000; Groenewegen et al., 2009). Nevertheless, they exist in large numbers, collectively placing them among the most important known dust factories in the Universe (e.g., Gehrz, 1989).
AGB star luminosities peak in the near-IR, and circumstellar dust emits in the mid- to far-IR, making IR photometry and spectra essential for characterizing AGB stellar and dust properties. IR studies of low mass (), low metallicity () AGB stars in globular clusters (e.g., Boyer et al., 2006, 2008, 2009a, 2010b; Lebzelter et al., 2006; van Loon et al., 2006b, 2008a; Ita et al., 2007; McDonald et al., 2009, 2011a, 2011b, 2011d) indicate that AGB stars produce dust even at extremely low metallicities. Similar studies of AGB stars in Local Group dwarf galaxies (e.g., Jackson et al., 2007b, a; Groenewegen et al., 2007; Matsuura et al., 2007; Boyer et al., 2009b; Sloan et al., 2009) reveal diverse AGB populations depending on star formation history and show significant dust production at very low metallicities.
Super-AGB stars are the most massive AGB stars (5 – 10 ). These stars undergo efficient hot bottom burning (HBB; Smith & Lambert, 1985; Boothroyd & Sackmann, 1992) and are expected to suffer from weak thermal pulses, reach lower temperatures, and achieve higher mass-loss rates than their lower-mass cousins (Siess, 2010). There is evidence that these stars may be the progenitors of dust-enshrouded supernovae (Javadi et al., 2011).
Stars with masses 8 – 25 become RSGs (or red helium-burning stars), which generally have warmer effective temperatures than AGB stars. RSG stars do not undergo a third dredge-up, so they are exclusively O-rich. Like AGB stars, RSGs show strong mass loss, enriching the surrounding Interstellar Medium (ISM) with silicatious (e.g., Verhoelst et al., 2009) and sometimes also carbonaceous (Sylvester et al., 1994, 1998) material, though it is unclear whether the carbonaceous material is instead of interstellar origin. The dust-production rates of RSGs are similar to those of AGB stars, but RSGs are less numerous. Bonanos et al. (2009, 2010) examined the SAGE data of optically-selected RSGs in the Magellanic Clouds. Here, we take the opposite approach and select RSGs by their IR colors, accounting for very dust-enshrouded examples (cf., Elias et al., 1985; Wood et al., 1992; Roche et al., 1993; Groenewegen, 1998; van Loon et al., 2005a, b).
| Parameter | SMC | Ref. | LMC | Ref. |
|---|---|---|---|---|
| Distance, (kpc) | 611 | 1,5 | 511 | 1,5 |
| Metallicityaa The metallicities are likely lower for low-mass () stars., () | 6,7 | 6,7 | ||
| (mag) | 0.12 | 4,8bb The Schlegel et al. (1998) extinction map cites the total dust column, so yields an overestimate of the reddening affecting stars that lie somewhere along that column. Because the extinction towards the SMC is low, we do not expect this to have a significant impact on the results. | 0.46 | 2,3 |
| (mag) | 0.04 | 4,8 | 0.15 | 9 |
| 3.6-µm TRGB (mag) | 12.6 | 10 | 11.9 | 10 |
Globular cluster studies are limited by their single, low-mass () stellar populations, and in most dwarf galaxies, evolved stars are easily confused with unresolved background galaxies due to the limited resolution of mid-IR imaging (). The Magellanic Clouds suffer neither of these limitations by containing multiple populations and being close enough that evolved stars generally outshine unresolved galaxies. Studies of the Magellanic Clouds provide valuable insight into the environments of more distant star-forming galaxies.
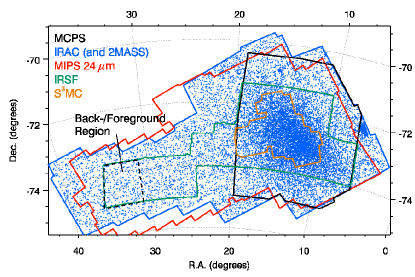
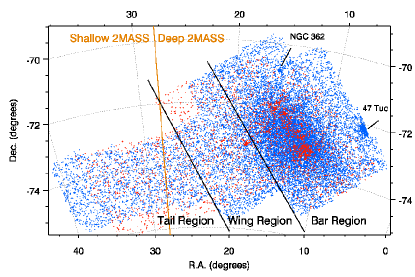
Several near-IR and mid-IR surveys of the SMC have been conducted in recent years, including an survey (3.2 – 24 µm; Ita et al., 2010) of small selected regions within the SMC bar and the Spitzer Survey of the Small Magellanic Cloud (S3MC; Bolatto et al., 2007), which imaged the SMC bar at 3.6 – 160 µm. The SAGE-SMC survey is unique in its full spatial coverage of not only the SMC bar, but the wing and tail regions as well (Section 2), allowing us to examine the SMC structure using the distribution of the cool evolved stars. The SMC is known to have an extended halo of old stars (Nidever et al., 2011). Stars in the tail may have been stripped from the SMC bar, but the stars beyond the tail and into the Magellanic bridge likely formed in situ, from a tidally-stripped filament of gas (Harris, 2007).
This paper is organized as follows. In Sections 2 and 3, we describe the data and evolved star photometric classification. In Section 4, we present the observational properties of RGB, RSG, and AGB stars in the LMC and SMC, and in Section 5, we use the evolved stars as probes of the SMC environment. Finally, we summarize our findings in Section 6. Throughout this work, we adopt the parameters listed in Table 1. The extinction in the Spitzer bands is from Indebetouw et al. (2005).
2. SAGE-SMC Data
The photometry presented here is from the SAGE-SMC archive catalog, available from the Spitzer Science Center. Photometric uncertainties are typically 0.1 mag for all wavelengths, but increase to 0.2 mag for the faintest 2 magnitudes. Mid-IR sources were matched to 24 µm sources with correlation thresholds . See Gordon et al. (2011) for a description of the observations, data reduction, and point-source extraction. Two epochs of SAGE-SMC data were obtained, separated by three months. The photometry presented here was extracted from a co-addition of both epochs, limiting spurious detections from transients and artifacts. A third epoch of observations from S3MC is also included in the co-addition where the coverage overlaps (Fig. 1). Variable AGB stars show 3.6 µm (or , at 3.78 µm) absolute magnitude amplitudes typically in the range of mag (e.g., Le Bertre, 1992; McQuinn et al., 2007; Vijh et al., 2009). Having two epochs of data helps to minimize variability effects, and any remaining systematic effects are minimal since we are looking at a large population of AGB stars.
The SAGE-SMC catalog includes optical photometry from the Magellanic Clouds Photometric Survey (MCPS; Zaritsky et al., 2002), photometry from the 2-Micron All Sky Survey (2MASS; Skrutskie et al., 2006) and the InfraRed Survey Facility survey (IRSF; Kato et al., 2007), mid-IR photometry (3.6, 4.5, 5.8, and 8 µm) from Spitzer’s InfraRed Array Camera (IRAC; Fazio et al., 2004), and far-IR photometry (24, 70, and 160 µm, epoch 1) from the Multiband Imaging Photometer for Spitzer (MIPS; Rieke et al., 2004). Figure 1 shows the spatial coverage of each survey.
2.1. Color–magnitude Diagrams
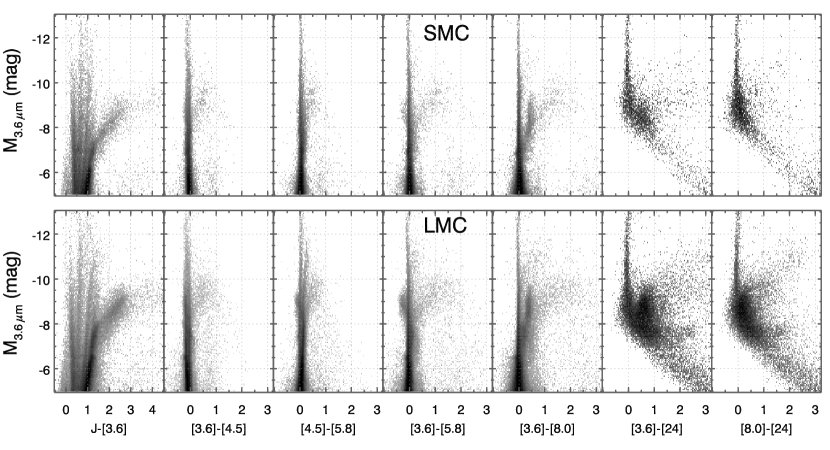
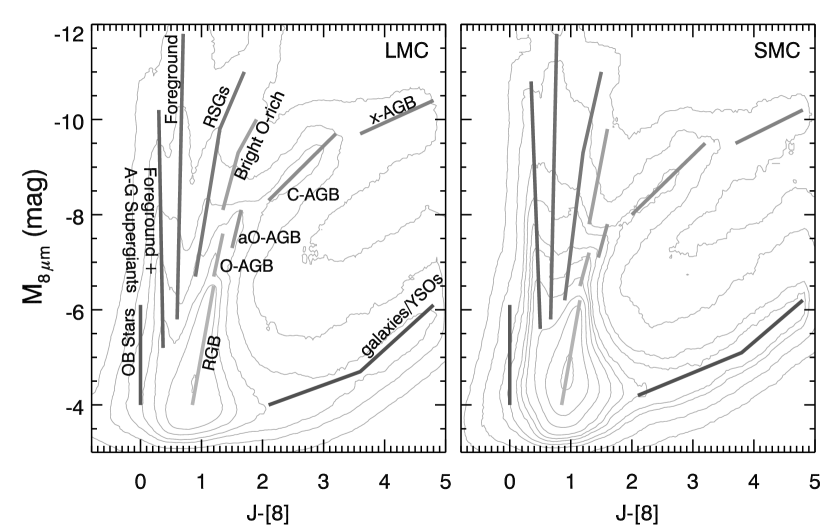
Near-IR to mid-IR stellar density CMDs for the SMC and the LMC, also known as Hess diagrams, are shown in Figure 2. We see the effects of stellar temperature in the near-IR, with several distinct features apparent in the CMDs. These include branches that trace the foreground stars, RSGs, hot OB stars, background galaxies, and AGB stars. These features are labeled in a color vs. 8 µm absolute magnitude () CMD in Figure 4, which is discussed more in Section 3.1. Moving into the mid-IR, the stellar temperature no longer affects the CMD since we are sampling only the Rayleigh–Jeans tail of the Planck function. Instead, molecular and dust spectral features cause distinct photometric features (see Section 3.1).
The morphologies of SMC and LMC CMDs look remarkably similar. The metallicity difference between the galaxies () causes only a small difference in the IR colors, with the higher metallicity LMC appearing slightly redder ( mag, mag). The distances to the MCs adopted here (Table 1) are uncertain, so differences in the absolute 3.6-µm magnitudes (y-axis in Figure 2; the SMC stars appear slightly fainter) may not be intrinsic. A downwards 5 kpc shift in the relative distance of the MCs eliminates the magnitude differences, but this is well beyond the uncertainty of recent distance measurements (e.g., Szewczyk et al., 2009). Uncertainties in the distance due to depth along the line-of-sight in both galaxies is small (a few hundredths of a magnitude), and may be largest in the SMC wing (Subramanian & Subramaniam, 2009). The extinction towards both the Magellanic Clouds is low ( mag), so this cannot explain the difference 3.6 µm magnitude.
2.2. Foreground and Background Contamination
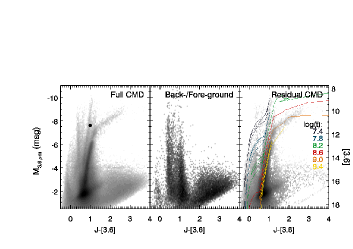
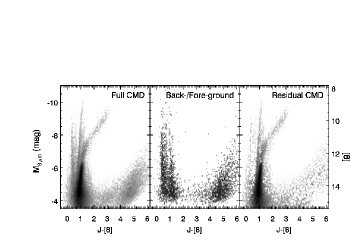
Because we have imaged such a large area around the SMC, we can use the data on the outskirts of the coverage to estimate the approximate level of foreground and background contamination. Figure 3 shows the CMD of the full SMC coverage compared to the CMD of a 1.6 deg2 region on the eastern edge of the SMC tail/bridge (Fig. 1). The most prominent feature in the full CMD (where the source density is highest) is the RGB. Since no RGB is visible in the back-/fore-ground CMD and since all other CMD features are vertical, we are confident that the region we have chosen does indeed contain very few SMC-member sources.
Subtracting the back-/fore-ground CMD from the full SMC CMD (Fig. 3, right) reveals well-defined branches of RSG and hot OB-stars in addition to the RGB (see Fig. 4). A set of Padova isochrones (Marigo et al., 2008) are shown for reference. A population of A–G supergiants also appears (cf. Bonanos et al., 2009, 2010), along with a population of faint sources ( mag) redder than . The latter sources may be dominated by young stellar objects (YSOs; M.Sewiło et al. 2011, in preparation).
While it is difficult to eliminate individual foreground and background sources with photometry alone, we can estimate the level of contamination statistically. In the box used to represent the back-/fore-ground contamination described above, there is a point-source density of sources deg-2. However, this is an overestimate of the contamination in our evolved star samples since many of these contaminating sources are bluer and/or fainter than typical cool evolved stars and are not included in our selection criteria (Section 3). When we apply our selection criteria to the back-/fore-ground region, we find that our RGB sample suffers the worst contamination, with 708 sources deg-2, followed by the RSG sample with 37 sources deg-2 and oxygen-rich AGB (O-AGB) sources with 1.9 sources deg-2. None of the other types of AGB stars are detected in this region, so contamination of those samples is very low. After considering the size of the IRAC spatial coverage (30 deg2; Gordon et al., 2011), we expect contamination to account for 35%, 18%, and 2.5% of the RSG, RGB, and O-AGB samples, respectively.
Aside from the spatially uniform contamination from foreground and background sources, stars belonging to the foreground globular clusters 47 Tuc and NGC 362 (Fig. 1) have similar near-IR colors to SMC evolved stars. To minimize this contamination, we exclude all stars within 8′ and 5′ of the centers of 47 Tuc and NGC 362, respectively. This corresponds to the elimination of 120 stars from the RGB sample and 108 stars from the RSG sample. Only 5 stars are eliminated from the AGB sample: 4 O-rich, and one C-rich.
3. Stellar Classification
3.1. Color–magnitude selection of cool evolved stars
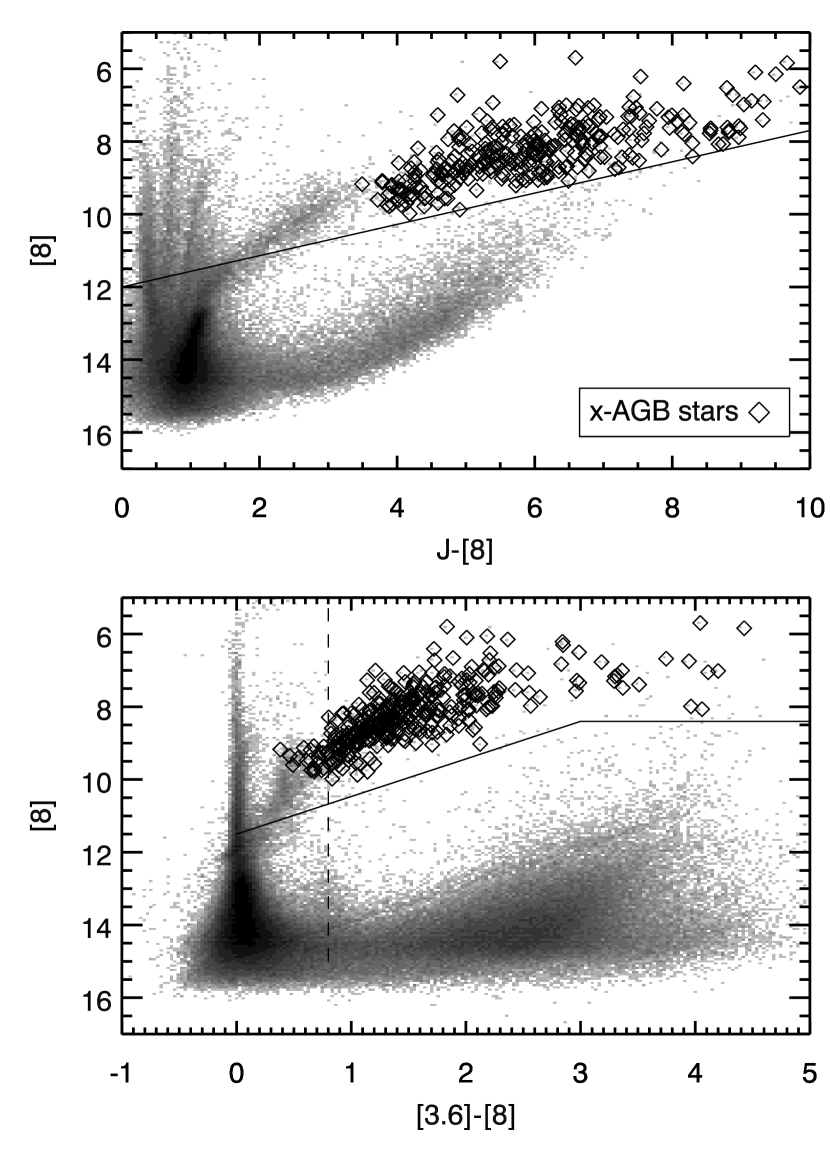
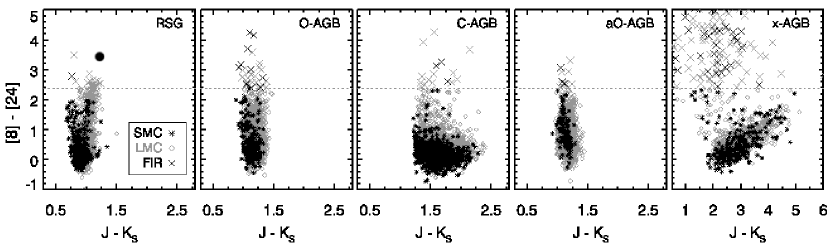
Figure 4 labels each branch in the vs. CMD. AGB stars occupy the reddest and brightest branches, separating into O-AGB, carbon-rich stars (C-AGB), heavily-extinguished “extreme” stars (x-AGB), and a new feature that we are calling the anomalous O-rich branch (aO-AGB; Section 3.1.5). RGB stars are the most populous source type, occupying the branch just below the AGB stars, at mag. RSG stars are just to the blue edge of the O-AGB stars, though 10-µm silicate emission captured toward the red cutoff of the 8-µm IRAC band results in redder colors, causing overlap between the two branches in this diagram.
The vs CMD is a good diagnostic for classifying the different cool evolved stars. However, the classification accuracy is limited in stars that have strong 10-µm silicate features, which affect the 8-µm flux. Instead, we use the vs. CMD to separate RGB, RSG, C-AGB, and O-AGB stars and turn to the mid-IR colors to select x-AGB stars (which are often undetected in the near-IR) and aO-AGB stars (which are only discernible by their colors). The classification schemes are outlined below, and the results are listed in Table 2.
| SMC | LMC | |||
|---|---|---|---|---|
| Population | N | aa is the number of sources with 24-µm counterparts. | N | |
| Point-sources in both and [3.6] | 458 558 | 9 793 | 2 301 842 | 39 740 |
| Point-sources with TRGB[3.6]bb The 3.6-µm TRGB is 12.6 mag and 11.9 mag in the SMC and LMC, respectively. | 19 290 | 3 878 | 45 780 | 18 337 |
| C-AGB starscc The number in parentheses is the number of stars in the original C-AGB or O-AGB sample, based on the classification using color, that are re-classified as aO-AGB stars (Section 3.1.5). | 1 729 (54) | 964 (4) | 6 212 (156) | 5 246 (32) |
| Faint O-AGB stars ( mag)cc The number in parentheses is the number of stars in the original C-AGB or O-AGB sample, based on the classification using color, that are re-classified as aO-AGB stars (Section 3.1.5). | 2 251 (1 190) | 76 (113) | 9 441 (6 223) | 1 288 (2 880) |
| Bright O-AGB stars ( mag) | 227 | 173 | 1 422 | 1 300 |
| Extreme AGB stars | 349 | 323 | 1 105 | 1 018 |
| aO-AGB stars | 1 244 | 117 | 6 379 | 2 912 |
| RSG stars | 3 325 | 538 | 4 604 | 1 560 |
| RGB stars | 135 437 | 41 | 407 342 | 580 |
| FIR objects in AGB and RSG samples | 57 | 57 | 224 | 224 |
| FIR objects in RGB sample | 303 | 303 | 1 262 | 1 262 |
Note. — See Section 3.1 for a description of the stellar classifications. FIR objects were originally classified as either AGB, RSG, or RGB stars, but have been split into their own category.
3.1.1 C-AGB and O-AGB stars
C-AGB and O-AGB stars are selected using color–magnitude cuts in the vs. CMD. Any very dusty RSG stars will be very red in due to dust extinction, so these sources may be included in our O-AGB and C-AGB samples. There is no way to distinguish very dusty RSG stars from dusty AGB stars with IR photometry alone, but we expect them to be uncommon compared to their less-dusty counterparts.
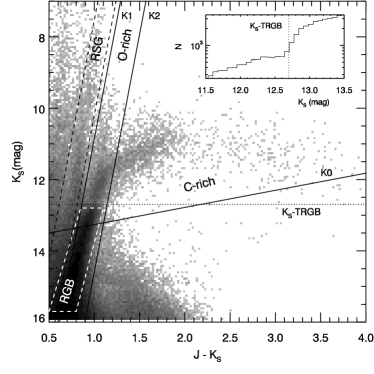
Figure 5 shows the color cuts from Cioni et al. (2006a), adjusted for metallicity and distance, following Cioni et al. (2006b) and using and kpc. We shift the K0 line slightly fainter to account for the difference in the -band tip of the red giant branch (TRGB) between the SMC and LMC and to assure that we include the full C-AGB sample. C-AGB stars fall redward of the K2 boundary, O-AGB stars fall between the K1 and K2 lines, and all AGB stars are brighter than the K0 line (except x-AGB stars, see Section 3.1.2).
To eliminate contamination from RGB stars in our AGB sample, we exclude stars that are fainter than both the TRGB in and 3.6 µm (Fig. 5, inset). By checking the TRGB at two wavelengths, we are sure not to exclude the more heavily-extinguished stars that might be fainter than the TRGB. -band TRGBs are from Cioni et al. (2000), and the 3.6-µm TRGBs are estimated here to be mag ( mag) for the LMC and mag ( mag) for the SMC, similar to other Local Group dwarf galaxies (Cioni et al., 2000; Jackson et al., 2007a, b; Matsuura et al., 2007; Boyer et al., 2009b). We neglect the population of non-dusty AGB stars that fall below the TRGB, as most of these have not yet undergone a third dredge-up and behave quite differently from their more-evolved counterparts.
We note that the O-AGB stars can also be divided into a bright and faint population, which occupy very different regions of the vs. CMD (See Fig. 9). Following Srinivasan et al. (2009), the bright and faint O-rich AGB stars are divided by mag, and we often treat them separately throughout this paper. A subset of the bright O-AGB stars show strong 8- and 24-µm excess (Section 4.1); it is among these sources that we might find the more massive super-AGB stars (Section 1).
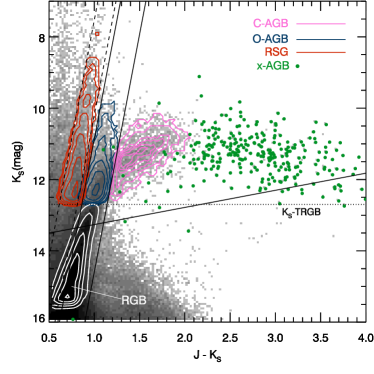
The lower panel of Figure 5 shows the selected AGB stars overlain on the CMD. Detection statistics are summarized in Section 3.3 and Table 2. We also remind the reader here that while the SMC C-AGB population includes virtually no foreground and background sources, such contamination accounts for 2.5% of the SMC O-AGB population (Section 2.2).
3.1.2 x-AGB stars
The x-AGB stars are those that are most likely to be experiencing a “superwind”, where the mass-loss rate can increase by a factor of 10, and a thick dust envelope obscures the star at optical wavelengths (cf. van Loon et al., 2006a). The mass-loss rate eventually exceeds the nuclear consumption rate, and so determines the subsequent evolution of the star. The physical mechanism that causes a star to enter the superwind phase is not well understood, though x-AGB stars are known to have longer pulsation periods than other AGB stars (Riebel et al., 2010).
Due to circumstellar dust extinction, many x-AGB stars fall below the K0 line and the -TRGB (Fig. 5). We thus turn to the mid-IR photometry to recover these sources. As in Blum et al. (2006) and Srinivasan et al. (2009), we identify x-AGB stars as those brighter than the 3.6-µm TRGB and with mag. Some of the most heavily dust-enshrouded x-AGB stars are totally undetected in the near-IR. Therefore, if there is no near-IR detection, but and the star is brighter than the 3.6-µm TRGB, then it is also included in the initial list of x-AGB stars.
To minimize contamination from YSOs and unresolved background galaxies, we also apply the following restrictions: x-AGB stars must be brighter than an empirical boundary in the vs CMD and the vs. CMD, defined as:
| (1) |
| (2) |
Equation (2) terminates at mag, and extends horizontally out to redder colors (Fig. 6). The final number of x-AGB stars in both the LMC and SMC is reported in Table 2.
There is a small population of very red x-AGB stars with mag. We list these sources in Table 3. The reddest source ( mag) is not an x-AGB; it is the YSO S3MC 01051–7159 (van Loon et al., 2010b). The others are not identified in the literature.
| R.A. (J2000) | Decl. (J2000) | |
|---|---|---|
| 00h48m08.49s | –731454.7 | 4.20 |
| 01h00m41.61s | –723800.7 | 4.06 |
| 01h04m53.13s | –720403.9 | 3.51 |
| 01h05m03.13s | –715929.7 | 3.96 |
| 01h05m03.97s | –715925.4 | 4.11 |
| 01h05m07.26s | –715942.8 | 4.43aa This source is the YSO S3MC 01051–7159 (van Loon et al., 2010b, and references therein). |
| 01h08m17.51s | –725309.2 | 3.75 |
| 01h24m07.95s | –730904.0 | 4.04 |
| 02h35m18.63s | –742954.0 | 3.95 |
3.1.3 RSG stars
Stars within the branch just blueward of the K1 line in Figure 5 are classified here as RSG stars. We restrict the branch width to mag and leave a 0.5 mag gap between the O-AGB stars and the RSG stars to minimize contamination between the two stellar types. We also restrict our selection of RSGs to those brighter than the -band TRGB, which has the effect of excluding the low-mass RSGs. This restriction helps to minimize contamination from foreground sources and RGB stars (see Section 2.2). However, we estimate that 35% of the final SMC RSG selection is still due to foreground and background sources (Section 2.2).
3.1.4 RGB stars
The RGB stars are the most difficult to select, as they are affected by contamination from foreground sources, and unresolved background galaxies (Section 2.2), and also from YSOs. We are also limited by sensitivity, so the RGB sample included in this work is not complete. We define RGB stars as those within the box outlined by a white, dashed line in Figure 5, which spans from (TRGB + 0.1 mag) (TRGB + 3 mag). The 0.1 mag buffer reduces contamination from early-AGB stars.
From this sample of RGB stars, we exclude sources redder than a line in the vs CMD, defined as:
| (3) |
where , to eliminate background sources. In Section 2.2, we noted that 18% of the SMC population is likely contamination from foreground and background sources.
3.1.5 aO-AGB stars: a new feature in the IR CMD
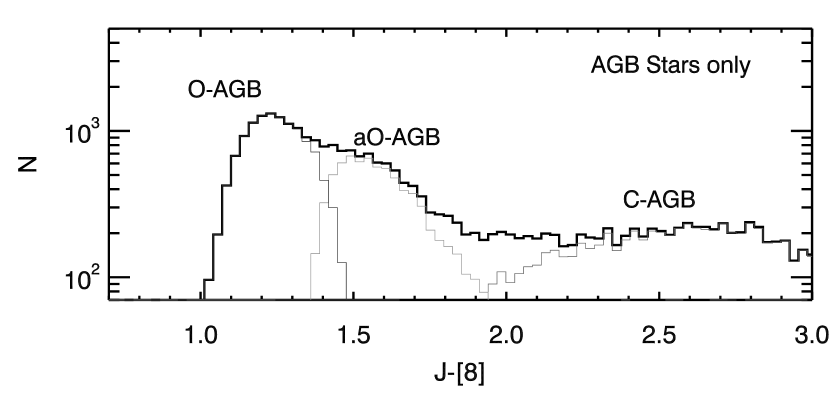
An unidentified feature is apparent in the CMD (Section 3.1, Fig. 4). The feature is stronger in the LMC, but is also present in the SMC, and it suggests the existence of a population of stars that is distinct from the O-AGB and C-AGB stars. Figure 7 shows the new population of stars as a bump in the SMCLMC AGB histogram between O-AGB and C-AGB stars. We note that 96% of this new group of stars (or 98% in the LMC) are classified as O-rich using the classification scheme from Cioni et al. (2006a), and we thus label them anomalous O-rich AGB stars (aO-AGB) here.
To select stars belonging to the new CMD feature, we have examined the LMC and SMC vs. Hess diagrams (Fig. 4) in color and magnitude space to choose the boundaries between the C-AGB branch, the O-AGB branch and the unidentified CMD feature. These boundaries correspond to the regions of minimum stellar density or prominent density changes between CMD features. We thus select aO-AGB stars from the original O-AGB sample if they are redder than the line defined by equation 3, with , and fainter than mag. Stars from the original C-AGB sample that are bluer than the line defined by equation 3, with , are also classified as aO-AGB stars.
The aO-AGB stars may simply be a subset of O-rich AGB stars that have formed (or are just beginning to form) a significant amount of dust. Low-mass AGB stars or AGB stars that have not yet evolved much along the AGB may not be very dusty. We see this in globular clusters, which show that not all stars at the TRGB exhibit excess IR emission attributed to dust (Boyer et al., 2009a; McDonald et al., 2009, 2011a). These aO-AGB stars may therefore be the dusty siblings of “naked” O-AGB stars. Many of the aO-AGB stars also show excess 24-µm emission (see Section 4.1), which supports this scenario.
It is also possible that the aO-AGB stars are O-rich AGB stars with particularly strong and/or broad silicate emission, causing a redder color than stars with weaker silicate emission. It is unknown what sort of star or what stage of AGB evolution would cause such a silicate enhancement.
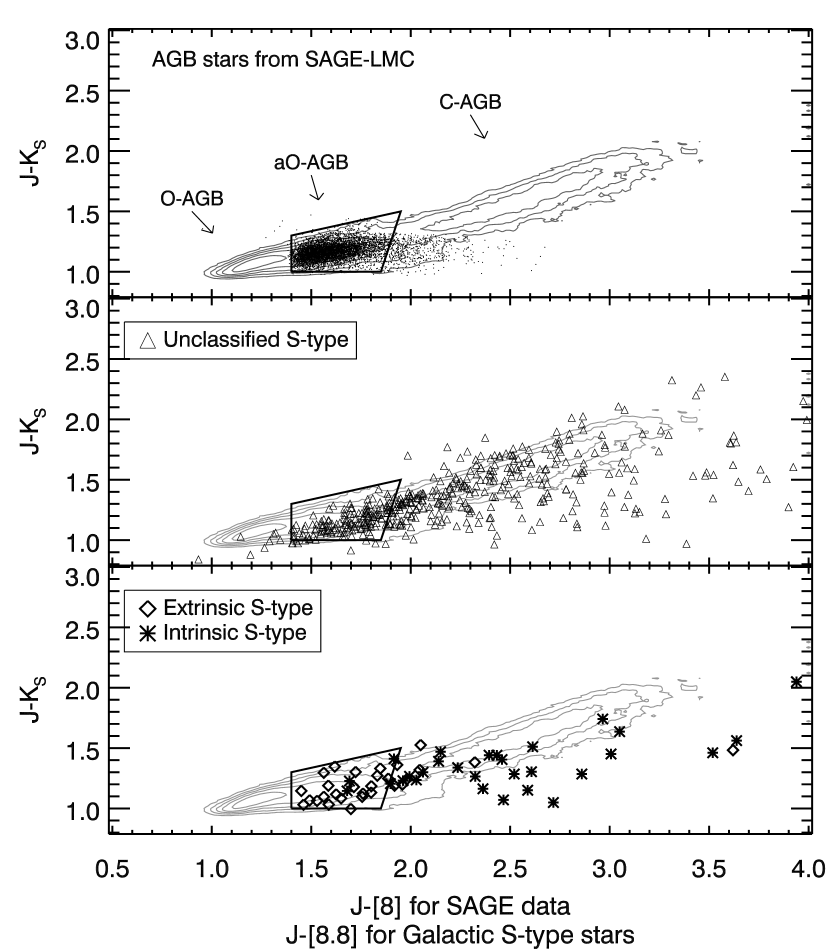
A third possibility is that the aO-AGB stars may be S-type AGB stars. S-type stars show many spectral features corresponding to s-process elements, and the C/O ratio in such stars is near unity. A collection of near-IR magnitudes from 2MASS and 8.8-µm magnitudes from the Midcourse Space Experiment () of Galactic S-type AGB stars was compiled by Wang & Chen (2002) and Yang et al. (2006), and has been featured in a number of studies (e.g., Guandalini & Busso, 2008; Zhang et al., 2010). These studies find that S-type AGB stars have IR colors very similar to our aO-AGB stars, and intermediate to O-AGB and C-AGB IR colors. Figure 8 shows the vs. color–color diagram (CCD) of AGB stars in the LMC with the S-type and colors from Yang et al. (2006) also plotted. We note that Kastner et al. (2008) show that -band photometry (centered at 8.8 µm) is systematically 0.1 – 0.6 mag brighter than the Spitzer 8-µm band for evolved stars over a broad range of color (see their Fig. 6), so some of the Galactic S-type stars will have slightly redder colors in Figure 8 than the SAGE stars. Most aO-AGB stars occupy the region outlined by the black box, and a sizable portion of the Galactic S-type stars also occupy this space. There is also an indication that extrinsic S-type stars (those whose s-element enhancement is due to mass transfer from an AGB binary companion) preferentially occupy the space belonging to the aO-AGB stars, as opposed to intrinsic S-type stars (those whose s-element enhancement is due to their own third dredge-up), which tend to be redder.111Extrinsic and intrinsic classifications are from Wang & Chen (2002), and are based on Tc-enrichment However, a lower metallicity may cause SMC and LMC intrinsic S-type stars to make the transition from O-rich to C-rich more quickly than in the Galaxy. This would result in a less-developed dusty envelope in the Magellanic intrinsic S-type stars, and thus cause a smaller IR excesses than Galactic intrinsic S-type stars. It is therefore difficult to estimate whether an intrinsic or extrinsic classification is more likely if the aO-AGB stars are indeed S-type stars. Extrinsic and intrinsic S-type AGB stars have similar luminosities, so they cannot be distinguished by their absolute magnitudes.
Spectra showing s-process elements or dust features typical of S-type stars (e.g., Hony et al., 2009; Smolders et al., 2010) are required to confidently identify our aO-AGB stars as S-type. Hony et al. (2009) find that IR features of intrinsic S-type AGB stars (extrinsic S-type stars rarely show 12-µm excess indicative of dust) are similar to those of O-rich AGB stars, but the 10-µm silicate features of S-type stars are smoother, with O-rich AGB stars showing at least three distinct components due to amorphous silicates and aluminum oxide. Since the edge of the silicate feature is captured in the IRAC 8-µm band, the differing shape of the feature may be the cause of the difference in color between O-AGB and aO-AGB stars, as seen here. However, Figure 8 indicates that the aO-AGB stars are more likely to be extrinsic than intrinsic, so they should not exhibit silicate features at all. In any case, if S-type classification is confirmed, the color may prove a useful photometric diagnostic for identifying S-type AGB star candidates when spectra are unavailable. We note, however, that the aO-AGB stars account for nearly 20% of the SMC AGB population, which is higher than what might be expected of S-AGB stars. Inspection of Figure 7 shows that the aO-AGB stars likely include O-AGB stars that are in the tail of the color distribution. It is not possible to separate aO-AGB stars and O-AGB stars in this region with SAGE photometry, so it is possible that we have overestimated the number of aO-AGB stars and underestimated the number of O-AGB stars. Therefore, while some of the aO-AGB stars may be S-type, we expect that many (or indeed most) are instead the dusty cousins of regular O-AGB stars.
3.1.6 Far-IR Objects
Sources with spectral energy distributions (SEDs) that rise from 8 to 24 µm are typically unresolved background galaxies, compact H II regions, planetary nebulae (PNe), or YSOs (Whitney et al., 2003). Gruendl & Chu (2009) identify YSOs in the LMC SAGE data, and 700 of 703 of their YSOs show this type of rising SED. We call these sources far-IR (FIR) objects.
In the SMC, 57 FIR sources fall within the AGB and RSG photometric selection criteria described in the previous sections, especially among the O-AGB and x-AGB samples. We show the SEDs of these FIR sources in Figures 10 and 11. The vast majority of the FIR sources are located within star-forming regions in the bar and wing, with only a handful located on the outskirts of the bar (see Figs. 12 – 15).
It is possible that there is a small number of extremely enshrouded evolved stars among these FIR objects; in the LMC, there is an RSG (IRAS 052806910) whose dusty envelope causes its SED to peak near 30 µm and strong silicate self-absorption suppresses the 8-µm flux (e.g., Boyer et al., 2010a). These objects, which are on the verge of becoming post-AGB stars, are short-lived ( yr, van Loon et al., 2010a), so are extremely rare. The SEDs of known PNe are also similar to those shown in Figures 10 and 11 (Hora et al., 2008). It is unclear how many of the FIR sources are truly evolved stars; since the exclusion of these sources might mean the exclusion of the dustiest evolved stars, we retain them in our analysis, albeit in a separate category of FIR objects.
Our sample of FIR objects contains only one confirmed evolved star; the RSG BMB-B 75 was originally classified as an O-AGB by its mid-IR colors (3.1.1). Five FIR sources are classified as YSOs through modeling of their SEDs (Bolatto et al., 2007; Simon et al., 2007). In addition, eight are confirmed as YSOs using far-IR Spitzer data (van Loon et al., 2010b), and eight more are classified as H II regions or emission line stars by Wilke et al. (2003, and references therein). Most of the FIR objects (49 of 57) are classified as YSOs by J.M.Oliveira et al. (2011, in preparation), L.Carlson et al. (2011, in preparation), and M.Sewiło et al. (2011, in preparation) based on their mid-IR colors. The coordinates and photometry of the FIR objects that fall within our evolved star classifications are listed in Table 4, along with the other evolved stars.
3.2. Remaining Contamination
While our selection criteria eliminate most contamination from other source types, we can estimate the degree to which our evolved star samples are still contaminated by YSOs and compact H II regions. Even after separating the FIR objects from the evolved stars, there remains some overlap between our AGB sample (Table 2) and a catalog of SMC YSO candidates compiled by Sewiło et al. (2011, in preparation), who also use IR color–magnitude cuts to identify sources. According to their catalog, YSOs make up 1% of our final C- and O-AGB samples and 6% of the x-AGB sample.
Kastner et al. (2008) derived - and 8-µm color cuts for various sources in the LMC (see their Table 3). Using these cuts, we find that the x-AGB sample may contain only 3 H II regions, even after adjusting the cuts slightly to account for the metallicity difference between the LMC and SMC. Their RSG cuts are not usable here as they overlap strongly with our C-AGB and O-AGB sources, and do not include the bulk of the stars identified here as RSGs (e.g., Fig. 4).
Background galaxies are identified in the SAGE-LMC data by Gruendl & Chu (2009) through examination of the mid-IR SEDs and images. Only 5 probable background galaxies from their selection are included in our LMC x-AGB sample, so we expect the total contamination from unresolved background galaxies to be low in both the LMC and SMC samples.
The color-cuts chosen to distinguish O-AGB from C-AGB stars are approximate, and it is likely that there is cross-contamination between the two samples. We discuss this more in Sections 4.1 and 4.3.
3.2.1 Classification Summary
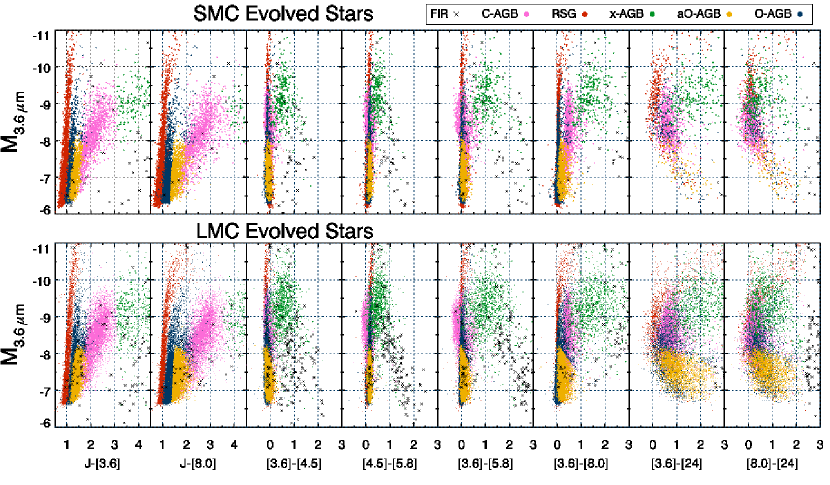
Our catalog of evolved stars and FIR objects for both galaxies is available electronically (see Table 4 for a sample from the SMC). Figure 9 presents CMDs spanning optical to IR wavelengths of the selected AGB and RSG stars. Several dust and molecular features are visible; the C-AGB stars (pink) show blue and colors due to absorption from CO and/or C3 at µm. The x-AGB stars (green), which tend to be carbon-rich (e.g., van Loon et al., 1997, 2006b, 2008b; Matsuura et al., 2009), often show absorption of HCN C2H2 near 3 µm, causing very red , , and colors (Matsuura et al., 2008). MgS emission in x-AGB stars can inflate the 24-µm flux, causing very red and colors. Strong silicate features in O-AGB (dark blue) and RSG (red) stars cause excess 8- and 24-µm emission. There is also a small subset of x-AGB stars that are O-rich, typically OH/IR stars, whose silicate features also enhance the 8- and 24-µm flux (Wood et al., 1992; van Loon et al., 2001a, b, 2005b). Continuum dust emission also causes red colors in the IR CMDs. For examples of typical mid-IR spectra of LMC stars that show the features described above, see Woods et al. (2011).
| IRAC | MIPS | |||||
|---|---|---|---|---|---|---|
| IRAC Designation | Classification | |||||
| SSTISAGEMA J001821.19-733601.0 | C-AGB | 9.710.04 | 9.710.02 | 9.580.04 | 9.120.02 | 9.240.05 |
| SSTISAGEMA J001941.08-732111.0 | RSG | 9.920.02 | 9.920.02 | 9.740.02 | 9.500.03 | 9.510.07 |
| SSTISAGEMA J002020.39-735058.7 | C-AGB | 10.520.04 | 10.480.04 | 10.450.06 | 9.920.05 | 9.770.06 |
| SSTISAGEMA J002124.62-734450.1 | x-AGB | 9.850.03 | 9.550.03 | 9.230.02 | 8.820.02 | 8.860.04 |
| SSTISAGEMA J002132.72-735222.7 | C-AGB | 10.390.03 | 10.090.03 | 9.620.04 | 9.160.04 | 8.880.04 |
| SSTISAGEMA J002240.79-733246.9 | C-AGB | 10.280.02 | 10.300.02 | 10.060.02 | 9.720.03 | 9.830.08 |
| SSTISAGEMA J002249.44-730350.1 | C-AGB | 10.860.03 | 10.910.03 | 10.560.04 | 10.400.03 | 10.350.10 |
| SSTISAGEMA J002313.05-732835.0 | RGB | 12.660.03 | 12.690.03 | 12.600.06 | 12.520.07 | 10.420.13 |
| SSTISAGEMA J002357.70-732542.3 | aO-AGB | 11.340.04 | 11.330.04 | 10.960.04 | 10.790.05 | 11.060.23 |
| SSTISAGEMA J002358.64-733804.0 | FIR | 12.500.03 | 11.580.03 | 10.120.02 | 8.320.02 | 4.130.01 |
Note. — A sample from the SMC evolved star catalog is shown here. The full catalog is available electronically, and also includes MCPS and 2MASS magnitudes. Magnitudes in this table have not been corrected for reddening.
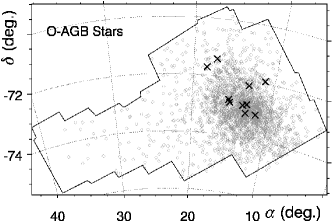
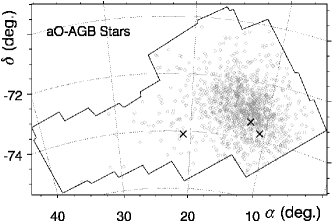
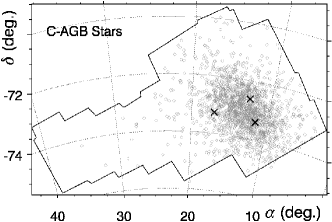
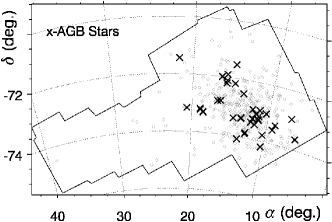
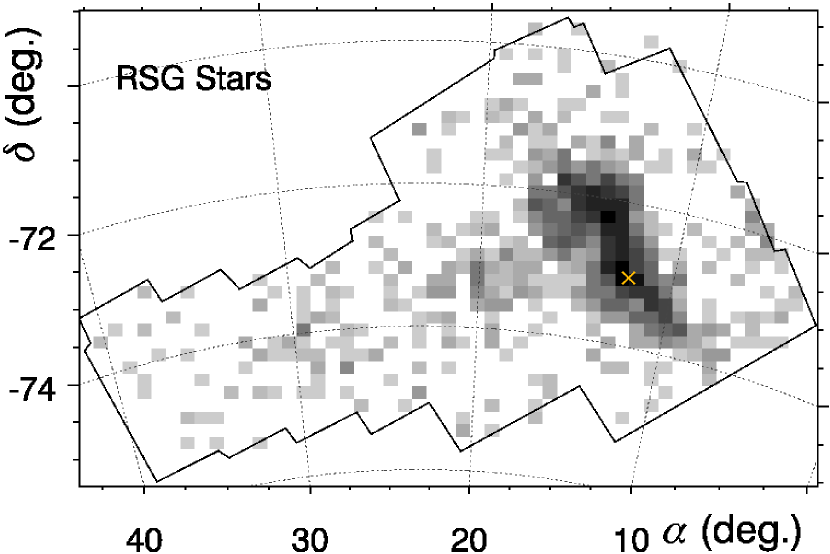
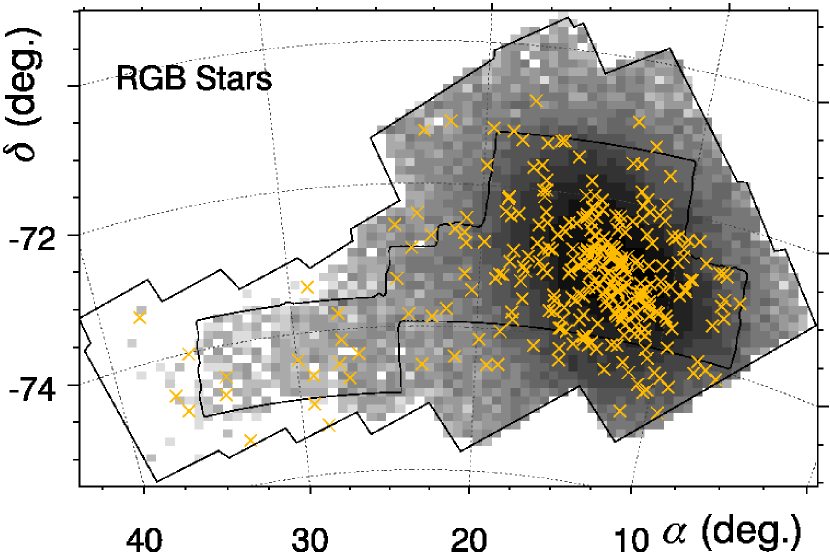
The spatial distributions of FIR objects and RGB, RSG, and AGB stars are presented in Figures 12 – 15. The RGB stars show a smooth distribution from the bar to the tail, with a drop in density where the 2MASS data transits from deep to shallow coverage and there is no IRSF coverage. Most AGB stars are restricted to the bar, where they constitute 0.4% of the total 3.6-µm point-source population (Section 3.3). In the tail, this same fraction is 10 smaller. RSG stars show a clumpier distribution than the AGB stars, likely due to recent star formation (e.g., Harris & Zaritsky, 2004; Gieles et al., 2008). The RSG and RGB branches tend to be affected by foreground contamination, so we have subtracted the estimated foreground level from Figures 14 and 15 (Section 2.2). The resulting distribution of RSG stars outlines the bar and wing.
FIR sources among each population are also plotted in Figures 12 – 15. These sources are preferentially distributed in the bar, suggesting that most of them are either very dusty evolved stars, H II regions, or YSOs belonging to the SMC. Among the x-AGB sample, the FIR objects are especially clustered around regions of star formation in the north and south regions of the bar and in the wing. FIR objects in the RGB sample are detected out to edge of the coverage, suggesting that many of these are unresolved background galaxies.
3.3. Detection Statistics
| AGB Type | % of AGB Stars | |
|---|---|---|
| SMC | LMC | |
| O-AGB | 42.7 1.0% | 44.2 0.5% |
| C-AGB | 29.8 0.8% | 25.3 0.4% |
| x-AGB | 6.0 0.3% | 4.5 0.1% |
| aO-AGB | 21.5 0.7% | 26.0 0.4% |
| % of Total Point-Sourcesaa Percentage of the total number of point-sources detected in both and [3.6] (Table 2). | ||
| SMC | LMC | |
| O-AGB | 0.540 0.011% | 0.472 0.003% |
| C-AGB | 0.377 0.009% | 0.280 0.005% |
| x-AGB | 0.076 0.004% | 0.048 0.001% |
| aO-AGB | 0.271 0.008% | 0.277 0.003% |
| RSG | 0.725 0.013% | 0.200 0.001% |
| RGB | 29.5 0.091% | 17.7 0.030% |
| FIR | 0.079 0.001% | 0.065 0.001% |
The detection statistics for SAGE-SMC are listed in Table 2 and 5. The SMC has a higher fraction of C-rich stars (x-AGB stars tend to have a C-rich chemistry). This is not unexpected since a generally low oxygen abundance in low-metallicity stars and in situ carbon enrichment in thermally-pulsing AGB stars make it easier to achieve C/O , which is required to form carbon-rich dust. The same phenomenon can also explain the higher fraction of aO-AGB stars in the LMC if these stars are simply dusty O-rich AGB stars. It should be noted that, though there is a higher fraction of carbon-rich stars in the SMC, it has been shown that LMC carbon stars are dustier than their cousins in the SMC (cf. van Loon, 2000; van Loon et al., 2006b, 2008b). This might be explained if dust is difficult to form without other metals to act as nucleation cores.
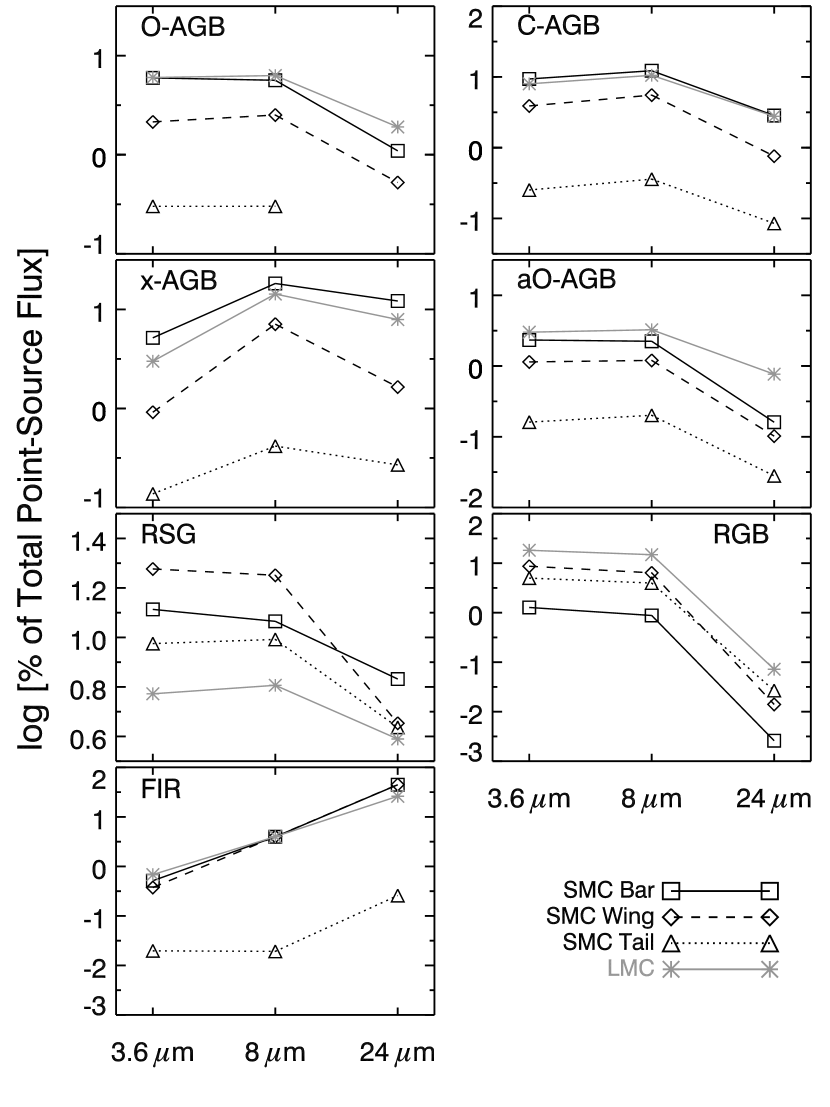
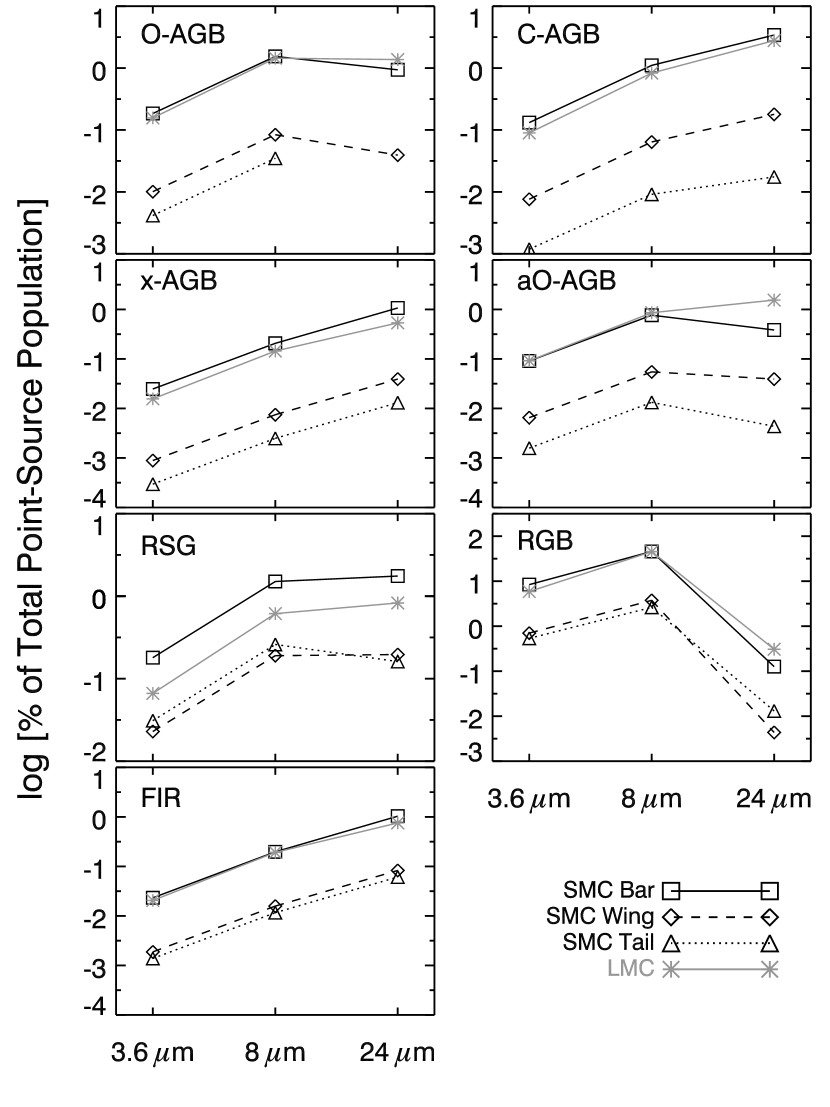
Figure 16 shows the contribution of each stellar type to the total point-source flux in the SMC and LMC and Figure 17 shows their contributions to the total number of point-sources. Below, we point out some interesting features:
-
•
In the bar, AGB stars together contribute 23%, 38%, and 16% of the point-source flux at 3.6, 8, and 24 µm, respectively, despite being only a small fraction of the population.
-
•
At 8 and 24 µm, the x-AGB stars are the most impressive evolved stars. They contribute 12% –18% of the point-source flux in the bar while numbering 1% of the total stellar population. In the wing, the x-AGB stars appear less important, though this may be the result of small-number statistics since only 9 x-AGB stars are detected in the wing.
-
•
In the LMC and the SMC bar, the AGB stars together out-shine the RSG stars at 3.6, 8, and 24 µm. The reverse is true in the wing, where recent star formation may be enhancing the RSG population, increasing their contribution at 3.6 and 8 µm. The LMC RSG stars are less significant, contributing 3 – 5 less to the total point-source flux than the AGB stars at all wavelengths.
We note that about 16% of the RSG stars in the SMC have 24-µm counterparts (Table 2, see also Bonanos et al., 2010); this fraction rises to 34% for the LMC. A similar trend is seen in the O-AGB stars. Some of this discrepancy may be due to the increased distance to the SMC and limited sensitivity of 24-µm data, but it may also suggest that O-rich stars form dust more easily in the LMC (van Loon et al., 2006b, 2008b; Bonanos et al., 2010).
-
•
Although RGB stars are by far the most numerous stars SAGE-SMC data, they contribute 14% to the 3.6- and 8-µm point-source fluxes. This scenario is quite different to that in old stellar populations such as globular clusters, where RGB stars can contribute close to 100% of the mid-IR point-source flux. The contribution from RGB stars is higher in the wing and tail than in the bar, perhaps indicating an aging stellar population in the outskirts of the SMC.
-
•
The FIR objects are extremely important contributors to the mid-IR flux, providing up to 45% of the flux at 24 µm. If these sources had not been culled from the evolved stars list, the result would be a huge overestimate of the mid-IR flux contribution from evolved stars.
Maraston et al. (2006) and Henriques et al. (2010) find that thermally-pulsing AGB stars are important contributors to the SED of galaxies at redshift , particularly at rest-frame near-IR wavelengths. The above points and Figure 16 reinforce these results. However, if we are to fully understand the importance of cool, evolved stars in distant galaxies, we must also consider the global flux (point-source extended). The global flux of the SMC at IRAC and MIPS wavelengths within 2.5° of the SMC center (an area covering most of the bar and wing) is measured by Gordon et al. (2011). At 3.6 µm, we find that the RGB and AGB stars in this same area each contribute 21% to the SMC global flux, with RSG stars trailing close behind at 19.5%. The AGB stars do, therefore, appear to play an important role in the near-IR SED. However, the contribution from less evolved RGB and more massive RSG stars is equally important. This agrees with recent work by Melbourne et al. (2011, in prep), showing the importance of RSG stars to the near-IR flux of nearby galaxies. However, we note that RGB and RSG stars are strongly contaminated by foreground sources (Section 2.2).
The picture changes considerably at longer wavelengths, with the AGB stars contributing more to the global flux (17%) than RGB and RSG stars (each 7%) at 8 µm. The ISM emission dominates at longer wavelengths: 3% of the global 24-µm flux is produced by the cool evolved stars, of which is due to AGB stars.
4. Evolved Star Characteristics
4.1. Infrared colors
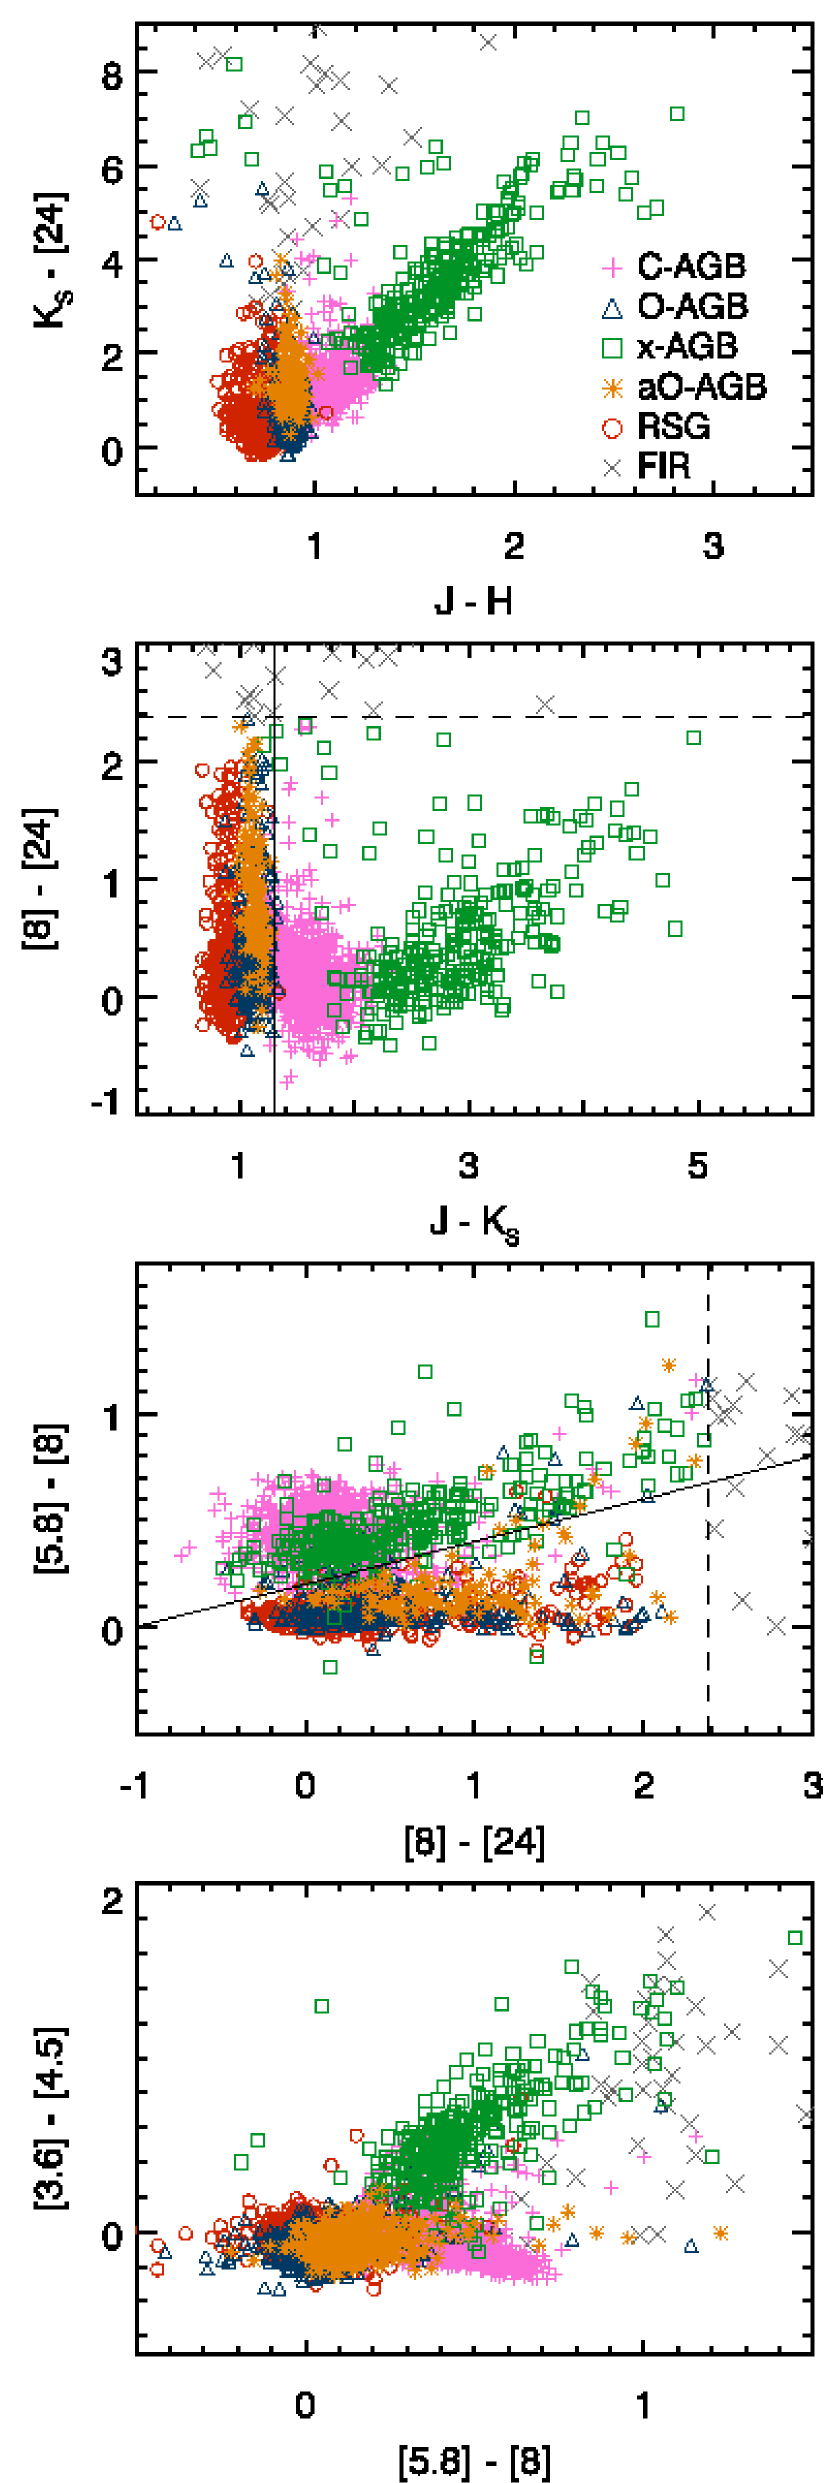
IR colors are good diagnostics of stellar and dust properties when investigating a large stellar population and/or when lacking IR spectra. In Figure 18, we used the AGB and RSG stars selected in Section 3.1 to reproduce the CCDs presented in Sloan et al. (2006), Kastner et al. (2008), Lagadec et al. (2007), and Groenewegen et al. (2009) to distinguish different types of AGB stars.
4.1.1 vs.
The top panel of Figure 18 is essentially a comparison of the photosphere or spectral type () to the dust excess (), except for the most heavily dust-enshrouded stars, where becomes a measure of the optical depth of the dust envelope instead. The distribution of AGB stars among color (Fig. 19) shows that the C-AGB and aO-AGB stars are dustier than the O-AGB stars. However, we note that since the aO-AGB stars are selected based on their red colors (compared to O-AGB stars), it is not unexpected to also see red colors. The x-AGB stars show the strongest dust excess and an extremely extinguished photosphere. We see that there is a large range of 24-µm excess for all evolved stars, even over a small range.
The 24 µm flux is generally dominated by continuum dust emission, though some O-AGB stars can achieve strong 24-µm excesses since the 24-µm filter clips the red edge of the broad 20-µm silicate feature. While the bulk of O-AGB stars have mag, a small population of O-rich sources show colors as red as the x-AGB stars. It is possible that this group of sources is contaminated by YSOs or that the 24-µm emission is instead due to illumination of local ISM dust.
4.1.2 vs.
In the second panel of Figure 18, we show a CCD similar to that presented by Sloan et al. (2006), which showed a separation of stars with spectroscopically-confirmed O-rich and C-rich dust. The silicate sequence is vertical, with (solid line), and the carbon-dust sequence is more horizontal, starting near mag. Based on this classification, the majority of the x-AGB stars appear to be dominated by C-rich chemistry, and the aO-AGB stars do indeed appear to be dominated by O-rich chemistry. The dashed line shows the limit where .
4.1.3 vs.
The third panel of Figure 18 is used by Groenewegen et al. (2009) and Kastner et al. (2008) to show the color differences between O-AGB, C-AGB, and RSG stars. When one takes into account the difference in nomenclature (in both of those works, the C-rich AGB and O-rich AGB stars are what we call x-AGB stars and bright O-rich AGB stars here, respectively), we see that our CCDs are quite similar to these previous studies.
When restricted to Spitzer colors, the vs. CCD is a good choice for distinguishing C-rich and O-rich AGB stars since 95% of the stars classified as O-rich in Section 3.1 fall below the solid line in the third panel of Figure 18 and 90% of the C-rich stars lie above it. However, the RSG stars remain indistinguishable from the O-rich AGB stars and x-AGB stars show significant overlap with C-AGB stars. This color scheme also restricts the selection to those detected at 24 µm, which is a minority of the O-rich population in the SMC. Nonetheless, Lagadec et al. (2007) show the separation of spectroscopically confirmed C-rich and O-rich dust-enshrouded sources in this CCD. Our classification scheme is consistent with what they find.
4.1.4 vs.
In the bottom panel Figure 18, we can see the effect that CO and/or C3 absorption has on the color. It is clear that the C-AGB stars show stronger absorption as the 8-µm excess increases and the x-AGB stars show almost no indication of this absorption due to dust emission veiling the molecular absorption bands (van Loon et al., 2006b, 2008b). The IRAC colors are sufficient for distinguishing the x-AGB stars, but C-AGB and O-rich AGB stars are difficult to isolate without the addition of near-IR photometry.
4.1.5 Comparing SMC and LMC Colors
Figure 20 shows the vs. CCD from the second panel of Figure 18, this time comparing the SMC to the LMC. The LMC tends to have a larger population than the SMC at very red colors, but the range in these colors is essentially the same in both galaxies.
The near-IR color tends to be slightly redder for the LMC stars than the SMC stars, likely due to the difference in metallicity between the galaxies. The x-AGB stars are the exception to this rule, possibly because their near-IR stellar flux is extremely extinguished by circumstellar dust.
The RSG, O-AGB and aO-AGB stars show little, if any, contamination from C-rich sources, but the scatter in the C-AGB and x-AGB populations may indicate a population of dusty O-rich sources. This is especially evident in the LMC. Very obscured O-rich sources (though rare) can reach colors redder than (e.g., IRAS 052986957 or IRAS 052806910; Wood et al., 1992; van Loon et al., 2001a, b, 2010a; Kemper et al., 2010; Boyer et al., 2010a). These O-rich interlopers can skew the measurement of the global mass-loss rate (see Section 5.3) for the C-rich stars. However, the C-rich stars contribute significantly more to the cumulative mass-loss rate than their O-rich counterparts in the LMC (Srinivasan et al., 2009, also see Section 5.3), so this effect may not be significant.
The CCDs in Figure 18 indicate that the IR colors, particularly the combination of and , can be used in the absence of IR spectra to identify AGB and RSG stars with reasonable confidence. The minimal differences between the LMC and SMC CCDs also suggest that the CCD in Figure 20 applies to stellar populations over a fairly broad range in metallicity. However, one must use caution especially when attempting to distinguish x-AGB stars and YSOs.
4.2. Luminosity Functions
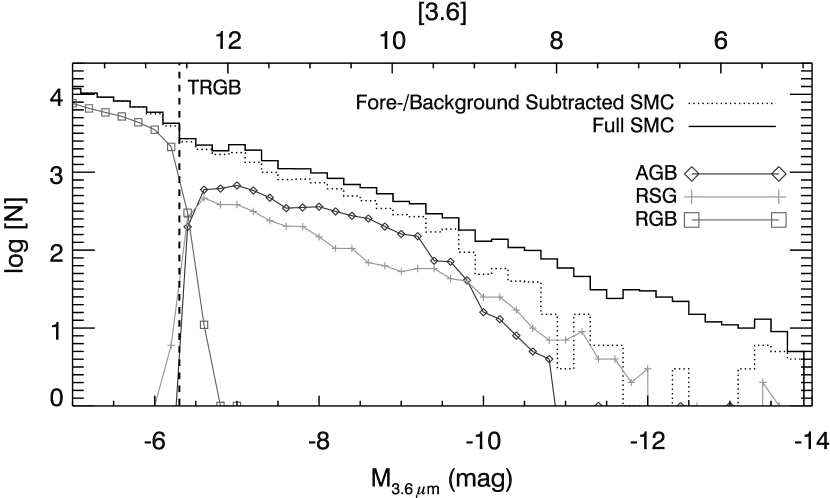
Luminosity functions are useful in constraining the evolutionary models of evolved stars, providing constraints to the star-formation history and to several processes and parameters, including nucleosynthesis, mixing, mass loss, evolutionary rate, stellar lifetime, and initial stellar mass (Marigo et al., 1999; Javadi et al., 2011). Figure 21 shows the 3.6-µm luminosity functions of the SMC and its cool evolved stars. The RSG stars dominate the luminosity function at the brightest magnitudes. This points to the importance of RSG stars to the total integrated near- to mid-IR luminosities of galaxies, despite their low numbers (Section 3.3).
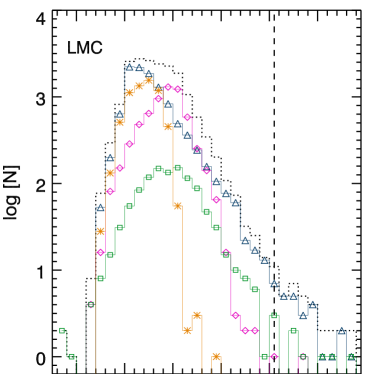
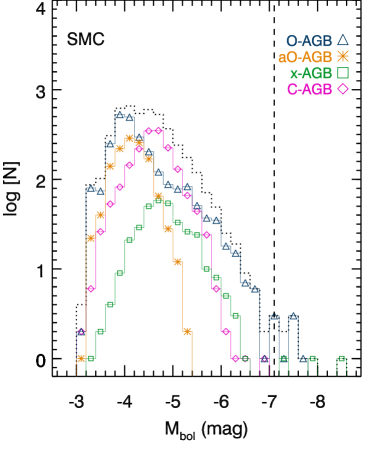
The 3.6 µm luminosity function of RSG stars drops smoothly with magnitude and spans the broadest magnitude range. AGB stars do not drop smoothly with magnitude, showing an enhancement near mag from C-AGB stars. We show the individual luminosity functions for AGB stars in Figure 22. To estimate the luminosities of the AGB stars, we performed a simple trapezoidal integration from the optical -band through mid-IR 24-µm flux. We find 6 O-AGB and 3 x-AGB stars that are brighter than the classical AGB limit ( mag) in the SMC; it is possible for AGB stars to exceed the classical limit if they are at the peak of their pulsation cycle or are experiencing HBB (Smith & Lambert, 1985; Boothroyd & Sackmann, 1992; van Loon et al., 2001a, 2005a, 2005b). Srinivasan et al. (2009) found hundreds of AGB stars brighter than the classical limit in the LMC, but this is due to an overestimate of the luminosities in that work (S. Srinivasan, private communication). We present the revised LMC bolometric magnitudes here and find 34 LMC AGB stars brighter than the classical limit.
4.2.1 The Carbon Star Luminosity Function
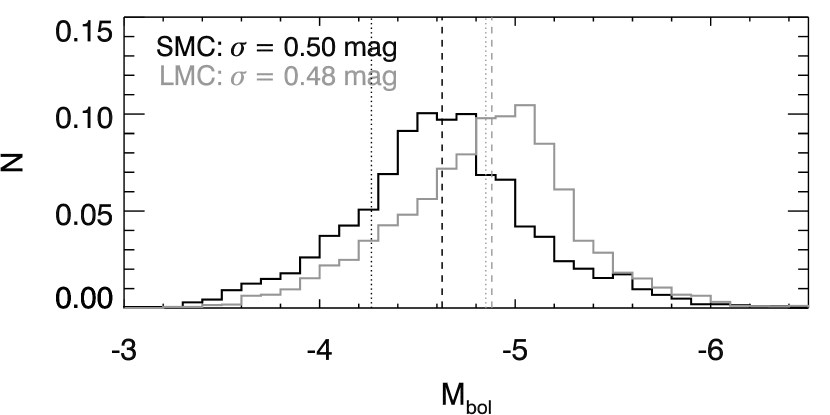
Marigo et al. (1999) use the carbon star luminosity functions (CSLFs) of the Magellanic Clouds to constrain the third dredge-up process. The CSLF was derived by Groenewegen (1998), using 1 700 C-rich AGB stars identified spectroscopically by the Swan C2 bands at 5165 Å and 4737 Å and bolometric corrections from Westerlund et al. (1986). These data cover most of the bar and wing of the SMC, but exclude the heavily enshrouded C-rich x-AGB stars. They find that the CSLF peaks at mag (adjusting for a slight difference in adopted distance modulus) and is broad and roughly symmetric. Here, the median of the combined C-AGB and x-AGB luminosity function (Fig. 23) is mag, with a dispersion of 0.50 mag. The peak is significantly brighter than the peak observed by Marigo et al. (1999). If we exclude the x-AGB stars, the result is a slightly fainter and narrower CSLF ( mag, mag). van Loon et al. (1999a, b, 2006b) also show that the heavily enshrouded C-rich stars (the x-AGB stars here) tend to be more bolometrically luminous than the optically-detected carbon stars.
For the LMC, our CSLF peaks near the Marigo et al. (1999) CSLF peak, but is significantly narrower. We find mag and a width mag, whereas Marigo et al. (1999) find mag and mag.
Marigo et al. (1999) suggest that a higher efficiency of the third dredge-up is required in the SMC to explain the fainter peak of the SMC CSLF compared to the LMC. Here, we find that the SMC CSLF is 0.37 mag brighter than in that work, though it is still 0.26 mag fainter than the LMC CSLF. Therefore, the difference in the efficiency of the third dredge-up between the Magellanic Clouds may not be as substantial as they predict.
4.2.2 The 8 µm Luminosity Function
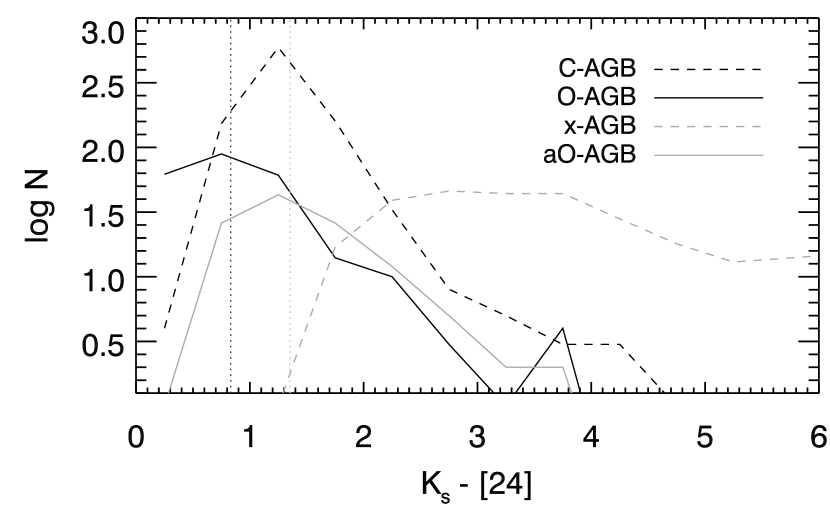
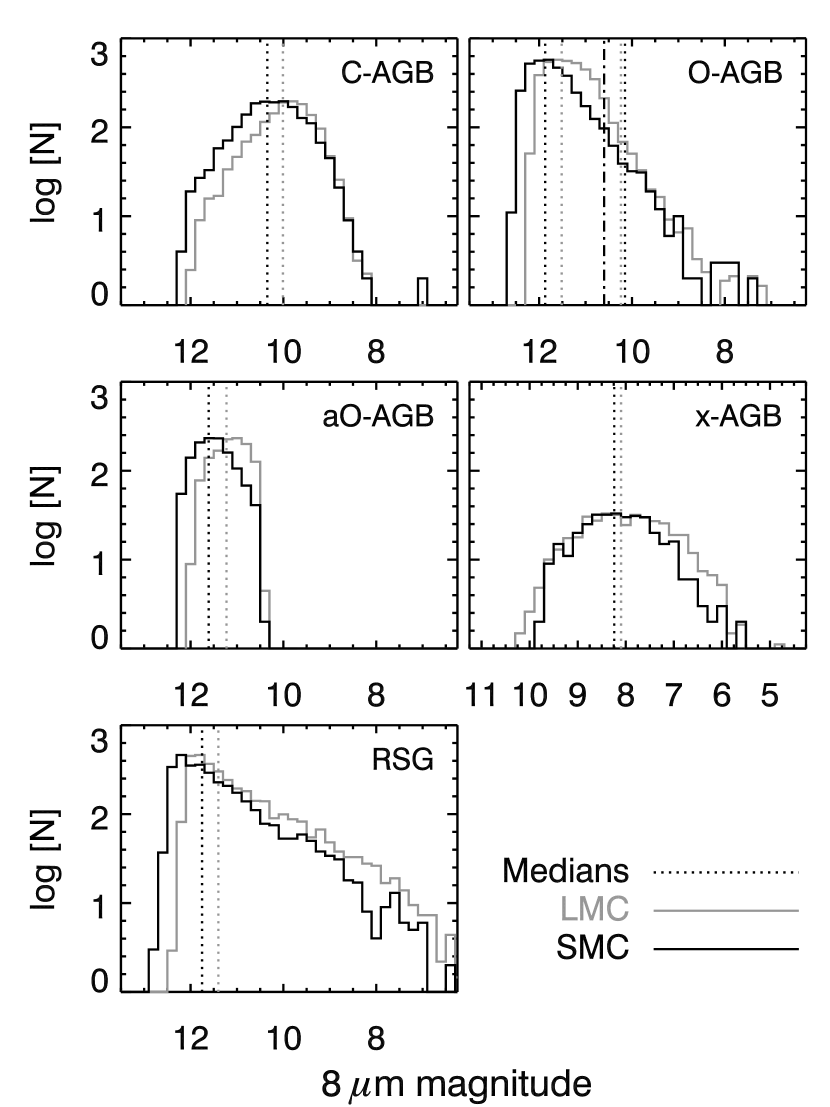
The 8-µm magnitude includes information on the dust emission rather than on the temperatures of the photospheres. Histograms showing the distribution of each stellar type over color and over 8-µm magnitude are shown in Figures 24 and 25. The LMC histograms have been shifted down to match the SMC peak in each panel and shifted 0.4 mag fainter at 8 µm to account for the difference in distance between the LMC and SMC (Table 1). The shapes of the resulting LMC histograms are quite similar to the SMC histograms. The relative difference between the median 8-µm magnitudes (dotted lines) ranges from 0.32 mag for the bright O-AGB stars to 0.55 mag for the x-AGB stars and 0.73 – 0.78 mag for the other stellar types.
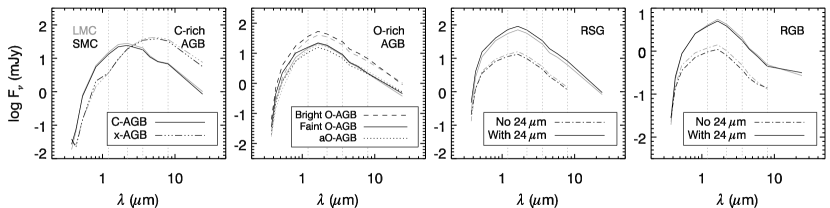
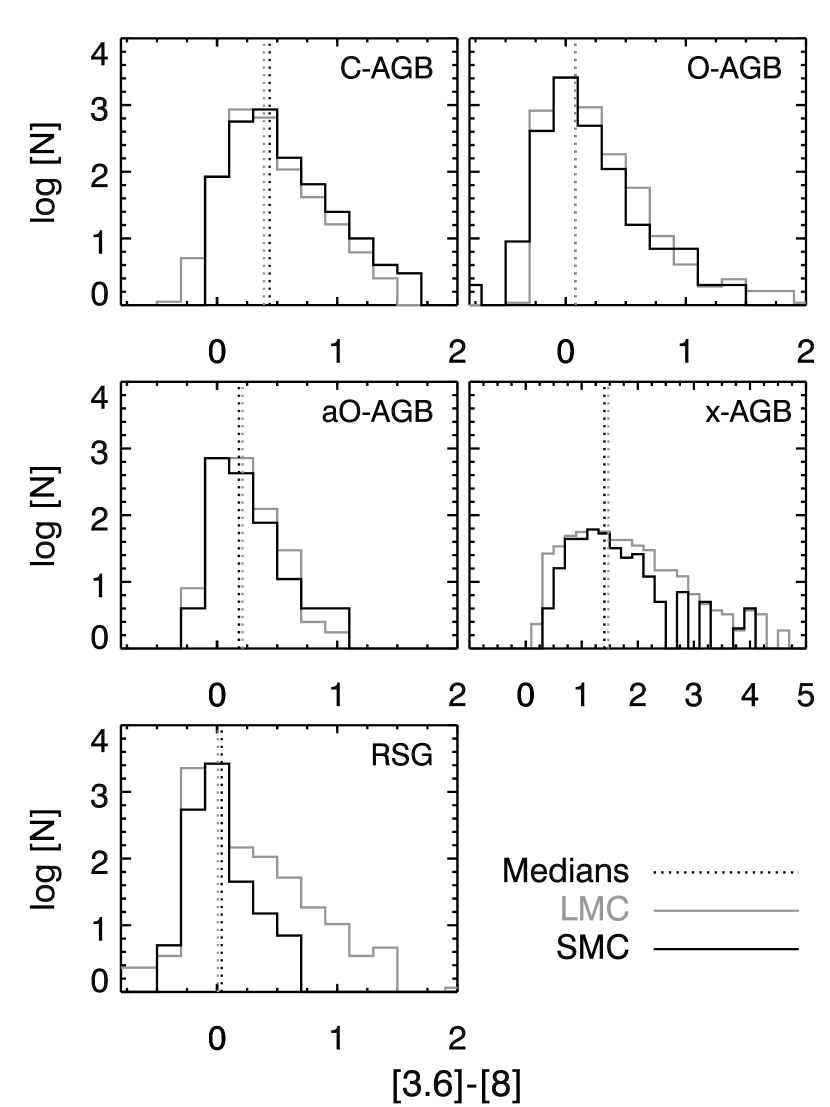
Figure 25 shows the distribution of the evolved stars in color, which represents circumstellar dust excess. We show the IRAC color to ensure that all x-AGB stars are included, since many x-AGB stars are undetected at near-IR magnitudes. The median colors of the RSG and x-AGB stars are similar in both galaxies ( 0.03 and 0.08 mag, respectively), but it is clear from Figure 25 that a significant number of LMC RSG and x-AGB stars show strong 8-µm excess (also see Bonanos et al., 2010). This suggests that the LMC stars may be more efficient dust producers, whether the dust is O-rich or C-rich (cf. van Loon, 2000; van Loon et al., 2006b, 2008b). It is interesting that the other evolved stars do not show a strong difference in between the LMC and SMC; it seems as though metallicity does not strongly affect the dust production except in the more extreme evolutionary phases.
4.3. Spectral Energy Distributions
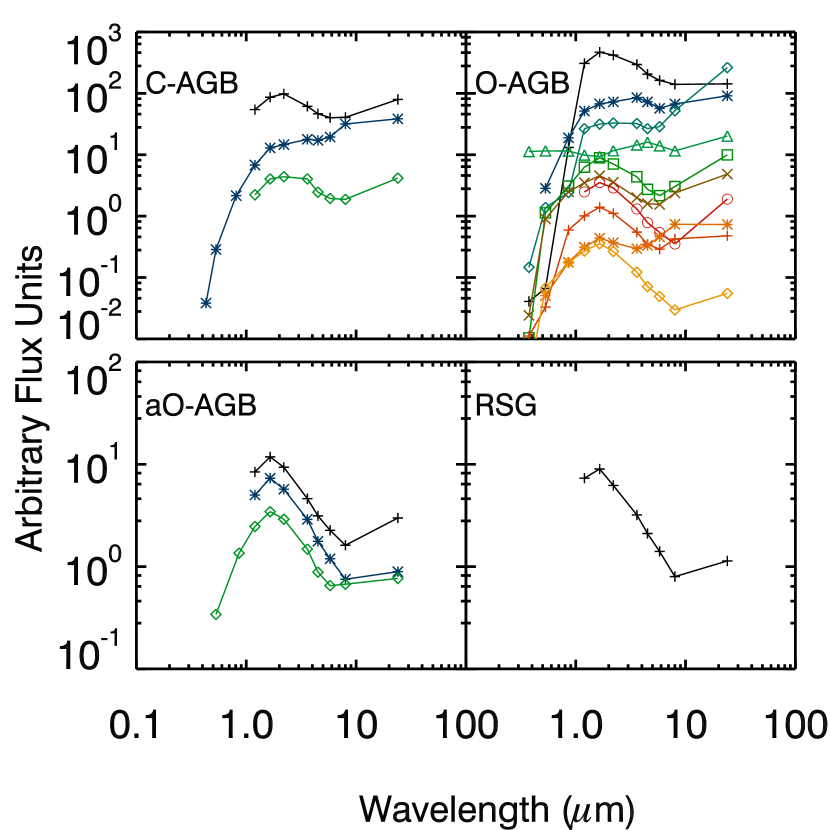
The SAGE-SMC (and SAGE-LMC) catalogs are ideal for investigating the full evolved star SEDs since they include 12 bands of photometry and a well-sampled SED near the peak luminosity. The SEDs shown reach only to 24 µm, but very few stars are expected to show much emission at longer wavelengths (Boyer et al., 2010a, also see Section 4.4). Figure 26 shows the median SEDs for each type of evolved star, with LMC SEDs scaled down to account for the difference in distance between the galaxies. We note that these SEDs only include stars in the SMC bar, as the optical MCPS coverage does not extend to the tail (Fig. 1). The median SEDs are resistant to outliers, so we show SEDs binned by magnitude and color in Section 4.3.1.
The x-AGB stars are heavily extinguished, showing a peak luminosity between 4.5 and 8 µm. O-AGB, C-AGB, and aO-AGB stars peak in the near-IR, with C-AGB stars showing the coolest temperatures of the three. RSG and RGB stars peak near the -band. A second SED is shown for RSG and RGB stars undetected at 24 µm. Less than 1% of the SMC RGB stars have 24-µm counterparts (Table 2), and based on the strong 24-µm excess in these sources, it is likely that they are either mis-identified or contain a separate mid-IR source along the line-of-sight.
There are few differences between the LMC median SEDs and the SMC SEDs. Discrepancies in the peak flux may be due to uncertainty in the relative distances of the galaxies or to an intrinsic difference between the luminosity functions of the galaxies (e.g., Fig. 24). For AGB stars, the 24-µm point is slightly brighter in the LMC than in the SMC. This appears to be due more to the higher fraction of 24-µm counterparts in the LMC, and less to differences in individual stars. In the previous section, we demonstrated that the median 8-µm magnitudes of all evolved stars except the bright O-AGB stars are brighter in the LMC than the SMC. Figure 26 shows the opposite for the RSG stars, which is due to separating those that are detected at 24 µm from those that are not; the large population of faint RSG stars detected at 24 µm bring down the LMC 8-µm median.
4.3.1 AGB star SEDs
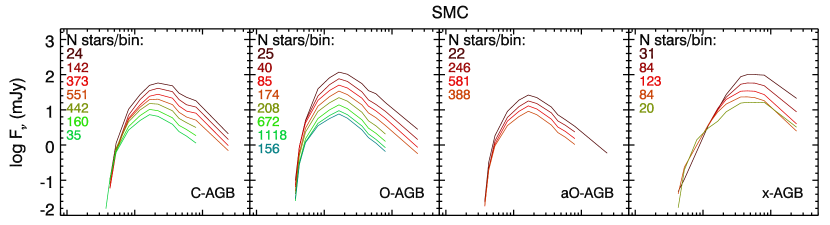
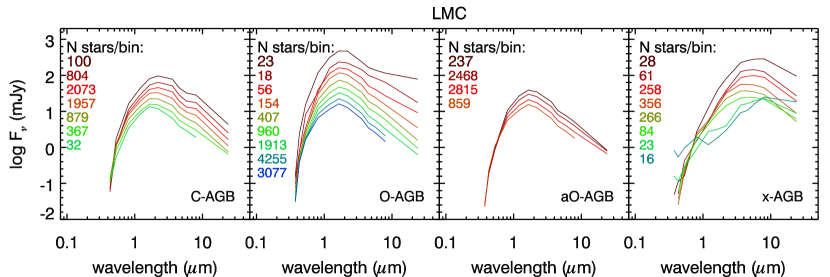
Figure 27 shows the median AGB SEDs, binned in steps of 0.5 mag at 3.6 µm. In the SMC, the faintest and brightest SEDs of a particular stellar type look quite similar, with no obvious differences in the SED features (except for non-detections at 24 µm). The LMC, on the other hand, shows many differences between the brightest and faintest sources. LMC O-AGB stars show a striking increase in 24-µm excess among the brightest 100 O-AGB stars. Inspection of the individual SEDs shows that this excess is real, though it is possible that some of these sources are RSG or YSO interlopers. In the SMC, we find only one O-AGB star with 24-µm excess similar to these bright LMC O-AGB stars.
The opposite effect is observed in the LMC aO-AGB stars, with the brightest stars showing a slightly weaker 24-µm excess. In this case, it appears the difference in 24-µm excess is due to the comparatively small number of stars included in the brightest bin of aO-AGB stars. The population of aO-AGB stars show a wide range of 24-µm excess, mostly independent of the total luminosity (Fig. 9).
In both galaxies, the C-rich stars show an absorption feature from 4 to 8 µm that is likely due to CO C3. This feature becomes stronger as C-AGB stars become redder (and brighter), then is veiled by continuum dust emission in the heavily extinguished x-AGB stars. This disappearance of the molecular feature in the fainter/bluer C-AGB stars may indicate some contamination from stars dominated by O-rich chemistry among the faint/blue edge of the C-AGB branch on the CMD (Figs. 4 and 20). The disappearance of the feature could also be explained if the faint C-AGB stars have warm photospheres or if C/O is close to unity.
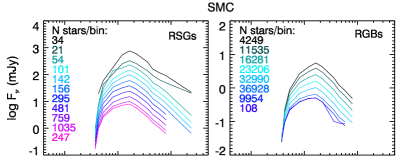
4.3.2 RSG and RGB star SEDs
The median SEDs of RSG and RGB stars, binned in steps of 0.5 mag at 3.6 µm, are shown in Figure 28. RGB stars show no distinctive differences between the LMC and SMC or between the brightest and faintest stars. However, RSG stars show strong variations as a function of brightness. The brightest 100 RSGs in the LMC do indeed show enhanced 8- and 24-µm excess, and the 200 or so RSGs fainter than those also show a broad range of mid-IR excess. The same is true for the brightest 50 RSG stars in the SMC. These SEDs indicate that significant amounts of warm RSG dust form only around the brightest 7% of LMC RSG stars and 2% of SMC RSG stars. Bonanos et al. (2010) find similar trends. Since this dust emits strongly at 24 µm, its temperature may be slightly cooler than typical AGB dust due to a larger dust-free inner envelope (cf. van Loon et al., 2005a). Alternatively, these bright RSG stars may be those with the strongest silicate emission, which would enhance the flux in both the 8- and 24-µm filters.

4.4. 70-µm Point-Sources
| SAGE IRAC Designation | Classification | Alternative Name |
|---|---|---|
| x-AGB Candidates | ||
| SSTISAGEMA J003659.53741950.3 | post-AGB [1,2,3] | IRAS 003507436 |
| SSTISAGEMA J004808.49731454.7 | H II region [4] | N26, IRAS 004627331 |
| SSTISAGEMA J005640.88725425.2 | ||
| SSTISAGEMA J010503.97715925.4 | emission line star [5] | LIN 439 |
| SSTISAGEMA J010507.26715942.8 | YSO candidate [6] | S3MC 01051-7159, IRAS 010357215(?) |
| SSTISAGEMA J012407.95730904.0 | H II region [7,8] | N88A, IRAS 012287324 |
| RSG Star Candidates | ||
| SSTISAGEMA J004352.42730721.7 | ||
| SSTISAGEMA J004717.74730917.5 | ||
| SSTISAGEMA J004807.03724612.2 | ||
| SSTISAGEMA J004955.73730250.8 | KM supergiant [9,10] | SkKM 50, LI-SMC 59 |
| SSTISAGEMA J004957.59724815.8 | ||
| SSTISAGEMA J005047.65731316.1 | ||
| SSTISAGEMA J005553.51731826.8 | Foreground [11] | IRAS F005427334 |
| SSTISAGEMA J005659.94722403.8 | ||
| SSTISAGEMA J005749.34723555.6 | ||
| SSTISAGEMA J010155.47720029.3 | ||
| SSTISAGEMA J010220.80722105.1 | ||
| SSTISAGEMA J010905.42723832.4 | Foreground [11] | IRAS 010757254, HD 7100 |
| SSTISAGEMA J011235.16730935.4 | KM supergiant [9] | SkKM 327 |
Note. — RSG and x-AGB candidates with apparent matches to 70-µm point-sources. REFERENCES: [1] Whitelock et al. (1989); [2] van Loon et al. (2008b); [3] Groenewegen & Blommaert (1998); [4] Indebetouw et al. (2004); [5] Lindsay (1961); [6] van Loon et al. (2010b); [7] Testor & Pakull (1985); [8] Heydari-Malayeri et al. (1999); [9] Sanduleak (1989); [10] Loup et al. (1997); [11] Massey et al. (2007).
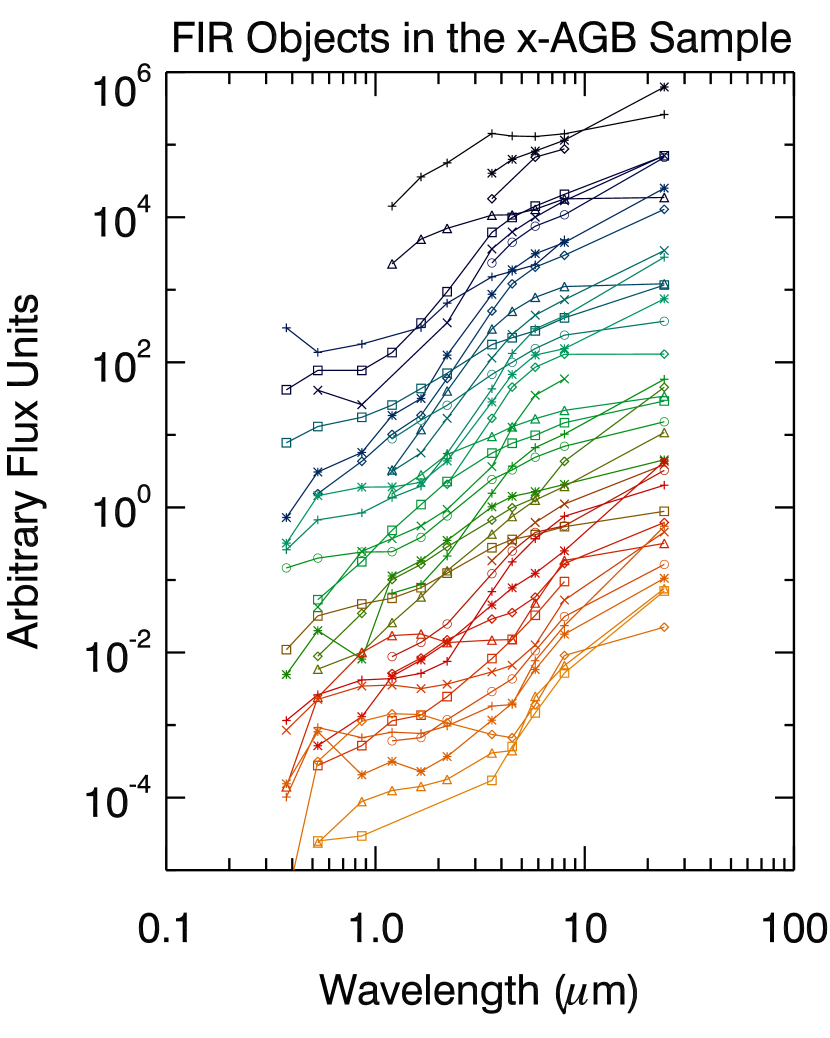
The SAGE-SMC and S3MC MIPS 70-µm observations are not sensitive enough to detect typical AGB and RSG stars in the SMC. However, a small sample of sources we identify as evolved stars based on the mid-IR colors (Section 3) are associated with 70-µm point-sources to within one full-width half-maximum (FWHM) of the 70-µm point-spread function (PSF; 18″). We show the full SEDs of these sources in Figures 29 and 30 (also see van Loon et al., 2010b).
Six of the 70-µm sources are in our x-AGB star sample (Table 6). Two sources have the coordinates of known compact H II regions (N88A and N26; e.g., Testor & Pakull, 1985; Heydari-Malayeri et al., 1999; Indebetouw et al., 2004). One is 4.6″ away from a known post-AGB star (IRAS 003507436; Whitelock et al., 1989; van Loon et al., 2008b), and one is only 0.1″ from a YSO candidate (S3MC 010517159; van Loon et al., 2010b). Another source (SSTISAGEMA J010503.97715925.4) is 1.7″ from an emission line star (LIN 439; Lindsay, 1961). We expect that the 70 µm emission does in fact originate from these non-AGB sources or from superimposed background objects rather than from true x-AGB stars. The remaining 70-µm source in the x-AGB sample (SSTISAGEMA J005640.88725425.2) is not identified in the literature, and we cannot confidently identify it based on its SED shape (Fig. 29) , especially since it is not matched to an optical or near-IR source. This source is centrally located in the bar, and its 24 and 70-µm photometry may be affected by surrounding diffuse emission.
LIN 439 and S3MC 010517159 are adjacent to one another (0.38′) and in a crowded region on the northeast edge of the bar, surrounded by strong diffuse mid-IR emission. IRAS 003507436 is located on the southern edge of the bar, is isolated, and in a region of low background.
Several more 70-µm point-sources are associated with FIR objects that are within the x-AGB locus of the IR CMDs (Section 3.1.6). We excluded these sources from the x-AGB sample because their 24-µm fluxes exceed their 8-µm fluxes, suggesting that they might be YSOs or background galaxies. Indeed, if S3MC 01051-7159, IRAS 00462–7331, IRAS 01228–7324, and LIN 439 were detected at 24 µm, the shape of their SEDs (Fig. 29) suggest that they should be classified as FIR objects here instead of x-AGB stars.


Thirteen RSG candidates are also associated with 70-µm sources. Two of these are likely foreground objects (IRAS F005427334 and IRAS 010757254; Loup et al., 1997; Massey et al., 2007), and two others are identified as K or M supergiants (SkKM 50, SkKM 327; Sanduleak, 1989; Loup et al., 1997).
The remaining 9 sources (Fig. 30) clearly show a photosphere peaking in the near-IR and what appears to be a secondary peak at µm. SkKM 50 and SkKM 327 also fall within this category. It is possible (and perhaps likely) that the long-wavelength flux is not from the stars themselves, but from a superimposed compact H II region, YSO or background galaxy. This possibility is supported by the fact that half of these stars are not matched to 24-µm sources. If the far-IR flux does indeed originate from the star, it may be in the form of a detached dusty shell.
No C-AGB, O-AGB, or aO-AGB stars are confidently associated with 70-µm point-sources, though several are just outside the FWHM of the 70-µm PSF. This includes 5 C-AGB, 2 O-AGB, 3 aO-AGB, and 6 RSG stars. Inspection of the images suggests that the mid-IR sources are distinct from the far-IR sources.
5. Evolved stars as probes
5.1. Stellar Spatial Structure
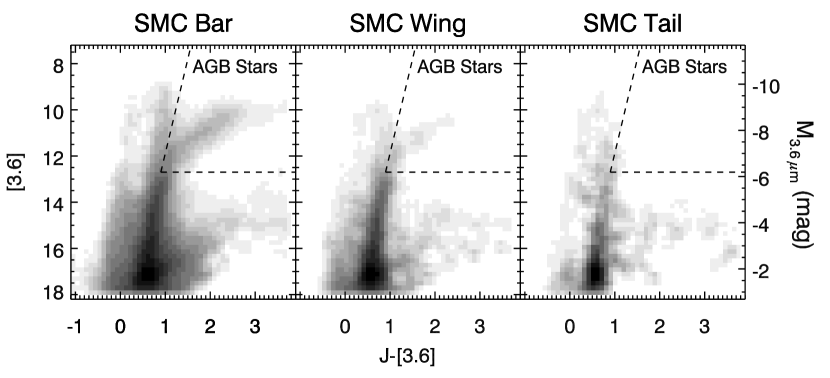
Since the SAGE-SMC survey has, for the first time, provided IR imaging covering the entire extent of the SMC (Fig. 1), we can now use the cool evolved stars to investigate the overall structure of the SMC. Figure 31 shows the IR CMDs of the SMC bar, wing, and tail regions (see Fig. 1), with foreground/background contamination subtracted (Section 2.2). It is clear that the bar is home to a relatively old population of stars, as its CMD is dominated by cool/red RGB and AGB stars, though a young population also exists. The wing region resembles the bar, albeit with a smaller population. The tail region is dominated by foreground and background sources (see Fig. 3), with only a faint hint at the presence of the RGB. Very few SMC stars reside in the tail, suggesting that the bar stellar population has not yet been significantly perturbed by interaction with the LMC and Milky Way.
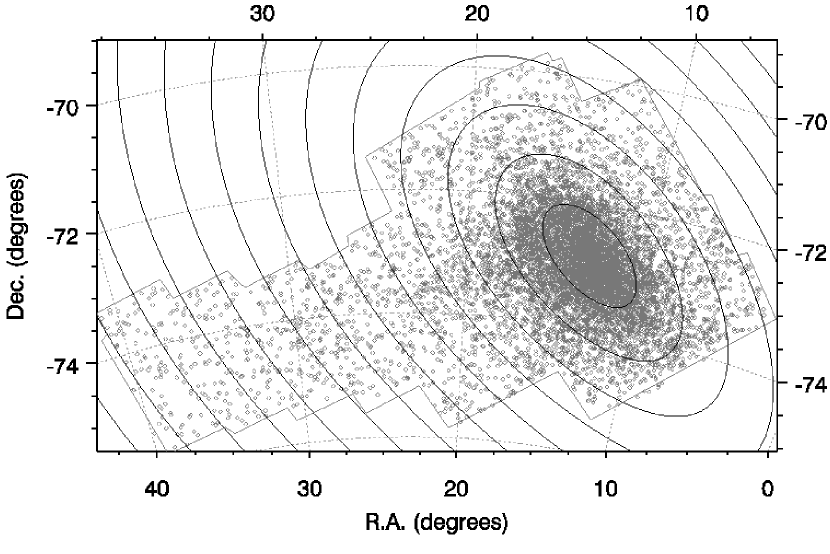
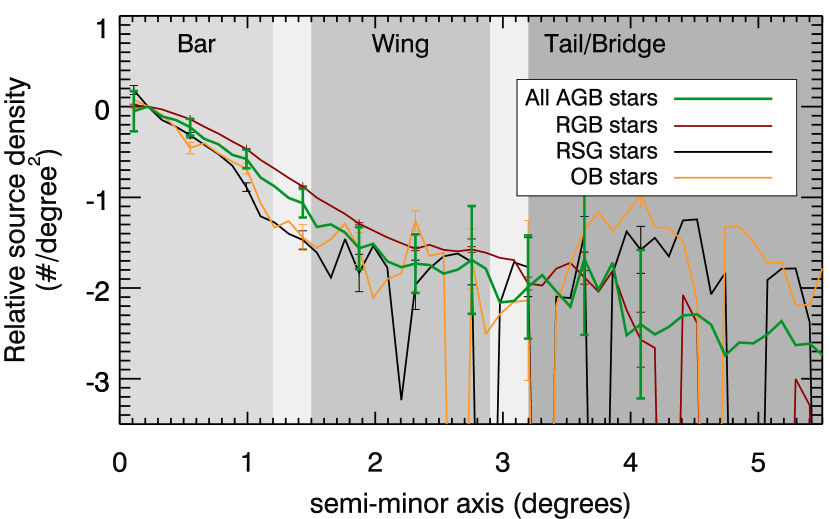
The population characteristics implied by the CMDs are corroborated by the radial distributions of different stellar types. We measured radial profiles of AGB, RSG, OB, and RGB stars by computing the source density within concentric elliptical annuli centered where the bulk stellar population peaks, with the semi-minor axes of the annuli in steps of 10′, increasing along the direction of the tail (Fig. 32). We remove the foreground and background contamination using the estimates from Section 2.2 and present the results in Figure 33.
All profiles show a smooth decline in source density into the wing region. Subtracting the foreground from the O-AGB, RGB, OB, and RSG sources causes distributions to vary significantly in the tail, due to low source counts in that region. However, it is also possible that the source density of young OB and RSG stars is enhanced in the tail due to continued star formation in this gaseous filament (Mizuno et al., 2006; Gordon et al., 2009). This is indicated by an increase in the OB and RSG star populations in the tail (4 from the center), but this increase is within 3 (error bars in Fig. 33 are 1 ). The AGB and RGB profiles do not have this enhancement in the tail, instead showing a smooth decline in source density from the bar, through the wing, and to the tail (cf. Harris, 2007).
The RGB profile decreases steadily out to at least 5° from the center of the bar. This suggests the presence of a very extended halo, as indicated by Nidever et al. (2011) and supporting CDM simulations of galaxy formation. However, since we sample the extended population along the wing and tail, the profile at large radius may not be representative of the entire population.
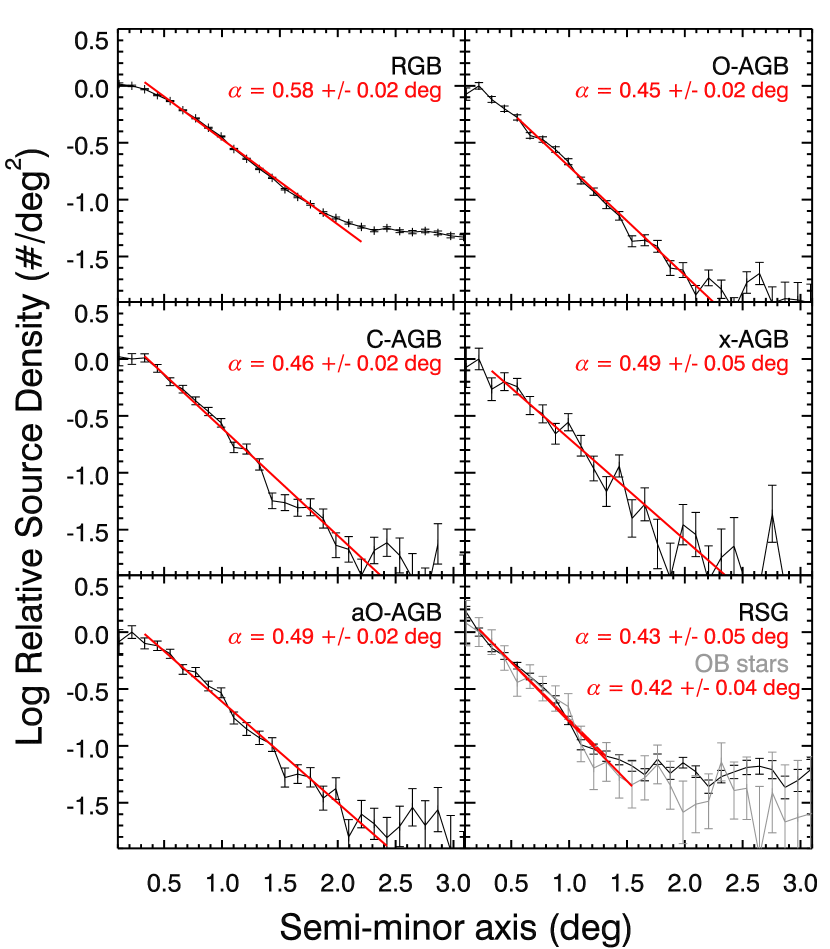
The spatial distribution of different stellar types provides an excellent probe of the radial age gradient within a galaxy. In Figure 34, we show that the young stellar populations (OB stars and RSGs) have a smaller scale length () than the intermediate-aged AGB stars and old RGB stars. We fit each profile to an exponential function of the form:
| (4) |
where is the semi-minor axis and find that the oldest stars are the most radially extended population. Similar scenarios have been observed in several other dwarf galaxies (e.g., Aparicio et al., 1997; Minniti & Zijlstra, 1997; Hidalgo et al., 2003, 2009; Vansevičius et al., 2004; Battinelli et al., 2006, 2007; Tikhonov, 2006).
Three scenarios might explain this stellar age gradient: (1) dynamical relaxation as a result of encounters between stars over time, (2) outside-in growth, or a shrinking of the star forming region, or (3) tidal interactions. In low-mass, isolated galaxies, Stinson et al. (2009) use smoothed particle hydrodynamics simulations to show that it is possible to produce extended old stellar halos without merging by including a combination of options (1) and (2) above. However, the SMC is clearly not an isolated galaxy; recent evidence shows that the LMC in fact contains a population of stars that originated in the SMC (Olsen et al., 2011). Moreover, the star formation histories of other nearby galaxies points to inside-out growth (e.g., Williams et al., 2009; Gogarten et al., 2010). It therefore seems likely that the stellar age gradient is due to dynamical relaxation of the SMC (also see Gieles et al., 2008).
5.2. The C/M Ratio
The ratio of C-rich to O-rich AGB stars, usually called the C/M ratio, is often used as a tracer of metallicity, where a high C/M ratio corresponds to a low metallicity, though the C/M ratio also depends on the star formation history. Using near-IR photometry of AGB stars in the SMC, Cioni et al. (2006b) showed the C/M ratio to be a good tracer of metallicity if the underlying stellar population is of intermediate-age.
In Figure 35, we show the C/M ratio for the SMC bar region, using our selection of AGB stars. C-type stars include the C-AGB and x-AGB stars. Cioni et al. (2006b) exclude very extinguished x-AGB stars ( mag) in their analysis, but we include them here since the IRAC data provides us with a complete x-AGB sample. M-type sources include O-AGB and aO-AGB sources. Cioni et al. (2006b) have 40% more stars in their sample due to their inclusion of sources fainter than the -band and 3.6-µm TRGBs (see Section 3.1). Their M-star sample thus includes significant contamination from RGB stars and our M-star sample excludes the early AGB stars.
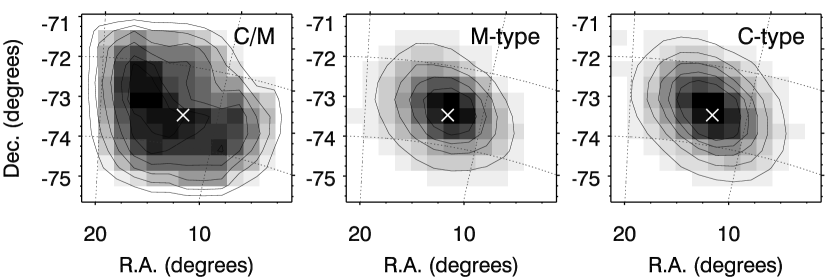
The procedure used here mimics Cioni et al. (2006b). We use a bin size of 0.4 deg, yielding a 0.16 deg2 area. The results are boxcar smoothed with width . The number count of AGB stars in the tail region of the SMC ( stars per bin; Figs. 12 – 13 is too small to include here without introducing substantial errors. In principle, such an analysis can be done with careful consideration of the uncertainties, but this is beyond the scope of this paper. We show only the bar/wing area, and only include bins with more than 5 C-type and 5 M-type stars.
The resulting C/M map (Fig. 35, left panel) is similar to the Cioni et al. (2006b) map, but not identical. We confirm a region with an enhanced C/M ratio near , , though our map shows this feature to be more elongated to that found by Cioni et al. (2006b). The strong peak near , seen by Cioni et al. (2006b) is much weaker here, but they show this peak to be at a low confidence level. Assuming that the C/M ratio corresponds directly to metallicity, our C/M map suggests that there is a minimum in the metallicity in the NE corner of the bar/wing, and that this minimum stretches to the SMC center. The metallicity appears to increase towards the south edge of the bar. This is consistent with the findings in Cioni et al. (2006b), despite our exclusion of sources below the TRGB.
5.3. Mass Loss

The total amount of dust input into the ISM from cool evolved stars must be measured if we are to obtain a complete picture of the lifecycle of dust within galaxies. The most reliable way to measure accurate dust mass-loss rates is by radiative transfer modeling of individual sources, though other methods using the IR excess (Srinivasan et al., 2009) and the IR color (cf. Groenewegen, 2006) provide a good first-order estimate of the mass-loss rate especially when considering large populations of stars.
A detailed analysis of the dust mass loss from AGB and RSG stars is beyond the scope of this paper. Here, we provide a simple analysis of the mass-loss rates using the IR colors and refer the reader to a forthcoming follow-up paper for a more thorough analysis (M.L. Boyer et al., in preparation).
We estimate dust mass-loss rates here by applying the Groenewegen (2006) radiative transfer grids to the measured color. For C-AGB and x-AGB stars, we assume K and a dust composition of 85% amorphous carbon and 15% SiC. We lump the aO-AGB stars with the O-AGB stars and assume K and a dust composition of 60% silicates and 40% AlOx. The Groenewegen (2006) models were computed with AGB stars in mind, but we also apply the O-rich models to the RSG stars. The rates are scaled according to van Loon (2006), where , is the stellar luminosity, and is the dust optical depth at 11.75 µm. The dust-to-gas ratio () scales as and (van Loon et al., 2005b). However, we note that the dust-to-gas ratio is uncertain, and may not be the same for O-rich and C-rich stars. It has been suggested that C-rich stars may have dust-to-gas ratios similar to Galactic values, even in low metallicity environments (Habing, 1996; Groenewegen et al., 2007). Using the Galactic dust-to-gas ratio would result in higher mass-loss rates for x-AGB and C-AGB stars. The expansion velocity is also uncertain; here, we assume , which may be an overestimate for the carbon stars (e.g., Lagadec et al., 2010), thereby overestimating their mass-loss rates.
Figure 36 shows the resulting cumulative dust mass-loss rates for the LMC and SMC. The LMC rates are slightly higher than those presented by Srinivasan et al. (2009) using IR excesses in that galaxy, but the overall trends are similar. In both galaxies, the x-AGB stars dominate the dust input by an order of magnitude despite their small numbers (Table 2). The O-AGB and C-AGB stars have similar total dust mass-loss rates, but the rates of individual C-AGB stars are higher than the O-AGB star rates on average. RSG stars do not contribute as strongly to the total dust input, but their contribution increases significantly above the classical AGB limit.
In the LMC, the O-AGB stars input more dust overall than C-AGB stars at mag. The picture is different in the SMC, where the C-AGB and O-AGB stars contribute similar amounts of dust until mag, where the C-AGB stars finally surpass the O-AGB stars. This suggests that fainter O-rich sources in the SMC may have difficulty producing enough dust to drive a wind.
6. Summary and Conclusions
The SAGE-SMC survey is the first to image the entire spatial extent of the SMC (including bar, wing, and tail) at mid-IR to far-IR wavelengths with high sensitivity and spatial resolution, thus providing the first opportunity to study the full SMC population of cool evolved stars at wavelengths where circumstellar dust emits. Using near-IR and mid-IR photometric criteria, we find 2 478 O-AGB, 1 729 C-AGB, and 349 extreme (x-AGB) star candidates, along with 1 244 stars belonging to a new class of O-rich AGB stars (aO-AGB). These stars represent the complete census of AGB stars in the SMC. We also classify 3 325 RSG stars and 135 437 RGB stars, which represent the brighter, least contaminated portions of the full populations. To compare the SMC evolved stars to those in the LMC, we apply the same classification criteria to the SAGE-LMC data. Our findings are summarized below:
-
•
We find that O-rich sources have a higher occurrence of strong 8 and 24-µm excess in the LMC, suggesting that O-rich dust is produced more efficiently or that silicate emission is more prominent in higher-metallicity environments. In fact, O-rich stars in general are less numerous in the SMC, with a higher fraction of stars showing evidence of a C-rich chemistry.
-
•
The colors indicate that SMC C-rich stars are as efficient at producing dust as their higher-metallicity LMC counterparts.
-
•
The RSG, AGB, and RGB stars contribute near equal amounts of flux to the global (extended + point-source) 3.6 µm flux within the bar and wing area. However, the RSG stars show a stronger contribution in the wing. At 24 µm, the x-AGB stars dominate the total point-source flux even though they are 3% of the population.
-
•
In general, the characteristics of the AGB stars in the SMC are similar to those in the LMC, showing only small differences in the median SEDs and in the distributions among 8-µm flux and color. However, the RSG stars in the LMC reach much redder colors than in the SMC, indicating more efficient RSG dust production at higher metallicity. This is not the case for the O-rich AGB stars.
-
•
Among the evolved stars, there is a population of far-IR sources in both the LMC and SMC, whose 24-µm flux exceeds the 8-µm flux. Most of these are likely to be YSOs and compact H II regions, and it is unclear what portion may be very dusty evolved stars.
-
•
Very few evolved star candidates are detected in the SAGE-SMC 70-µm images, and the SEDs of those detected indicate that they are likely to be YSOs or other 70 µm sources along the line-of-sight.
-
•
The bulk of the evolved star population is restricted to the bar and wing regions, though the old RGB distribution extends to the tail. The distribution of young RSG and OB stars may also indicate continued star formation in the gas-rich tail.
-
•
In the bar, the ratio of C-type to M-type AGB stars indicates only small fluctuations in metallicity, with a peak in C/M to the northeast of the center of the RGB population.
-
•
A preliminary estimate of the dust mass-loss rates in AGB and RSG stars suggests that the very dusty x-AGB stars dominate the dust return in both galaxies, despite their very small numbers. The dust input in both galaxies is therefore currently dominated by a C-rich chemistry. O-AGB and RSG stars appear to play a larger role in the LMC than in the SMC, particularly for the fainter O-AGB stars and the brighter RSG stars.
References
- Aparicio et al. (1997) Aparicio, A., et al. 1997, AJ, 114, 1447
- Battinelli et al. (2007) Battinelli, P., Demers, S., & Artigau, É. 2007, A&A, 466, 875
- Battinelli et al. (2006) Battinelli, P., Demers, S., & Kunkel, W. E. 2006, A&A, 451, 99
- Becker (1981) Becker, S. A. 1981, ApJS, 45, 475
- Blum et al. (2006) Blum, R. D., et al. 2006, AJ, 132, 2034
- Bolatto et al. (2007) Bolatto, A. D., et al. 2007, ApJ, 655, 212
- Bonanos et al. (2010) Bonanos, A. Z., et al. 2010, AJ, 140, 416
- Bonanos et al. (2009) —. 2009, AJ, 138, 1003
- Boothroyd & Sackmann (1992) Boothroyd, A. I. & Sackmann, I. 1992, ApJ, 393, L21
- Bowen (1988) Bowen, G. H. 1988, ApJ, 329, 299
- Boyer et al. (2008) Boyer, M. L., et al. 2008, AJ, 135, 1395
- Boyer et al. (2009a) —. 2009a, ApJ, 705, 746
- Boyer et al. (2010a) —. 2010a, A&A, 518, L142
- Boyer et al. (2009b) —. 2009b, ApJ, 697, 1993
- Boyer et al. (2010b) —. 2010b, ApJ, 711, L99
- Boyer et al. (2006) —. 2006, AJ, 132, 1415
- Cioni et al. (2006a) Cioni, M., et al. 2006a, A&A, 448, 77
- Cioni et al. (2006b) —. 2006b, A&A, 452, 195
- Cioni et al. (2000) —. 2000, A&A, 359, 601
- Elias et al. (1985) Elias, J. H., Frogel, J. A., & Humphreys, R. M. 1985, ApJS, 57, 91
- Elitzur & Ivezić (2001) Elitzur, M. & Ivezić, Ž. 2001, MNRAS, 327, 403
- Fazio et al. (2004) Fazio, G. G., et al. 2004, ApJS, 154, 10
- Gehrz (1989) Gehrz, R. 1989, in IAU Symposium, Vol. 135, Interstellar Dust, ed. L. J. Allamandola & A. G. G. M. Tielens, 445
- Gehrz et al. (2007) Gehrz, R. D., et al. 2007, Review of Scientific Instruments, 78, 011302
- Gieles et al. (2008) Gieles, M., Bastian, N., & Ercolano, B. 2008, MNRAS, 391, L93
- Glass (1999) Glass, I. S. 1999, Handbook of Infrared Astronomy, ed. Glass, I. S.
- Gogarten et al. (2010) Gogarten, S. M., et al. 2010, ApJ, 712, 858
- Gordon et al. (2009) Gordon, K. D., et al. 2009, ApJ, 690, L76
- Gordon et al. (2011) —. 2011, AJ, Submitted
- Groenewegen (1998) Groenewegen, M. A. T. 1998, Ap&SS, 255, 379
- Groenewegen (2006) —. 2006, A&A, 448, 181
- Groenewegen & Blommaert (1998) Groenewegen, M. A. T. & Blommaert, J. A. D. L. 1998, A&A, 332, 25
- Groenewegen et al. (2009) Groenewegen, M. A. T., et al. 2009, A&A, 506, 1277
- Groenewegen et al. (2007) —. 2007, MNRAS, 376, 313
- Gruendl & Chu (2009) Gruendl, R. A. & Chu, Y.-H. 2009, ApJS, 184, 172
- Guandalini & Busso (2008) Guandalini, R. & Busso, M. 2008, A&A, 488, 675
- Habing (1996) Habing, H. J. 1996, A&A Rev., 7, 97
- Harris (2007) Harris, J. 2007, ApJ, 658, 345
- Harris & Zaritsky (2004) Harris, J. & Zaritsky, D. 2004, AJ, 127, 1531
- Hartmann & Avrett (1984) Hartmann, L. & Avrett, E. H. 1984, ApJ, 284, 238
- Hartmann & MacGregor (1980) Hartmann, L. & MacGregor, K. B. 1980, ApJ, 242, 260
- Henriques et al. (2010) Henriques, B., et al. 2010, arXiv:1009.1392
- Heydari-Malayeri et al. (1999) Heydari-Malayeri, M., et al. 1999, A&A, 347, 841
- Hidalgo et al. (2009) Hidalgo, S. L., et al. 2009, ApJ, 705, 704
- Hidalgo et al. (2003) Hidalgo, S. L., Marín-Franch, A., & Aparicio, A. 2003, AJ, 125, 1247
- Hony et al. (2009) Hony, S., et al. 2009, A&A, 501, 609
- Hora et al. (2008) Hora, J. L., et al. 2008, AJ, 135, 726
- Iben & Renzini (1983) Iben, Jr., I. & Renzini, A. 1983, ARA&A, 21, 271
- Indebetouw et al. (2004) Indebetouw, R., Johnson, K. E., & Conti, P. 2004, AJ, 128, 2206
- Indebetouw et al. (2005) Indebetouw, R., et al. 2005, ApJ, 619, 931
- Ita et al. (2010) Ita, Y., et al. 2010, PASJ, 62, 273
- Ita et al. (2007) —. 2007, PASJ, 59, 437
- Jackson et al. (2007a) Jackson, D. C., et al. 2007a, ApJ, 656, 818
- Jackson et al. (2007b) —. 2007b, ApJ, 667, 891
- Javadi et al. (2011) Javadi, A., van Loon, J. Th., & Mirtorabi, M. T. 2011, arXiv:1103.0755
- Kastner et al. (2008) Kastner, J. H., et al. 2008, AJ, 136, 1221
- Kato et al. (2007) Kato, D., et al. 2007, PASJ, 59, 615
- Keller & Wood (2006) Keller, S. C. & Wood, P. R. 2006, ApJ, 642, 834
- Kemper et al. (2010) Kemper, F., et al. 2010, PASP, 122, 683
- Lagadec et al. (2010) Lagadec, E., et al. 2010, MNRAS, 403, 1331
- Lagadec et al. (2007) —. 2007, MNRAS, 376, 1270
- Le Bertre (1992) Le Bertre, T. 1992, A&AS, 94, 377
- Lebzelter et al. (2006) Lebzelter, T., et al. 2006, ApJ, 653, L145
- Lindsay (1961) Lindsay, E. M. 1961, AJ, 66, 169
- Loup et al. (1997) Loup, C., et al. 1997, A&AS, 125, 419
- Luck et al. (1998) Luck, R. E., et al. 1998, AJ, 115, 605
- Maraston et al. (2006) Maraston, C., et al. 2006, ApJ, 652, 85
- Marigo et al. (1999) Marigo, P., Girardi, L., & Bressan, A. 1999, A&A, 344, 123
- Marigo et al. (2008) Marigo, P., et al. 2008, A&A, 482, 883
- Massey et al. (2007) Massey, P., et al. 2007, ApJ, 660, 301
- Matsuura et al. (2009) Matsuura, M., et al. 2009, MNRAS, 396, 918
- Matsuura et al. (2008) Matsuura, M., et al. 2008, in IAU Symposium, Vol. 251, IAU Symposium, ed. S. Kwok & S. Sandford, p197
- Matsuura et al. (2007) —. 2007, MNRAS, 382, 1889
- Mattsson et al. (2008) Mattsson, L., et al. 2008, A&A, 484, L5
- McDonald et al. (2011a) McDonald, I., et al. 2011a, ApJ, 730, 71
- McDonald et al. (2011b) —. 2011b, ApJS, 193, 23
- McDonald et al. (2011c) McDonald, I., Johnson, C. I., & Zijlstra, A. A. 2011c, arXiv: 1106.1016
- McDonald et al. (2009) McDonald, I., et al. 2009, MNRAS, 394, 831
- McDonald et al. (2011d) —. 2011d, arXiv: 1104.5155
- McQuinn et al. (2007) McQuinn, K. B. W., et al. 2007, ApJ, 664, 850
- Meixner et al. (2010) Meixner, M., et al. 2010, A&A, 518, L71
- Meixner et al. (2006) —. 2006, AJ, 132, 2268
- Minniti & Zijlstra (1997) Minniti, D. & Zijlstra, A. A. 1997, AJ, 114, 147
- Mizuno et al. (2006) Mizuno, N., et al. 2006, ApJ, 643, L107
- Momany et al. (2011) Momany, Y., et al. 2011, A&A, Submitted
- Nidever et al. (2011) Nidever, D. L., et al. 2011, ApJ, 733, L10
- Olsen et al. (2011) Olsen, K. A. G., et al. 2011, arXiv: 1106.0044
- Riebel et al. (2010) Riebel, D., et al. 2010, ApJ, 723, 1195
- Rieke et al. (2004) Rieke, G. H., et al. 2004, ApJS, 154, 25
- Roche et al. (1993) Roche, P. F., Aitken, D. K., & Smith, C. H. 1993, MNRAS, 262, 301
- Sanduleak (1989) Sanduleak, N. 1989, AJ, 98, 825
- Schirrmacher et al. (2003) Schirrmacher, V., Woitke, P., & Sedlmayr, E. 2003, A&A, 404, 267
- Schlegel et al. (1998) Schlegel, D. J., Finkbeiner, D. P., & Davis, M. 1998, ApJ, 500, 525
- Sedlmayr & Dominik (1995) Sedlmayr, E. & Dominik, C. 1995, Space Science Reviews, 73, 211
- Siess (2010) Siess, L. 2010, A&A, 512, A10
- Simon et al. (2007) Simon, J. D., et al. 2007, ApJ, 669, 327
- Skrutskie et al. (2006) Skrutskie, M. F., et al. 2006, AJ, 131, 1163
- Sloan et al. (2006) Sloan, G. C., et al. 2006, ApJ, 645, 1118
- Sloan et al. (2009) —. 2009, Science, 323, 353
- Smith & Lambert (1985) Smith, V. V. & Lambert, D. L. 1985, ApJ, 294, 326
- Smolders et al. (2010) Smolders, K., et al. 2010, A&A, 514, L1
- Srinivasan et al. (2009) Srinivasan, S., et al. 2009, AJ, 137, 4810
- Stinson et al. (2009) Stinson, G. S., et al. 2009, MNRAS, 395, 1455
- Subramanian & Subramaniam (2009) Subramanian, S. & Subramaniam, A. 2009, A&A, 496, 399
- Sylvester et al. (1994) Sylvester, R. J., Barlow, M. J., & Skinner, C. J. 1994, MNRAS, 266, 640
- Sylvester et al. (1998) Sylvester, R. J., Skinner, C. J., & Barlow, M. J. 1998, MNRAS, 301, 1083
- Szewczyk et al. (2009) Szewczyk, O., et al. 2009, AJ, 138, 1661
- Testor & Pakull (1985) Testor, G. & Pakull, M. 1985, A&A, 145, 170
- Tikhonov (2006) Tikhonov, N. A. 2006, Astronomy Letters, 32, 149
- van Loon (2000) van Loon, J. Th. 2000, A&A, 354, 125
- van Loon (2006) van Loon, J. Th. 2006, in Astronomical Society of the Pacific Conference Series, Vol. 353, Stellar Evolution at Low Metallicity: Mass Loss, Explosions, Cosmology, ed. H. J. G. L. M. Lamers, N. Langer, T. Nugis, & K. Annuk, 211
- van Loon et al. (2008a) van Loon, J. Th., Boyer, M. L., & McDonald, I. 2008a, ApJ, 680, L49
- van Loon et al. (2005a) van Loon, J. Th., et al. 2005a, A&A, 438, 273
- van Loon et al. (2008b) —. 2008b, A&A, 487, 1055
- van Loon et al. (1999a) —. 1999a, A&A, 351, 559
- van Loon et al. (2006a) —. 2006a, A&A, 447, 971
- van Loon et al. (2005b) van Loon, J. Th., Marshall, J. R., & Zijlstra, A. A. 2005b, A&A, 442, 597
- van Loon et al. (2006b) van Loon, J. Th., et al. 2006b, A&A, 450, 339
- van Loon et al. (2010a) —. 2010a, AJ, 139, 68
- van Loon et al. (2010b) —. 2010b, AJ, 139, 1553
- van Loon et al. (2001a) —. 2001a, A&A, 368, 950
- van Loon et al. (1999b) van Loon, J. Th., Zijlstra, A. A., & Groenewegen, M. A. T. 1999b, A&A, 346, 805
- van Loon et al. (2001b) van Loon, J. Th., et al. 2001b, A&A, 368, 239
- van Loon et al. (1997) —. 1997, A&A, 325, 585
- Vansevičius et al. (2004) Vansevičius, V., et al. 2004, ApJ, 611, L93
- Verhoelst et al. (2009) Verhoelst, T., et al. 2009, A&A, 498, 127
- Vijh et al. (2009) Vijh, U. P., et al. 2009, AJ, 137, 3139
- Wang & Chen (2002) Wang, X. & Chen, P. 2002, A&A, 387, 129
- Werner et al. (2004) Werner, M. W., et al. 2004, ApJS, 154, 1
- Westerlund (1997) Westerlund, B. E. 1997, Cambridge Astrophysics Series, 29
- Westerlund et al. (1986) Westerlund, B. E., Azzopardi, M., & Breysacher, J. 1986, A&AS, 65, 79
- Whitelock et al. (1989) Whitelock, P. A., et al. 1989, MNRAS, 238, 769
- Whitney et al. (2003) Whitney, B. A., et al. 2003, ApJ, 598, 1079
- Wilke et al. (2003) Wilke, K., et al. 2003, A&A, 401, 873
- Williams et al. (2009) Williams, B. F., et al. 2009, ApJ, 695, L15
- Winters et al. (2000) Winters, J. M., et al. 2000, A&A, 361, 641
- Winters et al. (2003) —. 2003, A&A, 409, 715
- Woitke (2006) Woitke, P. 2006, A&A, 460, L9
- Woitke (2007) Woitke, P. 2007, in Astronomical Society of the Pacific Conference Series, Vol. 378, Why Galaxies Care About AGB Stars: Their Importance as Actors and Probes, ed. F. Kerschbaum, C. Charbonnel, & R. F. Wing, 156
- Wood et al. (1992) Wood, P. R., et al. 1992, ApJ, 397, 552
- Woods et al. (2011) Woods, P. M., et al. 2011, MNRAS, 411, 1597
- Yang et al. (2006) Yang, X., et al. 2006, AJ, 132, 1468
- Zaritsky et al. (2002) Zaritsky, D., et al. 2002, AJ, 123, 855
- Zhang et al. (2010) Zhang, H., et al. 2010, Ap&SS, 126