Supplementary Material
I Filament and particle dynamics
Tables 1 and 2 are summarizing the elementary steps of the particle and filament dynamics. Note that we distinguish between microtubule (MT) and actin dynamics in our model in the following way Alberts et al. (2002): In contrast to MTs, actin filaments can uncap and depolymerize at the minus end to perform treadmilling. MTs do not treadmill but, on the other hand, can perform dynamic instability at the plus end. They can turn to a plus-end depolymerizing state, which can be rescued to turn to a polymerizing state.
For all simulations we used a stochastic random sequential update scheme and continuous space coordinates.
| Process | Particle state(s) | Description | Parameter name |
|---|---|---|---|
| Diffusion | D | Detached particles move in a random direction. Step widths are uniformly distributed between and . | |
| Step | A | Attached particles move to adjacent subunit in (+)-direction. | |
| Attachment | DA | Particles bind to subunits if their distance is less than , becoming ’attached’. | |
| Detachment | AD | Particles detach from filament. |
| Process | Description | Probability |
|---|---|---|
| Nucleation | New filament created; arbitrary direction. The process needs nucleations seeds (e.g. -tubulin for microtubules) and monomers. -Cap inhibits shrinking. | |
| Growth | New sub-segment added at -end. | |
| Shrinking | Segment removed at -end if not -capped or at -end if in shrink state. | |
| Uncapping | -Cap is removed allowing depolymerization hence (only actin). | |
| Catastrophe | -end turns into shrink state. (only MT) | |
| Rescue | -end turns into growth state again. (only MT). |
II Choice of default parameters
The default parameters of our model were chosen in accordance with available experimental results or, if not directly accessible, according to established models. In Table 3 the parameters for microtubule and vesicle dynamics are given. For dynamics of actin dynamics, we refer to the work Greulich and Santen (2010), Table 4.
The measured quantities in Table 3 (column 4) are displayed according to their sources referenced in column 3. These measured quantities are transferred to the time and length scales used in the simulations (column 5).
Comments:
-
(i)
The maximal tubulin density is reached, if all microtubules are dissolved. Assuming 26 tubulin dimers per microtubule segments Alberts et al. (2002) (16nm are two twists of the microtubule structure), 20 microtubules per Alvarez and Zarour (1983) and free tubulin concentration of 5 in healthy axons Hinow et al. (2009), one obtains 59.
- (ii)
-
(iii)
All nucleation seeds are already present in the beginning. Each microtubule is hence initiated by a growth process of a bare tubulin.
-
(iv)
In reference Chen and Hill (1988) the binding rate for kinesin in dependence of the distance of the binding filament is given by with and . The average binding rate within a distance from a filament of length hence is . The integration space is due to the cylindrical form of the binding region.
-
(v)
We adjusted the entry and exit rates of particles such that the observed density in the healthy axon was approximately as in the referenced work.
-
(vi)
The length of the microtubule depletion zone in the experiments Erez et al. (2007) was about . Due to computational constraints we were able to simulate a system of length , giving the length of the depletion zone . Adjusting to the proportions of the experimental picture, we chose a cylinder radius . However, we also tested other system sizes which did not affect the generic structure of the particle traps.
| Parameter name | Reference | Reference Value | Model parameters |
| Filament dynamics: | |||
| growth rate | Hinow et al. (2009) | ||
| shrink rate | Hinow et al. (2009) | ||
| microtubule density | Alvarez and Zarour (1983) | ||
| max. monomer density | -tubulin density Alvarez and Zarour (1983); Alberts et al. (2002); Hinow et al. (2009) | ( See comment (i)) | |
| tubulin density | Yu and Baas (1994); Alvarez and Zarour (1983) | (See comment (ii)) | |
| nucleation rate | See comment (iii) | see above | |
| catastrophe rate | Cassimeris et al. (1988) | ||
| rescue rate | Cassimeris et al. (1988) | ||
| Particle dynamics: | |||
| particle radius | Korgel et al. (1998) | 50nm (average) | 0.5 |
| binding distance | Alberts et al. (2002) | (length of kinesin) | 0.8 |
| subunit distance | Alberts et al. (2002) | 16nm (1 stepping period of kinesin) | 0.16 |
| step rate | Kwinter et al. (2009) | velocity = | |
| attachment | Chen and Hill (1988) | (See comment (iv)) | 0.059 |
| detachment | Kwinter et al. (2009) | run length | |
| diffusive step length | Luby-Phelps (2000) | diff. const. | |
| particle density | Mackey et al. (1981) | ||
| entry rates | Mackey et al. (1981) | See comment (v) | |
| exit rates | Mackey et al. (1981) | See comment (v) | |
| System size | See comment (vi) | See comment (vi) | length , radius |
| MT depletion zone | See comment (vi) | See comment (vi) |
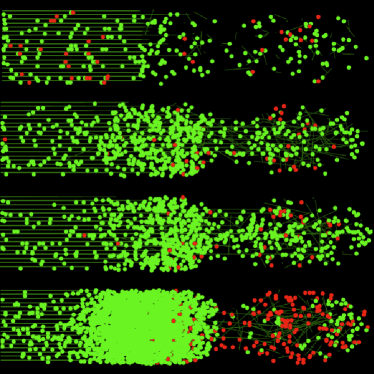
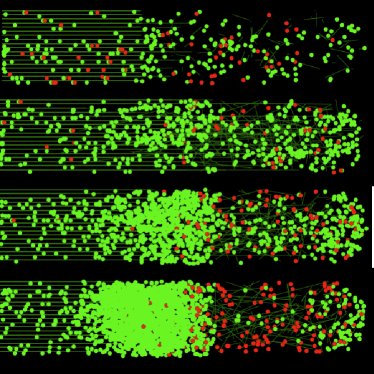
III Time evolution of the simulations: transected axon
Here we show some intermediate time configurations of particles and filaments both in the case of a plain cylindrical geometry (with a round tip) and a cylinder with a tapered region, mimicking the geometry of the axon more faithfully. One observes that in both cases accumulations of plus particles occur left of the depletion area and at the tip, similar to the experiments. However for the plain cylindrical geometry it takes longer to achieve this state.
One also observes that in the beginning, the parallel bundles are also present in the right part of the system, while accumulation of vesicles already begins. Hence the accumulation is not due to a diffusive bottleneck in the middle of the system.
References
- Alberts et al. (2002) B. Alberts et al., Molecular Biology of the Cell (Garland, 2002).
- Greulich and Santen (2010) P. Greulich and L. Santen, Eur. Phys. J. E 32, 191 (2010).
- Alvarez and Zarour (1983) J. Alvarez and J. Zarour, Exp Neurol. 79, 283 (1983).
- Hinow et al. (2009) P. Hinow, V. Rezania, and J. A. Tuszyński, Phys. Rev. E 80, 31904 (2009).
- Yu and Baas (1994) W. Yu and P. W. Baas, The Journal of Neuroscience 14, 2818 (1994).
- Chen and Hill (1988) Y.-d. Chen and T. L. Hill, Proc. Natl. Acad. Sci. 85, 431 (1988).
- Erez et al. (2007) H. Erez et al., The Journal of Cell Biology 176, 497 (2007).
- Cassimeris et al. (1988) L. Cassimeris, N. K. Pryer, and E. D. Salmon, The Journal of Cell Biology 107, 2223 (1988).
- Korgel et al. (1998) B. A. Korgel, J. H. van Zanten, and H. G. Monbouquette, Biophysical Journal 74, 3264 (1998).
- Kwinter et al. (2009) D. M. Kwinter, K. Lo, P. Mafi, and M. A. Silverman, Neuroscience 162, 1001 (2009).
- Luby-Phelps (2000) K. Luby-Phelps, International Review of Cytology 192, 189 (2000).
- Mackey et al. (1981) S. Mackey, G. Schuessler, D. J. Goldberg, and J. H. Schwartz, Biophys J. 36, 455 (1981).