H i asymmetries in the isolated galaxy CIG 292
Abstract
present Expanded Very Large Array (EVLA) D-array observations in the 21-cm line of neutral hydrogen (H i) of CIG 292, an isolated SA(s)b galaxy at a distance of 24.3 Mpc. From previous H i single dish observations the galaxy was known to have a mildly asymmetric H i profile (Aflux =1.23 ). Our EVLA observations show there is 12% more H i projected South of the optical centre (approaching velocities) than in the North (receding velocities), despite the H i extending 16% further to the North than the South. The H i projected within the optical disk must have been perturbed within the H i relaxation time (108 yr ) which implies that this can not have been caused by any of the three nearest companions, as their distance ( Mpc) is too rge. Neither H i–rich companions nor tidal tails were found within our field of view and velocity range covered. Our kinematical data suggest that the inner part harbors an oval distortion whereas the outer regions show signs of a modest warp. e mild asymmetry in the H i global profile thus actually masks stronger asymmetries in the two–dimensional distributions of gas and star forming regions in this galaxy. Since the galaxy is isolated, this must predominantly be due to processes related to its formation and secular evolution.
1 Introduction
Galaxy evolution and the resulting properties of galaxies depend on the environment they find themselves in. In order to quantify the effect of environment (‘nurture’) on their morphology, structure, nuclear activity, star formation properties, etc., one needs a well defined sample of galaxies that are minimally perturbed by other galaxies to provide a baseline of what are thought to be unperturbed (or pure ‘nature’) objects. The AMIGA (Analysis of the Interstellar Medium of Isolated GAlaxies, Verdes–Montenegro et al. (2005); http://amiga.iaa.es) project provides a statistically significant sample of the most isolated galaxies. It is a refinement of the original Catalogue of Isolated Galaxies (CIG; Karachentseva, 1973). Galaxies in the AMIGA sample have not been involved in a major tidal interaction within the last 3 Gyr (Verdes–Montenegro et al., 2005). Quantification of the strength of tidal interactions with neighboring minor companions and the local number density is available for all galaxies in the AMIGA sample (Verley et al., 2007a, b). The AMIGA project has clearly established that the most isolated galaxies have different physical properties, even compared to what are generally considered field samples, in terms of their morphology (asymmetry, concentration), LFIR, the radio-FIR correlation, rate of AGNs or H i asymmetry (Verdes–Montenegro et al., 2010, and references therein).
Despite having much lower rates of H i and optical asymmetry than galaxies in denser environments (Durbala et al., 2008; Espada et al., 2011a), some galaxies in the AMIGA sample show appreciable asymmetry. Espada et al. (2011a) studied the H i profiles of a sample of 166 AMIGA galaxies using an H i asymmetry parameter Aflux defined as the ratio between the receding and approaching sides of the single dish profile. They found the distribution of this parameter to be well described by the right half of a Gaussian distribution, with only 2% of the sample having an asymmetry parameter in excess of 3 (Aflux 1.39, meaning a 39% excess of flux in one half of the spectrum). They did not find any correlation between the H i asymmetry parameter and minor companions, measured both as the tidal force (one-on-one interactions) and in terms of the number density of neighboring galaxies. In contrast, field galaxy samples deviate from a Gaussian distribution and have higher (10-20%) rates of asymmetry (Espada et al., 2011a).
To investigate the causes of asymmetry in the absence of major interactions we are carrying out resolved H i studies of a sample of AMIGA galaxies with the EVLA, covering a representative range of H i asymmetry parameters (Aflux = 1.05 to 1.25). For example, Espada et al. (2005) presented H i VLA D–configuration results of the asymmetric galaxy CIG 96, with Espada et al. (2011b) giving results of further C–array observations of this galaxy. G 96 has a large and asymmetric H i envelope (RHI/R25= 3.5), which partly coincides with faint UV emission with a more regular distribution. The kinematics of this H i envelope shows an area of non-circular motions, which could not be attributed to a major interaction.
Here we present the results of EVLA H i mapping of CIG 292 (NGC 2712) which has an A, and can be considered as intermediate between symmetric and asymmetric objects such as CIG 96.
We ascertained once more that CIG 292 is an isolated galaxy. Despite it being listed as part of a group (Tully et al., 2008; Makarov & Karachentsev, 2011), only 3 potential companions have similar recession velocities to CIG 292 but their projected distances are large (58′, 62′, and 67′, thus all of order 0.5 Mpc). CIG 292 turns out to be isolated according to the criteria used by Karachentseva (1973), with local number density and tidal strength characteristics falling within the limits of the bona fide AMIGA sample (, QKar = -3.106; Verley et al., 2007b). No H i rich (dwarf) companions were detected within the 32′ region mapped by the EVLA primary beam either. Any current tidal effect is therefore negligible and any past interaction would have been at least 3 Gyr ago.
The neutral hydrogen component of CIG 292 has previously been observed with the Westerbork Synthesis Radio Telescope (WSRT) by Krumm & Shane (1982), and with single dish telescopes by Huchtmeier & Richter (1985) and Springob et al. (2005). CIG 292 is particularly interesting since the H i disk is significantly more extended than the optical one (see Sect. 3.1), and faint optical emission is found at large radius as well (Koopmann & Kenney, 2006).
Section 2 gives details of the observations, with the results in Section 3 and discussion and concluding remarks in Section 4. We calculate the distance to the galaxy, based on the observed recession velocity and corrected for Virgo–flow, to be 23.4 Mpc which implies an angular scale where 1′ corresponds to kpc.
2 H i observations
| Parameter | Value |
|---|---|
| Object | CIG 292 |
| (J2000)aaLeon & Verdes–Montenegro (2003) | |
| (J2000)aaLeon & Verdes–Montenegro (2003) | 44°54′51.5″ |
| Morphological typebbDurbala et al. (2008) | SA(s)b |
| Optical inclinationbbDurbala et al. (2008) | 58° |
| log LBccEspada et al. (2011c) | 9.77 log |
| Instrument | EVLA |
| Observing date | 25th April 2010 |
| Configuration | D–array |
| Project ID | AE175 |
| Primary calibrator | 3C147 |
| Secondary calibrator | J0834+5534 |
| Central velocity | 1842 km s-1 |
| FWHM of primary beam | 32′ |
| Total bandwidth | 4.0 MHz |
| Number of channels | 256 |
| Channel spacing | 15.625 kHz (3.32 km s-1) |
| FWHM of synthesized beam | 46″ 42″ |
| Time on source | 3.2 hr |
| rms noise | 1.25 mJy beam-1 (0.4 K TB) |
Observations of CIG 292 were obtained using 26 antennas of the NRAO111The National Radio Astronomy Observatory is a facility of the National Science Foundation, operated under cooperative agreement by Associated Universities, Inc. Expanded Very Large Array (EVLA) in D-configuration on 25th April, 2010 (Project ID: AE175). The primary calibrator 3C147 (assumed flux density of 22.5 Jy) was observed at the beginning of the run; it was also used as bandpass calibrator. Interspersed with the source, the secondary calibrator J0834+5534 (with a derived flux density of Jy) was observed. In total 3.2 hours were spent on source with both polarizations recorded. CIG 292 was observed across a spectral bandwidth of 4 MHz (corresponding to km s-1), centered at a frequency of 1411.65 MHz, at a frequency resolution of 15.625 kHz (3.32 km s-1). Table 1, we provide some general properties of the galaxy, as well as the principal parameters of the observational setup.
The data re correlated using the new EVLA WIDAR correlator, and the data reduction was performed using CASA (Common Astronomy Software Applications) version 3.02. For guidance we followed the spectral line tutorials available online at the CASA website222http://casaguides.nrao.edu/. The data reduction was carried out on one of the nodes of the cluster of the Centre for Astrophysics Research at the University of Hertfordshire.
The EVLA observations were carried out at night, avoiding any possible issues related to Solar RFI. Antenna position corrections were applied to antennas 12 and 22. We edited (flagged) the data based on the average of the inner 150 channels (from the 256 available). We also decided to omit all data from antennas 9, 14, 17, and 23 at this stage as their L–band receivers had not been upgraded and their visibilities presented values one order of magnitude lower than average.
Calibration of the spectral line data was performed by first solving for phase corrections to the 3C147 scan followed by deriving the bandpass complex gains on this calibrator. Amplitude and phase solutions for the flux calibrator and phase calibrator (J0834+5534) were derived on the average of channels 50 to 200 (i.e., on a quasi–continuum data set). After first inspection, a further iteration of flagging and calibration was applied, including flagging of bad visibilities related to the target. Continuum subtraction was performed using 10 channels on either side of the velocity range covered by the target that were found to be free from line emission.
Imaging of CIG 292 was performed using CASA’s standard cleaning algorithm. We produced a cube using the Briggs robust weighting scheme (Briggs, 1995) where we found robust=0.5 to be a good compromise between spatial resolution (which results in a beam size of 46″ 42″) and sensitivity. The cube was cleaned down to a flux threshold of (3.75 mJy beam-1).
The cube was subsequently transferred into AIPS (version 31DEC11) in order to restore the velocity information to the header since observations were taken at a fixed frequency. We fixed the centre of the band at a velocity of 1842 km s-1. We separated genuine emission from noise following the conditional blanking method employed by Walter et al. (2008). A data cube convolved to 75″ resolution was used to mask regions of emission that were above rms noise over three consecutive velocity channels. As a final step, the zero and first order moment maps (total surface brightness and velocity field) were created using AIPS task XMOM. Both the data cube and the moment 0 map were corrected for primary beam attenuation.
3 EVLA H i Results
3.1 H i integrated map and spectra
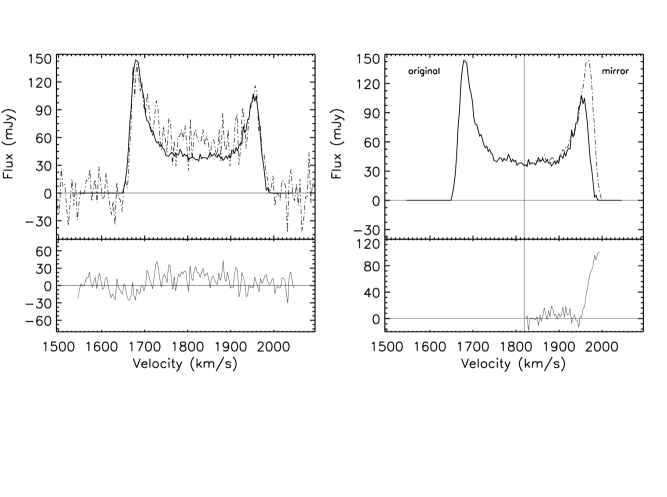
We present in Fig.1 the EVLA H i integrated spectrum for CIG 292 and that of the single dish profile obtained by Springob et al. (2005) using the 43-m Greenbank (formerly known as 140–ft) radio telescope with a beam of 20′. We also present in the same figure the difference between both spectra. We measured an integrated EVLA flux of 19.0 Jy km s-1 which translates to an H i mass of 2.5 assuming optically thin emission. This value is in good agreement with previous interferometric observations of this object performed with the WSRT (Krumm & Shane, 1982) of 20.1 Jy km s-1 (2.6 ) and the flux retrieved by Springob et al. (2005) obtained with the 43–m telescope of 22.26 Jy km s-1, the interferometers possibly missing a small fraction of low–level, extended emission. In that context it is interesting to note where the main differences between Greenbank and EVLA spectra originate (see Fig. 1). We recover most of the flux in the regions of the peaks where the emission in individual channels is most compact. It is in the central velocity channels (between 1700 km s-1 and 1900 km s-1) of the galaxy where the H i is possibly more extended since on average we underestimate the single dish flux by some 20%.
We also present in Fig. 1, a folded profile determined down to 20% of the peak level, by flipping the emission around a velocity of 1818 km s-1. This shows that most of the asymmetry is coming from the highest velocities in the profile, in the 1950 km s-1 to 2000 km s-1 range, corresponding to the northern side of the galaxy.
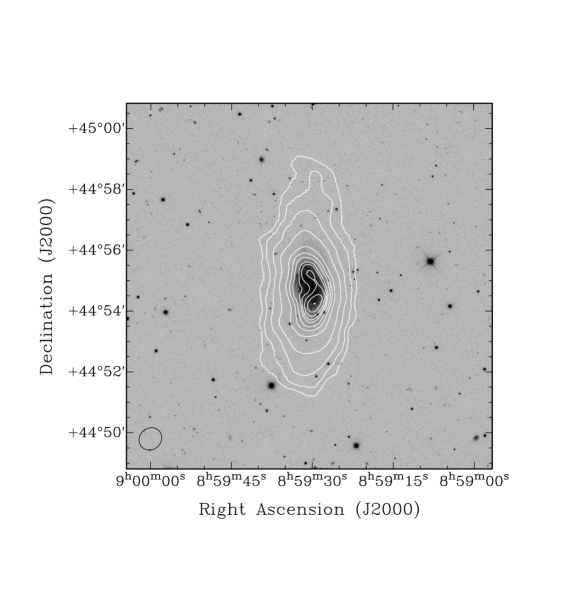
In Fig. 2 we show the H i column density map of CIG 292 as contours overlaid on the SDSS band image. The galaxy has an extended H i disk with a diameter of 46 kpc (6.5′) measured at a lumn density of at cm-2. The new EVLA data are vastly superior to the Krumm & Shane (1982) maps, the total H i surface brightness map going deeper by an order of magnitude, and the velocity resolution being better by about a factor of 5. The specific benefits of the EVLA over the VLA for this kind of work is, of course, the availability of the vastly superior WIDAR correlator which offers a wide instantaneous velocity range which opens up the possibility to search for companions within a large volume around a target while maintaining high velocity resolution to study any object thus detected.
Down to the noise level of at cm-2 (a detection across 5 channels or 16.5 km s-1 which corresponds to the typical line width of H i at a velocity dispersion of 7 km s-1), the galaxy measures 3.6′ (25 kpc) to the South and 4.3′ (30 kpc) to the North, making it lopsided. The extended nature of the H i structure in the North can be traced across 10 consecutive individual velocity channels ( 32 km s-1), indicating that it is part of the galaxy. The R25–to–RHI ratio is assuming an R25 of 1.5′ (LEDA) and our RHI of 3.25′ measured at at cm-2. This falls within the typical range of optical to H i extent from the study by Broeils & Rhee (1997) of . At the current H i resolution, no details such as spiral arms or evidence for a bar can be discerned in our H i data. cause up to 20% of the total flux is missing in some of the channel maps due to the lack of short–spacings, which mainly affects the extended structure, our RHI and RHI–to–R25 ratio are lower limits. For the same reason the H i mass to luminosity ratio presented in the following section is a lower limit.
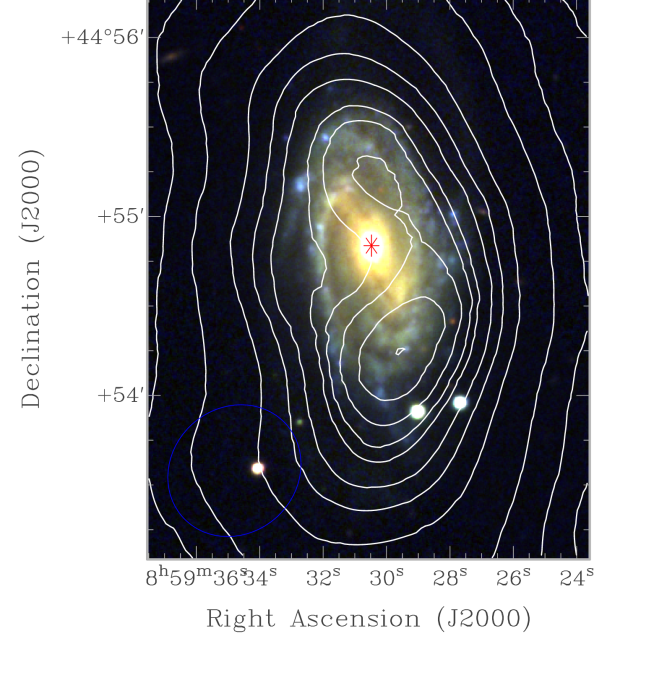
The inner disc of the galaxy is shown in more detail in Fig. 3, where we zoom in on the central region of the galaxy, overlaying H i contours on an SDSS and composite image. Fig. 3 shows that the column density peak is offset by 40″ (4.6 kpc) in projection to the SW of the optical centre (marked with a star in the figure), with the higher density contours forming an arc–like structure along the western side of the galaxy.
3.2 Kinematics
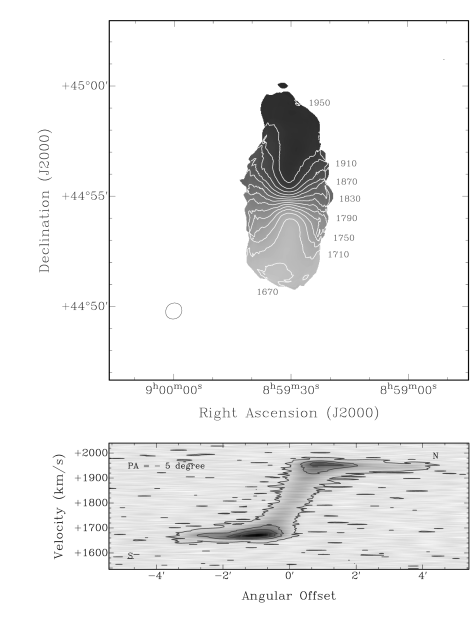
We present in Fig. 4 the velocity field of CIG 292. The disk shows regular rotation throughout most of the disc. The isovelocity contours at the outskirts (beyond 2.5′) are however twisted, symptomatic of a warped disk. Initially the twist is point symmetric and clockwise, but in the far North (beyond 3.6′ or 25 kpc) the position angle twists back, counter–clockwise.
A Position–Velocity (PV) diagram along the major axis of the galaxy (PA°) is shown in Fig. 4 (bottom panel). We trace the southern side here out to 3.6′ and the northern side to 4.3′. The (PV)–diagram shows steeply rising rotation, unresolved by the beam, within the inner part (up to 1′ in diameter) followed by flat rotation out to the last measured point on either side. Márquez et al. (2004) using optical long–slit spectroscopy confirm the steep rise in the gas component, the peak velocity being reached within 10″ (1.2 kpc).
Assuming circular rotation and the inclination of 58° from LEDA, we can use our data to find a dynamical mass for CIG 292. At the last point of the rotation curve at 30.1 kpc (measured at a column density of at cm-2) we measure an indicative rotation velocity of 120 km s-1, or an intrinsic velocity of 140 km s-1. Using M gives a dynamical mass of . This implies an M/L. We find an MH/L. This makes it underluminous for its Hubble type (Roberts & Haynes, 1994). Further data at higher angular resolution are needed to provide a detailed mass model.
4 Discussion and concluding remarks
The H i results show that CIG 292 has an asymmetric H i distribution, extending farther North than South, with a twist in the outer parts suggestive of a slightly warped atomic gas disk. Even so, the H i extension is at the side where there is the least H i in the integrated profile. Thus, the asymmetry in the H i global profile is partly masking a stronger asymmetry in the two-dimensional distribution, already suggested by Espada et al. (2011a).
A closer look at the available optical images in NED shows a system of faint optical arms (Koopmann & Kenney, 2006). ing ellipse fitting, the position angle at those radii is about -3 degrees, in reasonable agreement with the PA of the major axis indicated by the kinematics, which is about -6 degrees between 2.5 and 4.0 arcmin radius. The more central parts of the galaxy have a position angle of about +5 degrees, which indicates that the galaxy there has an oval shape, consistent with the fact that the kinematical major and minor axes at those radii are not perpendicular (Bosma, 1978). Moreover, this oval is seen as an enhancement above the underlying exponential disk (a “lens” component) in the radial luminosity profile presented in Erwin et al. (2008). Such a feature is rather common in early type spiral galaxies (e.g., Kormendy, 1979).
Inspection of available GALEX images, H images and the 8 image from the Spitzer archive shows that this bright inner region is copiously forming stars, and has asymmetries in the distribution of star forming regions. This coincides with the asymmetry in the inner H i distribution as noted in Fig. 3. These asymmetric distributions within the optical radius must have been perturbed within the relaxation time scale for the high density gas, i.e., of the order of 108 yr (Boselli et al., 1994). This short relaxation time scale seems to preclude an interaction with any of the three nearest companions as the source of the high–density H i asymmetry.
We can exclude as well an encounter with a companion with a large pericenter distance since this would necessitate a massive companion which is simply not there. Alternatively the large scale asymmetry may be due to an interaction with a small companion which in the meantime has merged, or to ongoing cold accretion (e.g., Bournaud et al., 2005).
In conclusion, our new EVLA data on this galaxy have revealed that the mild asymmetry in the H i global profile actually hides stronger asymmetries in the two-dimensional distributions of gas and of the star forming regions in this galaxy. Our data indicate that the central bright parts of the optical disk form an oval distortion, with a position angle that is different from that of the faint optical disk and the bulk of the H i disk. In the northern part there is an extension, which is not necessarily in the same plane as the outer disk.
for the causes of such asymmetries in isolated galaxies, the oval distortion comes naturally from a bar instability in the disk (e.g., Athanassoula, 2010). The asymmetry in the neutral gas distribution could be related to ongoing accretion of the neutral gas from the cosmic web at angles forcing the outer H i disk to be warped w.r.t. the optical disk (e.g., Jiang & Binney, 1999). Alternatively, it could be due to an m=1 instability. Data at higher angular resolution will be necessary to study the kinematics of the inner bright regions, in order to discern the dynamical causes of the asymmetries.
References
- Athanassoula (2010) Athanassoula, E. 2010, ASP Conf. Series, 421, Galaxies in Isolation: Exploring Nature Versus Nurture, eds. L. Verdes–Montenegro et al. (San Francisco: ASP),157
- Boselli et al. (1994) Boselli A., Gavazzi G., Combes F., Lequeux J., & Casoli F. 1994, A&A, 285, 69
- Bosma (1978) Bosma, A. 1978, PhD Thesis, Univ. of Groningen
- Bournaud et al. (2005) Bournaud F., Combes F., & Semelin, B. 2005, MNRAS, 364, L18
- Briggs (1995) Briggs, D. S. 1995, Ph.D. dissertation, New Mexico Tech., Socorro, NM
- Broeils & Rhee (1997) Broeils, A. H., & Rhee, M.-H. 1997, A&A, 324, 877
- Durbala et al. (2008) Durbala, A., Sulentic, J. W., Buta, R., & Verdes-Montenegro, L. 2008, MNRAS, 390, 881
- Erwin et al. (2008) Erwin, P., Pohlen, M., & Beckman, J. E. 2008, A&A, 135 20
- Espada et al. (2005) Espada, D., Bosma, A., Verdes-Montenegro, L., Athanassoula, E., Leon, S., Sulentic, J., & Yun, M. S. 2005, A&A, 442, 455
- Espada et al. (2011a) Espada, D., et al. 2011a, A&A, in press
- Espada et al. (2011b) Espada, D., et al. 2011b, ApJ, in press
- Espada et al. (2011c) Espada, D., et al. 2011c, in preparation
- Jiang & Binney (1999) Jiang, I.–G., Binney, J. 1999, MNRAS, 303, L7
- Huchtmeier & Richter (1985) Huchtmeier, W. K., & Richter, O.–G. 1985, A&A, 149, 118
- Karachentseva (1973) Karachentseva, V. E. 1973, Soobshcheniya Spetsial’noj Astrofizicheskoj Observatorii, 8, 3
- Koopmann & Kenney (2006) Koopmann, R. A., & Kenney, J. D. P. 2006, ApJS, 162, 97
- Kormendy (1979) Kormendy, J. 1979, ApJ, 227, 714
- Krumm & Shane (1982) Krumm, N., & Shane, W. W. 1982, A&A, 116, 237
- Leon & Verdes–Montenegro (2003) Leon, S., & Verdes-Montenegro, L. 2003, A&A, 411, 391
- Makarov & Karachentsev (2011) Makarov, D., & Karachentsev, I. 2011, MNRAS, 412, 2498
- Márquez et al. (2004) Márquez, I., et al. 2004, A&A, 416, 475
- Roberts & Haynes (1994) Roberts, M. S., & Haynes, M. P. 1994, ARA&A, 32, 115
- Springob et al. (2005) Springob, C. M., Haynes, M. P., Giovanelli, R., & Kent, B. R. 2005, ApJS, 160, 149
- Tully et al. (2008) Tully, R. B., Shaya, E. J., Karachentsev, I. D., Courtois, H. M., Kocevski, D. D., Rizzi, L., & Peel, A. 2008, ApJ, 676, 184
- Verdes–Montenegro et al. (2005) Verdes–Montenegro, L., Sulentic, J., Lisenfeld, U., Leon, S., Espada, D., Garcia, E., Sabater, J., & Verley, S. 2005, A&A, 436, 443
- Verdes–Montenegro et al. (2010) Verdes–Montenegro, L., Del Olmo, A., & Sulentic, J. 2010, ASP Conf. Series, 421, Galaxies in Isolation: Exploring Nature Versus Nurture
- Verley et al. (2007a) Verley, S., et al. 2007a, A&A, 470, 505
- Verley et al. (2007b) Verley, S., et al. 2007b, A&A, 472, 121
- Walter et al. (2008) Walter, F., Brinks, E., de Blok, W. J. G., Bigiel, F., Kennicutt, R. C., Thornley, M. D., & Leroy, A. 2008, AJ, 136, 2563