Presently at ]Institute of Mechanics and Fluid Dynamics, TU Bergakademie Freiberg, Lampadiusstr. 4, 09596 Freiberg, Germany Also at ] Department of Mechanical Engineering, Mississippi State University, Mississippi State, MS 39762
Also at ]Center for Computational Sciences, Mississippi State University, Mississippi State, MS 39762
Also at ]Los Alamos National Laboratory, MST-8, MS G755, Los Alamos, NM 87545
MEAM potentials for Al, Si, Mg, Cu, and Fe alloys
Abstract
A set of Modified Embedded Atom Method (MEAM) potentials for the interactions between Al, Si, Mg, Cu, and Fe was developed from a combination of each element’s MEAM potential in order to study metal alloying. Previously published MEAM parameters of single elements have been improved for better agreement to the generalized stacking fault energy (GSFE) curves when compared with ab-initio generated GSFE curves. The MEAM parameters for element pairs were constructed based on the structural and elastic properties of element pairs in the NaCl reference structure garnered from ab-initio calculations, with adjustment to reproduce the ab-initio heat of formation of the most stable binary compounds. The new MEAM potentials were validated by comparing the formation energies of defects, equilibrium volumes, elastic moduli, and heat of formation for several binary compounds with ab-initio simulations and experiments. Single elements in their ground state crystal structure were subjected to heating to test the potentials at elevated temperatures. An Al potential was modified to avoid formation of an unphysical solid structure at high temperatures. The thermal expansion coefficient of a compound with the composition of AA 6061 alloy was evaluated and compared with experimental values. MEAM potential tests performed in this work, utilizing the universal Atomistic Simulation Environment (ASE), are distributed to facilitate reproducibility of the results.
pacs:
61.50.Lt, 62.20.D- 61.72.J- 68.35.-pI Introduction
Historically, materials have been developed through the correlation of processing and properties. Several implementations of materials science principles have given birth to an engineering framework for materials design. Over the past two decades, more efficient computational methodologies have been developed and the computational power have increased enormously, making the computational materials design an essential cost-effective tool to design materials properties. Since materials complexities can limit the degree of predictability, several time- and length-scale methodologies (hence spatiotemporal hierarchy) for computational materials design naturally evolved (cf. Horstemeyer (2010) for a review). Out of several computational methodologies, atomistic simulations not only can predict the materials properties from a statistical viewpoint, but can also quantify the mechanisms of the structure-property relationship. One of the most critical components of atomistic simulations is the interatomic potential, which determines the forces on individual atoms. First-principles calculations certainly are capable of providing very reliable interatomic potentials in a variety of chemical environments. However, realistic simulations of alloy systems, which are essential to reveal many macroscopic materials properties, often require a number of atoms that renders these methods impractical – they either require too much computer memory or take too long to be completed in a reasonable amount of time. One alternative is to use (semi-)empirical interaction potentials that can be evaluated efficiently, so that the atomistic approaches that use them can, in certain cases, handle systems with more than a million atoms.
The Embedded-Atom Method (EAM) is a widely used atomic level semiempirical model for metals, covalent materials, and impurities Daw and Baskes (1983); *daw84:embed; *baskes87:applic; *daw89:model. MEAM (Modified EAM) incorporates angular dependency of electron density into EAM. Atomistic simulations of a wide range of elements and alloys have been performed using MEAM potentials. MEAM model was first used for silicon, germanium, and their alloys Baskes et al. (1989). It was applied to 26 single elements Baskes (1992) and to silicon-nickel Baskes et al. (1994) alloys and interfaces. Gall et al. (2000) have used MEAM to model tensile debonding of an aluminum-silicon interface. Lee and Baskes (2000) improved MEAM to account for the second nearest-neighbor interactions. Also, Huang et al. (1995) used MEAM and two other potentials to determine defect energetics in beta-SiC. MEAM parameters for nickel Baskes (1997) and molybdenum-silicon system Baskes (1999) were determined by Baskes. MEAM potentials for Cu, Ag, Au, Ni, Pd, Pt, Al, and Pb based on the first and the second nearest-neighbor MEAM were constructed by Lee et al. (2003). Hu et al. (2001, 2003) proposed a new analytic modified EAM many-body potential and applied it to 17 hcp metals. The structural properties of various polytypes of carbon were described using a MEAM potential by Lee and Lee (2005). Recent work of Lee et al. (2010) summarized available MEAM potentials for single elements and alloys. Several of these potentials were then used to perform large scale atomistic simulations to understand the intriguing nature of the ductile and brittle fracture Kang and Cai (2007), structure-property relationship Gates et al. (2005), dislocation dynamics Noronha and Farkas (2002); Martínez et al. (2008), and nature of materials fracture Potirniche et al. (2006); Van Swygenhoven et al. (2004).
| elem. | [eV] | [Å] | |||||||||||||
|---|---|---|---|---|---|---|---|---|---|---|---|---|---|---|---|
| Al | 3.353 | 4.05 | 1.07 | 4.64 | 2.04 | 3.0 | 6.0 | 1.5 | 1.0 | 4.50 | -2.30 | 8.01 | 0.8 | 2.8 | 1.0 |
| Si | 4.63 | 5.431 | 1.00 | 4.87 | 4.4 | 5.5 | 5.5 | 5.5 | 1.0 | 2.05 | 4.47 | -1.80 | 2.0 | 2.8 | 2.2 |
| Mg | 1.51 | 3.194 | 0.8 | 5.52 | 4.0 | 3.0 | 0.2 | 1.2 | 1.0 | 10.04 | 9.49 | -4.3 | 0.8 | 2.8 | 0.63 |
| Cu | 3.54 | 3.62 | 1.07 | 5.11 | 3.634 | 2.2 | 6.0 | 2.2 | 1.0 | 4.91 | 2.49 | 2.95 | 0.8 | 2.8 | 1.1 |
| Fe | 4.28 | 2.851 | 0.555 | 5.027 | 3.5 | 2.0 | 1.0 | 1.0 | 1.0 | -1.6 | 12.5 | -1.4 | 0.68 | 1.9 | 1.0 |
Aluminum, magnesium, copper, and iron alloys are being used in developing materials with novel properties. Great popularity of these alloys is connected to their general functional properties, mechanical properties, mass density, corrosion resistance, and machinability. Light metal alloys, such as magnesium and aluminum alloys, are now demanded for use in the automotive and aviation industries. They performed remarkably well for the purpose of decreasing the operating expenses and fuel consumption. These alloys usually contain several other minor elements, such as silicon, nickel, and manganese, and are known to have very complex phase compositions. Assessment of such complex systems is a very challenging task, since different constituent elements can form different phases, whose selection depends on the ratio between the constituents and also on a variety of processing and treatment factors.
Contrary to DFT potentials, most of the single element semiempirical potentials do not combine easily into multi-component alloy models. The difficulty of combining single element EAM potentials into alloy systems comes from the need of their normalization Johnson and Oh (1989). The procedure to form EAM alloy parameterization from single element potentials was suggested Johnson (1989); Zhou et al. (2001), but it does not guarantee that the resulting potential will be suitable for modeling compounds Zhou et al. (2004). Alloy potentials usually introduce new parameters for each pair of elements, allowing to fit properties of their binary compounds. The number of parameters to adjust and the number of tests to perform is proportional to the square of the number of constituent elements. In the present MEAM approach, each pair interaction is characterized by a total of 13 parameters (Table 5, and the ratio of density scaling factors for constituent elements, Table 1). Adoption of the default value C leads to 9 adjustable parameters for each pair. Comparable angularly dependent potentials for the Fe-Ni system Mishin et al. (2005) also have 9 adjustable pair parameters.
While the semiempirical potentials have been developed and tested for binary alloys Mendelev et al. (2009); Liu and Adams (1998); Apostol and Mishin (2011); Liu et al. (1999a); Mendelev et al. (2005), binaries, similarly to single element potentials, may not combine easily into ternaries. Modeling of ternary systems faces a challenge since less experimental properties are available for ternary systems. Ternary potentials are usually examined only at a particular composition range—the number of possible compositions grows to the power of the number of constituent elements. It is also nontrivial to find an equilibrium structure for complex systems of representative size at low temperatures. Ternary potentials are only available for Fe/Ni-Cr-O Ohira et al. (2001); *ohira1997:atom_adh_metalox (MEAM), Pu-Ga-He Valone et al. (2006) (MEAM), Fe-Ti-C/N, Cu-Zr-Ag, Ga-In-N, Fe-Nb-C/N Kim et al. (2009a); Kang et al. (2009); Do et al. (2009); Kim et al. (2010) (MEAM), H-C-O Chenoweth et al. (2008) (Reactive Force Field, ReaxFF), Ni-Al-H Angelo et al. (1995); *baskes1997:trap_h_ni_corr, Zr-Cu-Al Cheng et al. (2009), and Fe-Cu-Ni Bonny et al. (2009) (EAM) systems. To extend from binaries to ternaries, MEAM provides a ternary screening parameter C. In the present work we did not examine ternary systems. Instead, we performed thermal expansion simulations of a compound including all species of the potential. The default values of and were applied for ternary screening. Since an effort beyond the scope of our project is required for satisfiable validation of the 5-element alloy potential under varying temperatures, compositions, and configuration states, we concentrated on basic tests and on providing tools to facilitate reproducibility of the tests Jelinek (2011).
In the present study we develop a MEAM potential for aluminum, silicon, magnesium, copper, iron, and their combinations. We fit the potential to the properties of single elements and element pairs, but the model implicitly allows calculations with any combination of elements. We show the applied MEAM methodology in Appendix A. The DFT calculations are described in Sec. II. In Sec. III, the single-element volume-energy curves in basic crystal structures, and also important material properties, such as formation energies of vacancies, self-interstitials, surfaces, and generalized stacking fault energies from MEAM are examined and compared with DFT calculations. In Sec. IV, the MEAM potential parameters for each unlike element pair are initialized to fit the ab-initio heat of formation, equilibrium volume, and elastic moduli of the hypothetical NaCl reference structure. Heat of formation of binary compounds in a variety of crystal structures from MEAM are thereafter examined and compared with the ab-initio and experimental results. The MEAM parameters are adjusted to match the DFT formation energy of the most stable compounds. The structural and elastic properties for several binary compounds and formation energies of substitutional defects are compared with ab-initio and experimental results. Finally we performed thermal expansion simulations of a compound with the composition of an AA 6061 alloy (IV.3). We conclude with a short summary.
II Ab-initio calculations
Ab-initio total energy calculations in this work were based on density functional theory (DFT), using the projector augmented-wave (PAW) method Blöchl (1994); *kresse1999:from_us_paw as implemented in the VASP code Kresse and Hafner (1993); *Kresse:1996:VASP:PRB-69. Exchange-correlation effects were treated by the generalized gradient approximation (GGA) as parameterized by Perdew et al. (1992). All DFT calculations were performed in high precision with the plane-wave cut-off energy set to 400 eV in order to achieve the convergence of heat of formation and elastic properties. Integration over the irreducible Brillouin zone was performed using the -centered Monkhorst-Pack scheme Monkhorst and Pack (1976) with the size gradually increased to 777 for point defects, to 19191 for surfaces, and to 292929 to improve convergence of shear moduli at small strains. Elastic constants presented here were obtained without relaxation of atomic positions. Since most of the examined high energy structures are, at best, metastable, relaxation does not maintain the crystal symmetry, resulting in large energy changes and unphysical elastic constants.
III MEAM parameters for single elements
The present MEAM parameters for single elements are listed in Table 1. The initial values of these parameters were taken from existing MEAM potentials Baskes (1992); Lee et al. (2003); Jelinek et al. (2007); Lee et al. (2011). The screening parameter for Al, Mg, and Cu was lowered from 2.0 to 0.8 to improve the GSFE curves (Sec. III.5). The Mg potential was adjusted to reproduce the DFT values of hcp, bcc, and fcc energy differences, vacancy formation energy, and surface formation energy. The Al potential was modified to prevent formation of an unknown structure at elevated temperatures (Sec. IV.3).
III.1 Energy dependence on volume of single elements in fcc, hcp, bcc, and simple cubic crystal structures
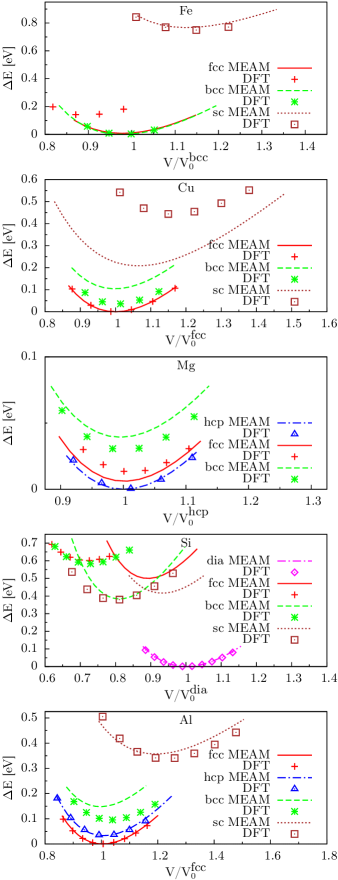
The first test of the validity of MEAM potential for single elements is a comparison of the energy-volume curves in the fcc, hcp, bcc, diamond, and simple cubic crystal structures, shown in Fig. 1. The MEAM potentials appropriately capture the lowest energy structures of Al (fcc), Si (dia), Mg (hcp), Cu (fcc), and Fe (bcc). Also, the equilibrium volumes of several crystal structures from MEAM closely match the DFT results. Better match of DFT energy differences and volume ratios can possibly be obtained by optimization of Si and Cu MEAM parameters. Fe MEAM potential applied in the present work is a MEAM-p variant of Fe potential from the recent effort of Lee et al. (2011), exhibiting a correct low temperature phase stability with respect to the pressure. The fcc equilibrium energy and volume from this Fe potential is very close to the bcc equilibrium in order for the structural transition to appear at finite temperature without magnetic contribution. In general the MEAM potentials of the present work reproduced the DFT results for the individual elements fairly well.
III.2 Vacancies
The formation energy of a single vacancy is defined as the energy cost to create a vacancy:
| (1) |
where is the total relaxed energy of a system with atoms containing a vacancy and is the energy per atom in the bulk. Cell volume and atomic positions were relaxed in each case. Table 2 shows the formation energies of a single vacancy for the fcc Al cell, diamond Si cell, hcp Mg, fcc Cu, and bcc Fe obtained from the MEAM and DFT calculations. The MEAM systems sizes were 555 primitive fcc and bcc cells, 333 primitive diamond cells, and 844 orthogonal hcp cells. For the DFT systems, the simulation sizes were 555 fcc, 444 diamond and bcc, and 442 hcp primitive cells.
The vacancy formation energy of Mg was slightly improved in comparison with previous MEAM results Jelinek et al. (2007). Overall agreement of vacancy formation energies between MEAM, experiment, and DFT was within a few eV, and the present results are comparable or better than those from other calculations. The reduction in volume due to the formation of a vacancy agrees well with the DFT, except the value for Fe is somewhat low.
| Present | Others | Exp | Present | Others | |
|---|---|---|---|---|---|
| Al | 0.67 (0.5) | 0.68111MEAM results by Lee et al. (2003)0.68222Calculated using EAM parameters extracted from Liu et al. (1997a)(0.55666DFT results by Carling et al. (2003)) | 0.67777Experimental value by Hehenkamp (1994) | 0.67 (0.7) | 0.72111MEAM results by Lee et al. (2003)0.61222Calculated using EAM parameters extracted from Liu et al. (1997a) |
| Si | 3.27 (3.6) | 3.56202020MEAM value by Ryu et al. (2009)3.67191919MEAM value by Timonova et al. (2007)(3.6333DFT calculation by Wright (2006)) | 3.6999Experimental value by Dannefaer et al. (1986); *throwe1989:search_monov_si | 0.21 (0.3) | 0.94202020MEAM value by Ryu et al. (2009) |
| Mg | 0.89 (0.7) | 0.59444AMEAM results by Hu et al. (2001)0.87222Calculated using EAM parameters extracted from Liu et al. (1997a)(0.83111111DFT value by Krimmel and Fähnle (2000)) | 0.79555Experimental results by Tzanetakis et al. (1976) | 0.72 (0.8) | 0.83444AMEAM results by Hu et al. (2001)0.87222Calculated using EAM parameters extracted from Liu et al. (1997a) |
| Cu | 1.10 (1.0) | 1.05171717EAM value by Mendelev et al. (2008)1.27181818EAM value by Mishin et al. (2001)(1.03888DFT calculation by Andersson and Simak (2004)) | 1.2101010Experimental value by Hehenkamp et al. (1992) | 0.75 (0.9) | 0.70181818EAM value by Mishin et al. (2001)0.74181818EAM value by Mishin et al. (2001) |
| Fe | 1.65 (2.1) | 1.84121212EAM value by Mendelev et al. (2003a)1.89131313Finnis-Sinclair potential value by Ackland et al. (1997)(1.95141414DFT value by Domain and Becquart (2001)) | 1.53151515Experimental value by Schaefer et al. (1977) | 0.47 (0.8) | 0.6161616Experimental value referenced in Ackland et al. (1997)(0.90141414DFT value by Domain and Becquart (2001)) |
III.3 Self-interstitials
| Interstitial | DFT | MEAM | CMD | DFT | ||
|---|---|---|---|---|---|---|
| Al | Present | Ref.Liu et al. (1997a) | Ref.Ramos de Debiaggi et al. (2006) | Ref.Purja Pun and Mishin (2009) | Ref.Sandberg et al. (2002) | |
| tetrahedral | 3.3 | 3.32 | 3.16111Calculated using parameters from the given reference. | 2.94 | ||
| octahedral | 2.8 | 3.26 | 3.06111Calculated using parameters from the given reference. | 2.82 | ||
| split (100) | 2.7 | 2.77 | 2.68111Calculated using parameters from the given reference. | 2.46 | 2.59 | 2.43 |
| Si | Present | Ref.Gillespie et al. (2007) | Ref.Tersoff (1988) | Ref.Erhart and Albe (2005) | Ref.Al-Mushadani and Needs (2003) | |
| split (110) | 3.7 | 3.71 | 3.88 | 4.7 | 3.9 | 3.40 |
| Mg | Present | Ref.Liu et al. (1997a) | Ref.Jelinek et al. (2007) | Ref.Kim et al. (2009b) | Ref.Jelinek et al. (2007) | |
| tetrahedral | 2.2 | 1.63 | 1.53111Calculated using parameters from the given reference. | 1.53 | 1.41 | 2.35 |
| octahedral | 2.2 | 1.57 | 2.16111Calculated using parameters from the given reference. | 1.29 | 1.20 | 2.36 |
| split (0001) | 2.3 | 1.78 | 1.52111Calculated using parameters from the given reference. | |||
| Cu | Present | Ref.Mendelev et al. (2008) | Ref.Mishin et al. (2001) | Ref.Mishin et al. (2001) | Ref.Mendelev et al. (2008) | |
| tetrahedral | 3.9 | 3.37 | 2.99111Calculated using parameters from the given reference. | |||
| octahedral | 3.5 | 2.72 | 2.97111Calculated using parameters from the given reference. | |||
| split (100) | 3.3 | 2.59 | 2.81 | 3.06 | 3.23 | 2.93 |
| Fe | Present | Ref.Mendelev et al. (2003b) | Ref.Dudarev and Derlet (2005) | Ref.Dudarev and Derlet (2005) | Ref.Fu et al. (2004) | |
| tetrahedral | 4.2 | 4.31 | 4.16111Calculated using parameters from the given reference. | 4.14 | ||
| octahedral | 5.0 | 4.78 | 4.19111Calculated using parameters from the given reference. | 4.82 | ||
| split (110) | 3.9 | 3.79 | 3.53 | 4.11 | 3.65 | 3.64 |
| split (111) | 4.9 | 4.28 | 4.02 | 4.01 | 4.24 | 4.34 |
| split (100) | 4.8 | 4.81 | 4.34 | 4.28 | 4.60 | 4.64 |
The formation energy of an interstitial point defect is given by
| (2) |
where is the total energy of a system with type-X bulk atoms plus one impurity atom of type-Y inserted at one of the interstitial sites, and () is the total energy per atom of type-X (type-Y) in its most stable bulk structure. The inserted atom Y can be of the same type as the bulk, in which case the point defect is called a self-interstitial defect. Self-interstitial formation energies were calculated for Al, Si, Mg, and Cu at the octahedral, tetrahedral, and dumbbell sites. Dumbbell orientations were [100] for fcc, [0001] for hcp, and [110] for bcc and diamond structures. Relaxations of the atomic positions and the volume were also performed, and the DFT and MEAM results are listed in Table 3. Similar to the previous calculations, the MEAM systems sizes were 555 primitive fcc and bcc cells, 333 primitive diamond cells, and 844 orthogonal hcp cells. For the DFT systems, the examined sizes were 555 fcc primitive cells, 444 diamond and bcc primitive cells, and 442 hcp primitive cells.
In general, the DFT results are well reproduced or slightly underestimated by the MEAM potentials. According to the present MEAM potential, the most stable form of a self-interstitial defect for fcc Al is a dumbbell along the [100] direction, in agreement with the DFT results and an experimental observation by Jesson et al. (1997). The results for Mg are better than those published previously Jelinek et al. (2007); Kim et al. (2009b). The present Mg potential indicates that the tetrahedral site will be most stable in agreement with the DFT calculations. For both Cu and Fe, the new MEAM potential produces the same relative stability of the examined interstitial sites with the DFT calculations.
III.4 Surfaces
| Surface | Rlx | DFT | MEAM | CMD | DFT | EXP | |
|---|---|---|---|---|---|---|---|
| Al | Present | Ref. Lee et al. (2003) | Ref. Liu et al. (1997a)222Calculated using parameters from the given reference. | Ref. Vitos et al. (1998) | Ref. De Boer et al. (1988) | ||
| (111) | No | 780 | 820 | 913 | 1199 | 1143 | |
| (111) | Yes | 780 | 752 | 629 | 912 | ||
| (110) | No | 990 | 1154 | 1113 | 1271 | ||
| (110) | Yes | 960 | 1135 | 948 | 1107 | ||
| (100) | No | 890 | 1121 | 1012 | 1347 | ||
| (100) | Yes | 890 | 1088 | 848 | 1002 | ||
| Si | Present | Ref. Wilson et al. (1990) | Ref. Timonova and Thijsse (2011) | Ref. Stekolnikov et al. (2002) | Ref. Eaglesham et al. (1993) | ||
| (111) | No | 1620 | 1254 | 1405 | 1820 | ||
| (111) | Yes | 1570 | 1196 | 1405 | 1740 | 1230 | |
| (100) | No | 2140 | 1850 | 2434 | 2390 | ||
| (100) | Yes | 2140 | 1743 | 1489 | 2390 | ||
| (100) | 21 | 1241 | 2050 | 1450 | 1360 | ||
| Mg | Rlx | Present | Ref. Hu et al. (2001) | Ref. Liu et al. (1997a)222Calculated using parameters from the given reference. | Ref. Vitos et al. (1998) | Ref. De Boer et al. (1988) | |
| (0001) | No | 530 | 780 | 500 | 792 | 785 | |
| (0001) | Yes | 530 | 713 | 310 | 499 | ||
| (100) | No | 850 | 878 | 629 | 782 | ||
| (100) | Yes | 850 | 859 | 316 | 618 | ||
| Cu | Present | Ref. Liu et al. (1999b)222Calculated using parameters from the given reference. | Ref. Mendelev et al. (2008)222Calculated using parameters from the given reference. | Ref. Vitos et al. (1998) | Ref. De Boer et al. (1988) | ||
| (111) | No | 1290 | 1411 | 1185 | 919 | 1952 | 1825 |
| (111) | Yes | 1290 | 1411 | 1181 | 903 | ||
| (110) | No | 1550 | 1645 | 1427 | 1177 | 2237 | |
| (110) | Yes | 1510 | 1614 | 1412 | 1153 | ||
| (100) | No | 1440 | 1654 | 1291 | 1097 | 2166 | |
| (100) | Yes | 1430 | 1653 | 1288 | 1083 | ||
| Fe | Present | Ref. Zhou et al. (2004)222Calculated using parameters from the given reference. | Ref. Mendelev et al. (2003b)222Calculated using parameters from the given reference. | Ref. Błoński and Kiejna (2007) | Ref. De Boer et al. (1988) | ||
| (111) | No | 2760 | 1366 | 1941 | 2012 | 2660 | 2475 |
| (111) | Yes | 2700 | 1306 | 1863 | 1998 | 2580 | |
| (110) | No | 2420 | 1378 | 1434 | 1651 | 2380 | |
| (110) | Yes | 2420 | 1372 | 1429 | 1651 | 2370 | |
| (100) | No | 2500 | 1233 | 1703 | 1790 | 2480 | |
| (100) | Yes | 2480 | 1222 | 1690 | 1785 | 2470 | |
A semi-infinite surface is one of the simplest forms of defects. To test the transferability of the new MEAM potentials, formation energies for several 117 surface slabs with 8 Å vacuum layer were computed. Eight atomic layers were used for the Si(111) surface and 12 layers for the 21 Si(100) surface reconstruction. The surface formation energy per unit surface area is defined as
| (3) |
where is the total energy of the structure with two surfaces, is the number of atoms in the structure, is the total energy per atom in the bulk, and is the total area of both surfaces. Table 4 shows the surface formation energies of several surfaces constructed from fcc Al, hcp Mg, fcc Cu, and bcc Fe crystals. Results from the present MEAM potentials agree, in the order of magnitude, with the DFT calculations, except for Fe values being underestimated.
The surfaces with lowest energy without reconstruction are identified correctly by the present MEAM potentials. The 21 reconstruction of the Si(100) surface leads to symmetric dimers in accord with other Si potentials Balamane et al. (1992). Note that surface formation energies from the present PAW GGA calculations are lower than our previously published results Jelinek et al. (2007) using ultrasoft pseudopotentials within local density (LDA) approximation—it is known that GGA leads to surface energies which are 7–16% lower than LDA values for jellium and 16–29% lower than the experimental resultsVitos et al. (1998); Perdew et al. (1992). A procedure Mattsson and Kohn (2001) and new DFT functionals Armiento and Mattsson (2005); Perdew et al. (2008) were suggested to correct the errors of LDA and GGA approximations. Similar correction can be applied to vacancy formation energies Mattsson et al. (2006), but such corrections were not applied in the present study.
III.5 Stacking faults
Using an assumption of a planar dislocation core, the Peierls-Nabarro modelPeierls (1940); Nabarro (1947) is a powerful theory to quantify the dislocation core properties. In that model, a dislocation is defined by a continuous distribution of shear along the glide plane, and the restoring force acting between atoms on either sides of the interface is balanced by the resultant stress of the distribution. As shown in the recent study of Carrez et al. (2009), a solution of the Peierls-Nabarro model can be obtained numerically by identifying the restoring force to the gradient of the generalized stacking fault energy (GSFE) curve Vítek (1966). In addition, Van Swygenhoven et al. (2004) claimed that the nature of slip in nanocrystalline metals cannot be described in terms of an absolute value of the stacking fault energy, and a correct interpretation requires the GSFE curve, which shows the change in energy per unit area of the crystal as a function of the displacement varied on the slip plane. However, the GSFE curve is not experimentally accessible. Therefore, to model dislocation properties reliably, the GSFE curve calculated with the MEAM potential must reproduce the DFT data.
The stacking fault energy per unit area of a stacking fault is defined as
| (4) |
where is the total energy of the structure with a stacking fault, is the number of atoms in the structure, is the total energy per atom in the bulk, and is the total area of surface.
As a validation test of the MEAM potential, the GSFE curves obtained by molecular statics (MS) were compared with the DFT data by Zimmerman et al. (2000) for Al and Cu, by the present authors for Fe, and by Datta et al. (2008) for Mg. After lowering the C parameter to 0.8, the GSFE curves calculated by MS using the MEAM potential for Al, Cu, and Mg show the skewed sinusoidal shape in agreement with the DFT predictions (Fig. 2) illustrating reasonable agreement with the DFT GSFE curves.

| X | Y | [eV] | [Å] | |||||||||
|---|---|---|---|---|---|---|---|---|---|---|---|---|
| Al | Si | 0.28 | 2.62 | 4.56 | 0.5 | 2.8 | 2.0 | 2.8 | 2.0 | 2.8 | 2.0 | 2.8 |
| Al | Mg | 0.23 | 2.87 | 4.52 | 2.0 | 2.8 | 0.0 | 2.8 | 2.0 | 2.8 | 0.0 | 2.8 |
| Al | Cu | 0.19 | 2.53 | 4.65 | 0.0 | 2.8 | 2.0 | 2.8 | 2.0 | 2.8 | 2.0 | 2.8 |
| Al | Fe | 0.26 | 2.45 | 4.64 | 0.9 | 2.8 | 0.1 | 2.8 | 2.0 | 2.8 | 2.0 | 2.8 |
| Si | Mg | 0.20 | 2.75 | 4.73 | 1.0 | 2.8 | 1.0 | 2.8 | 2.0 | 2.8 | 2.0 | 2.8 |
| Si | Cu | 0.14 | 2.46 | 4.74 | 0.0 | 2.8 | 0.0 | 2.8 | 2.0 | 2.8 | 2.0 | 2.8 |
| Si | Fe | -0.07 | 2.39 | 5.17 | 1.0 | 2.8 | 1.0 | 2.8 | 2.0 | 2.8 | 0.0 | 2.8 |
| Mg | Cu | 0.23 | 2.63 | 4.70 | 2.0 | 2.8 | 0.0 | 2.8 | 2.0 | 2.8 | 2.0 | 2.8 |
| Mg | Fe | 0.60 | 2.61 | 4.96 | 0.65 | 2.8 | 0.0 | 2.8 | 2.0 | 2.8 | 2.0 | 2.8 |
| Cu | Fe | 0.63 | 2.42 | 5.21 | 2.0 | 2.8 | 0.0 | 2.8 | 2.0 | 2.8 | 2.0 | 2.8 |
IV MEAM parameters for element pairs
The MEAM potential parameters for each element pair were initialized to match the ab-initio heat of formation, equilibrium volume, bulk modulus, and elastic moduli in the hypothetical NaCl reference structure, which was chosen for its simplicity. Since the equilibrium volume, cohesive energy, and bulk modulus of the NaCl structure are directly related to MEAM parameters, they can be reproduced exactly. An improved agreement of the shear moduli from MEAM and ab-initio simulations was achieved in some cases by adjusting the electron density scaling factor . Then, heat of formation of binary compounds in a variety of crystal structures from MEAM were examined and compared with the ab-initio results. To correlate the MEAM results with the lowest formation energies of the compounds from DFT calculations, the MEAM screening and parameters for element pairs were adjusted. The final MEAM parameters are given in Table 5. The predicted MEAM properties for the NaCl reference structure are compared with DFT results in Table 6, and show that in general the MEAM heat of formation, bulk modulus, and equilibrium volume reproduce the DFT results well. In contrast, the shear elastic constants are not well reproduced. In fact the sign of the shear elastic constant, representing crystal stability, is frequently in disagreement with the DFT results. This is really not a significant problem as the NaCl structure does not exist in nature. A more important criteria for success of these potentials is how they perform for lower energy crystal structures. We address this issue in the next section.
| pair | method | |||||
|---|---|---|---|---|---|---|
| AlSi | DFT | 0.28 | 17.9 | 76.7 | 10 | 76 |
| MEAM | 0.28 | 18.0 | 76.4 | -13 | 8 | |
| AlMg | DFT | 0.42 | 23.7 | 30.9 | -18 | 36 |
| MEAM | 0.23 | 23.6 | 33.9 | -3 | 35 | |
| AlCu | DFT | 0.19 | 16.1 | 77.5 | -18 | 52 |
| MEAM | 0.19 | 16.2 | 77.4 | -19 | 56 | |
| AlFe | DFT | 0.36 | 14.7 | 90.3 | -25 | 105 |
| MEAM | 0.26 | 14.7 | 92.7 | -27 | 109 | |
| SiMg | DFT | 0.41 | 20.9 | 50.6 | -26 | 48 |
| MEAM | 0.20 | 20.8 | 54.9 | 9 | 61 | |
| SiCu | DFT | 0.39 | 14.9 | 99.0 | -29 | 58 |
| MEAM | 0.14 | 14.9 | 105.9 | 9 | 223 | |
| SiFe | DFT | 0.25 | 12.9 | 100.9 | -70 | 112 |
| MEAM | -0.07 | 13.7 | 157.9 | 65 | 363 | |
| MgCu | DFT | 0.23 | 18.5 | 48.7 | -10 | 49 |
| MEAM | 0.23 | 18.2 | 49.6 | -1 | 61 | |
| MgFe | DFT | 0.86 | 17.7 | 50.4 | -23 | 83 |
| MEAM | 0.60 | 17.8 | 56.5 | -17 | 62 | |
| CuFe | DFT | 0.78 | 14.1 | 107.4 | -23 | 134 |
| MEAM | 0.63 | 14.2 | 111.8 | 10 | 131 |
IV.1 Heat of formation for binary compounds
The alloy phases that the MEAM potential predicts as most likely to form at the temperature K are those with the lowest heat of formation per atom, , which is defined as
| (5) |
is the total energy of the simulation cell, and are the numbers of type-X and type-Y atoms in the cell, and are the total energies per atom for type-X and type-Y in their ground state bulk structures, respectively.
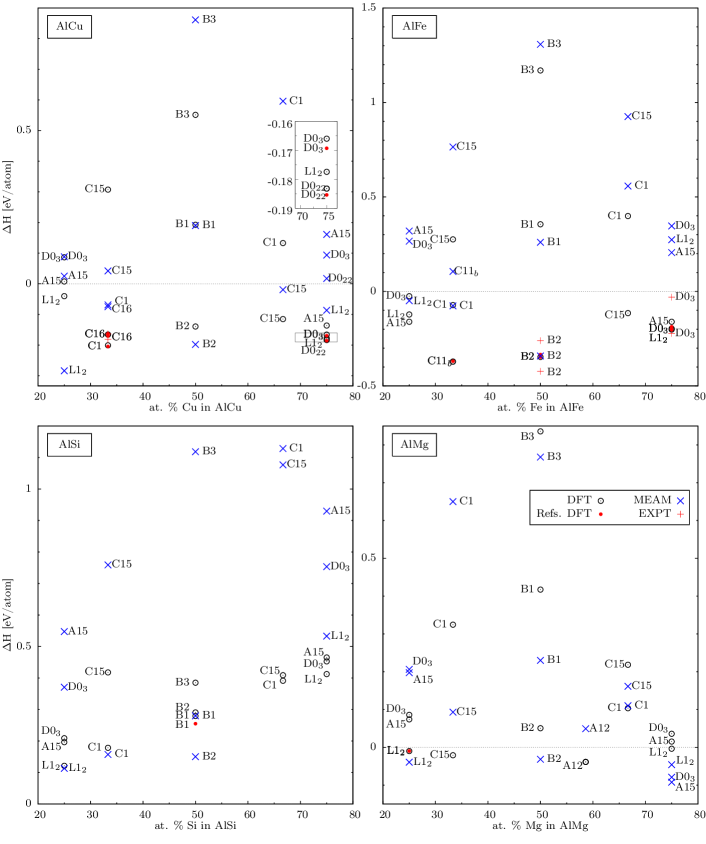
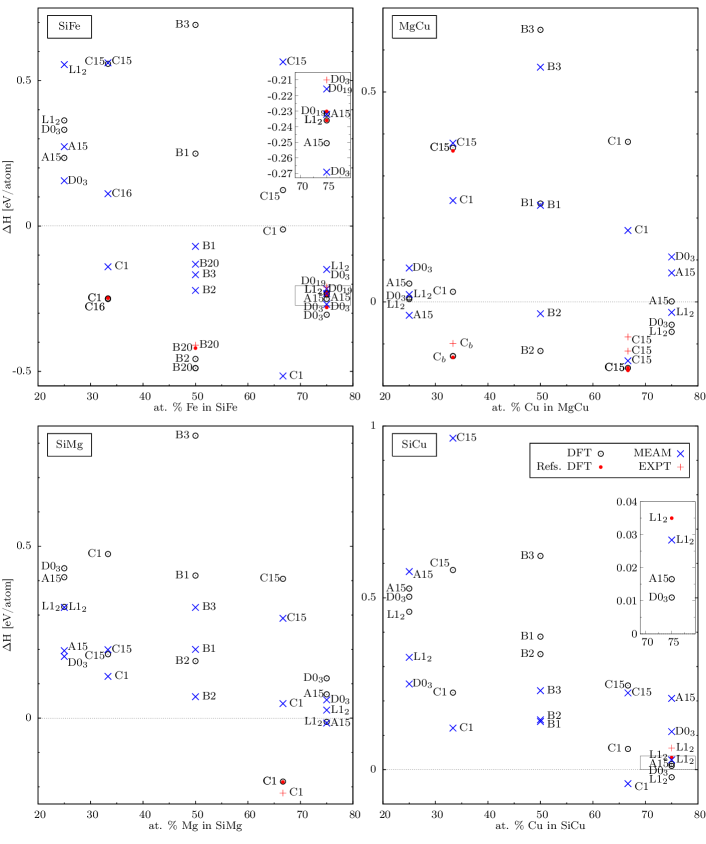
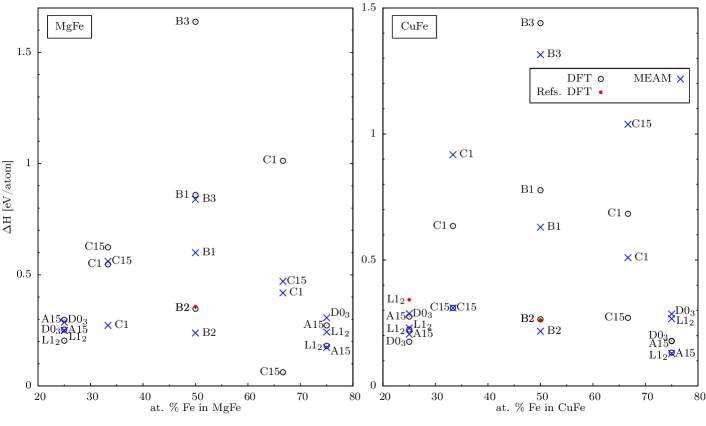
To check the validity of our new potentials, we computed the heat of formation per atom for many intermetallic phases of all alloy pairs. The total energy values in Eq. (5) for B1, B2, B3, C1, C15, D0, A15, L1, and other relevant structures were evaluated at the optimal atomic volume for each structure. Heat of formation for basic binary compounds based on the new MEAM potential and DFT results were calculated and compared with experimental values (Figures 3–5). The DFT and MEAM results for the phases with lowest are also shown in Tables IV.1–IV.1.
The agreement between MEAM and DFT is quite satisfactory. In most cases, the MEAM results preserve the order of stability predicted by the DFT results. The differences in the heat of formation per atom from the MEAM and DFT results are less than 0.5 eV at most. In general the atomic volumes predicted by MEAM agree at least qualitatively with the DFT and experimental results. The MEAM calculations of the bulk moduli also agree semi-quantitatively with DFT and experimental results, usually within 20%. Predicted shear moduli usually follow the DFT and experimental results, but in some cases there is significant disagreement.
| Host | Substitute atom | ||||
|---|---|---|---|---|---|
| Al | Si | Mg | Cu | Fe | |
| Al | 0.5 (0.5) | 0.2 (0.05) | 1.1 (0.1) | 1.3 (0.4) | |
| Si | 7.0 (0.9) | 2.9 (2.4) | 1.9 (2.) | 1.6 (1.9) | |
| Mg | 0.7 (0.06) | 0.2 (0.4) | 0.2 (0.2) | 1.5 (1.1) | |
| Cu | 0.7 (0.7) | 0.8 (0.2) | 1.1 (0.2) | 2.9 (1.4) | |
| Fe | 0.2 (0.7) | 2.9 (1.1) | 0.8 (1.0) | 0.3 (0.8) | |
| compos. | str. | met. | |||||
|---|---|---|---|---|---|---|---|
| AlSi | L1 | DFT | 121 | 16.04 | 74.3 | 24.1 | 9.4 |
| MEAM/EAM | 113 | 16.67 | 96.7 | 31.2 | 31.2 | ||
| AlSi | C1 | DFT | 178 | 18.78 | 62.9 | 25.4 | 11.8 |
| MEAM/EAM | 157 | 19.17 | 73.6 | 15.3 | 0.0 | ||
| AlSi | B2 | DFT | 291 | 15.91 | 78.8 | 22.4 | 32.8 |
| MEAM/EAM | 150 | 16.25 | 102.1 | 29.1 | 17.0 |
AlMg & A12 DFT 39, 35Narasimhan and Davenport (1995), 37Zhong et al. (2005), 48Wang et al. (2008) 20.12, 18.65Narasimhan and Davenport (1995), 20.04Zhong et al. (2005), 20.25Wang et al. (2008) 50.1, 49.6Wang et al. (2008) 20.0Wang et al. (2008) 28.9Wang et al. (2008) MEAM/EAM 49, 19Kim et al. (2009c), 36Liu et al. (1997b) 21.28, 20.30Kim et al. (2009c) 49.6Kim et al. (2009c) 11.5Kim et al. (2009c) 23.9Kim et al. (2009c) EXP 34Murray (1982) 20.13Villars and Calvert (1985), 20.30Singh et al. (2003)
AlMg L1 DFT 10, 15Narasimhan and Davenport (1995), 9Mendelev et al. (2009) 17.80, 16.52Narasimhan and Davenport (1995), 17.78Mendelev et al. (2009) 63.3 35.3 31.9 MEAM/EAM 39, 2Mendelev et al. (2009) 19.04, 17.54Mendelev et al. (2009) 62.7 33.3 14.7
AlMg L1 DFT 4, 5Narasimhan and Davenport (1995), 3Mendelev et al. (2009) 20.98, 19.18Narasimhan and Davenport (1995), 19.89Mendelev et al. (2009) 43.9 25.2 22.6 MEAM/EAM 46, 21Mendelev et al. (2009) 21.99, 20.98Mendelev et al. (2009) 45.0 24.9 13.8
AlMg B2 DFT 51, 50Narasimhan and Davenport (1995), 51Narasimhan and Davenport (1995) 19.50, 18.00Narasimhan and Davenport (1995), 19.48Narasimhan and Davenport (1995) 47.9 38.4 7.5 MEAM/EAM 32, 90Narasimhan and Davenport (1995) 20.29, 19.57Narasimhan and Davenport (1995) 50.6 32.9 8.9
AlCu C16 DFT 166, 170Mihalkovic and Widom (2009), 166Ravi and Wolverton (2005), 163Ravi et al. (2006) 14.95, 14.89Ravi et al. (2006) 96.3 MEAM/EAM 75 15.80 EXP 161Fries and Jantzen (1998) 14.90Ravi et al. (2006)
C1 DFT 201, 202Ravi et al. (2006), 204Mihalkovic and Widom (2009) 16.14, 16.12Ravi et al. (2006) 93.1 81.6 46.0 MEAM/EAM 69 17.31 77.4 43.2 7.7 EXP 15.63Ravi et al. (2006)
AlCu D0 DFT 183, 185Mihalkovic and Widom (2009) 12.52 128.1 MEAM/EAM 17 13.08
L1 DFT 177, 219Liu (1997) 12.59 128.4 81.1 13.8 MEAM/EAM 87, 229Liu (1997) 13.47 131.9 72.4 26.8
D0 DFT 166, 169Mihalkovic and Widom (2009) 12.60 127.9 98.4 1.1 MEAM/EAM 94 12.34 107.8 88.7 4.9
A15 DFT 136 12.77 124.7 34.5 102.8 MEAM/EAM 161 13.48 111.6 200.5 92.8
AlCu L1 DFT 40 15.22 89.9 23.4 61.5 MEAM/EAM 284 14.58 106.0 40.3 41.2
AlCu B2 DFT 139 13.45 108.6 31.4 15.4 MEAM/EAM 198 14.15 109.2 56.7 2.8
AlFe B2 DFT 347, 347Mihalkovic and Widom (2009), 334Maugis et al. (2006), 379Gonzales-Ormeño et al. (2002), 420Watson and Weinert (1998), 400Kulikov et al. (1999), 338Friák and Neugebauer (2010), 311Lechermann et al. (2005), 1500Shaojun et al. (1998) 11.86, 11.88Maugis et al. (2006), 12.07Gonzales-Ormeño et al. (2002), 11.33Fu and Yoo (1992), 11.22Watson and Weinert (1998), 11.65Kulikov et al. (1999), 11.89Friák and Neugebauer (2010), 11.93Lechermann et al. (2005), 12.19Shaojun et al. (1998) 174.6, 177.0Maugis et al. (2006), 183.0Fu and Yoo (1992), 155.0Lechermann et al. (2005), 156.0Shaojun et al. (1998) 138.8, 165.0Fu and Yoo (1992), 107.0Shaojun et al. (1998) 61.8, 80.0Fu and Yoo (1992), 38.1Shaojun et al. (1998) MEAM/EAM 342, 298Lee and Lee (2010), 260Besson and Morillo (1997), 106SHU et al. (2001) 12.88, 12.32Vailhé and Farkas (1997), 13.92SHU et al. (2001), 11.45Zhang et al. (1997) 145.3, 144.0Vailhé and Farkas (1997), 138.0SHU et al. (2001), 193.0Zhang et al. (1997) 111.7, 117.0Vailhé and Farkas (1997), 110.7SHU et al. (2001) 79.6, 18.0Vailhé and Farkas (1997), 7.9SHU et al. (2001) EXP 260Kubaschewski and Dench (1955), 423Desai (1987), 250Hultgren et al. (1973), 280Gale et al. (2004) 12.23Pearson (1958) 152.0Yoo et al. (1990), 136.0Simmons and Wang (1971) 127.0Yoo et al. (1990), 127.1Simmons and Wang (1971) 43.0Yoo et al. (1990), 33.7Simmons and Wang (1971)
AlFe D0 DFT 202, 203Mihalkovic and Widom (2009), 200Maugis et al. (2006), 221Gonzales-Ormeño et al. (2002), 230Watson and Weinert (1998), 202Friák and Neugebauer (2010), 201Lechermann et al. (2005), 1860Shaojun et al. (1998) 11.79, 11.81Maugis et al. (2006), 12.01Gonzales-Ormeño et al. (2002), 14.65Watson and Weinert (1998), 11.82Friák and Neugebauer (2010), 12.09Lechermann et al. (2005), 11.57Shaojun et al. (1998) 160.0, 174.0Maugis et al. (2006), 151.0Lechermann et al. (2005), 170.0Shaojun et al. (1998) 140.0, 137.5Shaojun et al. (1998) 25.5, 10.8Shaojun et al. (1998) MEAM/EAM 346, 206Lee and Lee (2010), 222Besson and Morillo (1997), 74SHU et al. (2001) 12.01, 11.77Besson and Morillo (1997), 12.86SHU et al. (2001), 10.80Zhang et al. (1997) 137.5, 146.0SHU et al. (2001), 229.0Zhang et al. (1997) 129.0, 162.0Besson and Morillo (1997), 126.3SHU et al. (2001) 30.0, 53.0Besson and Morillo (1997), 12.6SHU et al. (2001) EXP 202Hultgren et al. (1973), 321Desai (1987) 12.07Pearson (1958) 144.0Simmons and Wang (1971) 131.7Simmons and Wang (1971) 20.2Simmons and Wang (1971)
L1 DFT 196, 187Mihalkovic and Widom (2009), 200Maugis et al. (2006), 40Watson and Weinert (1998), 222Lechermann et al. (2005) 12.13, 12.14Maugis et al. (2006), 14.14Watson and Weinert (1998), 12.35Lechermann et al. (2005) 166.3, 158.0Maugis et al. (2006), 168.0Lechermann et al. (2005) 125.1 11.5 MEAM/EAM 274, 180Lee and Lee (2010) 12.88 139.5 96.9 84.0
A15 DFT 161 12.08 156.9 67.3 135.1 MEAM/EAM 205 12.59 166.7 35.5 153.5
AlFe C15 DFT 115, 60Watson and Weinert (1998) 12.42, 11.43Watson and Weinert (1998) 130.2 55.0 52.2 MEAM/EAM 925 13.67 127.8 259.2 551.0
AlFe A15 DFT 161 13.91 121.5 67.7 120.0 MEAM/EAM 321 15.03 103.5 1.8 66.6
L1 DFT 122, 150Watson and Weinert (1998), 105Lechermann et al. (2005) 13.68, 13.07Watson and Weinert (1998), 13.69Lechermann et al. (2005) 126.5, 98.8Lechermann et al. (2005) 85.9 49.9 MEAM/EAM 49 14.83 108.5 59.4 20.3
D0 DFT 25, 99Gonzales-Ormeño et al. (2002), 13Lechermann et al. (2005) 13.38, 13.57Gonzales-Ormeño et al. (2002), 13.35Lechermann et al. (2005) 126.0, 119.6Lechermann et al. (2005) 91.4 48.3 MEAM/EAM 266 14.81 93.8 57.7 31.1
AlFe C11 DFT 371, 420Watson and Weinert (1998) 12.78, 12.35Watson and Weinert (1998), 12.80Krajčí and Hafner (2002) 149.0 MEAM/EAM 106 14.71
C1 DFT 72 15.25 98.6 76.8 55.0 MEAM/EAM 76 16.12 90.4 47.5 36.4
| compos. | str. | met. | |||||
| SiMg | C1 | DFT | 185, 186Ravi and Wolverton (2005) | 21.41 | 54.1 | 47.6 | 47.3 |
| MEAM/EAM | 42 | 23.05 | 47.8 | 20.9 | 32.2 | ||
| EXP | 225Fries and Jantzen (1998) | ||||||
| SiMg | L1 | DFT | 11 | 19.29 | 50.8 | 29.9 | 37.1 |
| MEAM/EAM | 24 | 20.70 | 57.5 | 23.5 | 21.8 | ||
| A15 | DFT | 69 | 20.09 | 44.1 | 9.3 | 31.8 | |
| MEAM/EAM | 14 | 21.25 | 56.3 | 32.2 | 33.9 |
SiCu & L1 DFT 22, 35Solares (2006) 12.18 137.3 65.0 38.1 MEAM/EAM 28 13.37 134.9 64.4 33.0 EXP 63Meschel and Kleppa (1991)
SiCu C1 DFT 60 14.26 111.9 76.3 23.1 MEAM/EAM 41 14.81 102.8 97.9 16.2
SiFe B20 DFT 489, 484Mihalkovic and Widom (2009), 420Moroni et al. (1999) 11.04 226.5 MEAM/EAM 132 13.11 EXP 410Moroni et al. (1999)
B2 DFT 457 10.55 231.9 87.0 155.8 MEAM/EAM 222 13.09 177.7 36.2 225.3
SiFe D0 DFT 305, 315Mihalkovic and Widom (2009), 280Moroni et al. (1999) 10.99 204.5 142.4 54.5 MEAM/EAM 269 12.03 169.2 91.6 36.6 EXP 210Moroni et al. (1999)
A15 DFT 251 11.44 173.3 72.3 125.3 MEAM/EAM 232 12.28 190.1 47.6 119.9
L1 DFT 236, 236Mihalkovic and Widom (2009) 11.38 188.4 116.0 26.6 MEAM/EAM 149 11.80 188.6 65.1 135.8
D0 DFT 232, 230Mihalkovic and Widom (2009) 11.28 160.1 MEAM/EAM 216 12.05
SiFe C1 DFT 249, 248Mihalkovic and Widom (2009) 13.05 169.4 136.8 15.5 MEAM/EAM 140 15.53 158.7 95.7 41.3
C16 DFT 251, 248Mihalkovic and Widom (2009) 12.39 170.6 MEAM/EAM 111 13.64
SiFe C1 DFT 12 12.95 159.6 82.6 1.4 MEAM/EAM 516 12.95 182.4 154.6 226.8
MgCu C DFT 129, 131Mihalkovic and Widom (2009), 132Bailey et al. (2004), 137Zhou et al. (2007) 18.13 57.1 EXP 99King and Kleppa (1964)
MgCu C15 DFT 157, 160Mihalkovic and Widom (2009), 163Zhou et al. (2007), 157Bailey et al. (2004) 14.58 90.6 45.4 25.2 MEAM/EAM 140 14.50 104.7 21.5 12.0 EXP 117King and Kleppa (1964), 83Predel and Ruge (1972)
MgCu B2 DFT 117 15.65 69.3 60.3 16.9 MEAM/EAM 28 15.56 73.6 51.1 11.6
MgCu L1 DFT 71 13.49 96.6 62.6 21.5 MEAM/EAM 25 13.81 103.9 42.5 29.0
D0 DFT 54 13.52 96.5 75.2 0.3 MEAM/EAM 107 13.43 95.7 64.1 22.4
MgFe C15 DFT 62 13.58 91.4 72.0 53.4 MEAM/EAM 471 14.79 95.8 322.9 605.7
MgFe L1 DFT 181 13.11 122.6 96.9 14.0 MEAM/EAM 243 13.65 116.4 64.5 45.5
MgFe L1 DFT 204 18.29 51.6 52.1 18.9 MEAM/EAM 249 19.08 54.5 30.0 23.1
MgFe B2 DFT 347, 357Mihalkovic and Widom (2009) 15.39 71.4 68.7 25.4 MEAM/EAM 238 15.82 86.4 63.2 13.7
CuFe L1 DFT 133 11.73 132.5 99.9 6.8 MEAM/EAM 267 11.78 172.6 80.5 68.0
A15 DFT 178 11.95 137.6 54.2 134.7 MEAM/EAM 129 12.26 192.3 70.5 155.2
CuFe D0 DFT 175 12.10 139.2 105.5 2.0 MEAM/EAM 287 11.59 134.0 130.8 20.7
L1 DFT 224, 342Mihalkovic and Widom (2009) 12.16 135.2 60.7 0.0 MEAM/EAM 230 12.01 153.2 66.7 71.7
CuFe B2 DFT 264, 262Mihalkovic and Widom (2009) 11.88 211.4 108.7 52.0 MEAM/EAM 217 12.10 161.7 105.6 45.7
IV.2 Substitutions
The formation energy of a substitutional point defect , in the case of the substitution of a type-X atom of the host with a type-Y atom, is defined by
| (6) |
where is the total energy of a system of host type-X atoms and one type-Y atom that replaced type-X atom in the original bulk position, and are the total energies per atom for type-X and type-Y atoms in their ground state bulk structures. Table 7 shows the results of substitutional defect calculations using the MEAM potentials and the DFT results. In general the MEAM results qualitatively agree with the DFT results. In a number of cases of small heat of formation, MEAM indicates a small heat, but of the incorrect sign. The most significant error is for Al in Si where MEAM predicts a large endothermic heat and DFT predicts a much smaller value, otherwise there is general agreement.
IV.3 Finite temperature tests
| Limits | Model [wt. %] | ||
|---|---|---|---|
| Element | low [wt. %] | high [wt. %] | |
| Si | 0.40 | 0.8 | 0.51 |
| Mg | 0.8 | 1.2 | 1.00 |
| Cu | 0.15 | 0.40 | 0.30 |
| Fe | no | 0.7 | 0.50 |
| Mn | no | 0.15 | 0.00 |
| Cr | 0.04 | 0.35 | 0.00 |
| Zn | no | 0.25 | 0.00 |
| Ti | no | 0.15 | 0.00 |
Real life applications of MD potentials require extensive testing at finite temperatures. Basic finite temperature tests of the potentials, in accord with recommendations of Lee et al. (2010), revealed formation of an unknown solid structure when the temperature of fcc Al crystal was increased to 800 K under zero pressure conditions. To prevent formation of this structure, and parameters of Al were adjusted. Heating of other elements under zero pressure conditions did not result in forming new structures.
To test a system including all components of the new potential, an 20–100 C average thermal expansion coefficient of a model system with the composition similar to AA 6061 alloy (Table 10) was evaluated and compared with experimental data. Atoms of constituents were placed in the substitutional positions of a 20x20x20 fcc Al cell. The system was heated from -200 C to 20 C (and 100 C) over the interval of 0.1 ns, and then equilibrated at 20 C (and 100 C) for 1 ns under zero pressure conditions. Table 11 shows the values of 20–100 C average thermal expansion coefficients. The MEAM result for single crystal Al is in the lower range of other MD potentials and experiments. Since Al is a dominant element of the AA 6061 alloy, the thermal expansion coefficient for alloy is similarly underestimated, possibly also due to imperfections of the structure of the real material.
. CMD Exp present Ref. (Chu and Steeves, 2011) Ref. (Wilson, 1941) Ref. (Davis, 1998) Al fcc 14.4 15-25 25.4 23.6 AA 6061 14.6 23.6
V Conclusions
In this study we developed MEAM potentials for the pair combinations of aluminum, silicon, magnesium, copper, and iron. The MEAM formalism allows any of these potentials to be combined to enable prediction of multi-component alloy properties. These potentials reproduce a large body of elemental and binary properties from DFT calculations at the temperature of 0 K and experimental results. Basic finite temperature tests of the single element potentials and their alloy combinations were also performed. With focus to facilitate reproducibility of the presented results Jelinek (2011), and subject to further testing and improvements, these potentials are one step towards designing multi-component alloys by simulations.
Acknowledgment
The authors are grateful to the Center for Advanced Vehicular Systems at Mississippi State University for supporting this study. Computer time allocation has been provided by the High Performance Computing Collaboratory (HPC) at Mississippi State University. Computational package lammps (Plimpton, 1995) with ASE (Bahn and Jacobsen, 2002) interface was used to perform MD simulations. Much appreciated tests of the new MEAM potentials, including the high temperature simulations of Al that revealed formation of unknown Al phase at 800 K, were performed by Chandler Becker and Tanner Hamann at the Metallurgy Division of the Material Measurement Laboratory, National Institute of Standards and Technology (NIST). Comparison of ab-initio elastic constants and related discussion with Hannes Schweiger from Materials Design are also appreciated. Classical MD potentials from other authors examined in this study were downloaded from the Interatomic Potentials Repository Project database Becker (2011).
Sandia National Laboratories is a multi-program laboratory managed and operated by Sandia Corporation, a wholly owned subsidiary of Lockheed Martin Corporation, for the U.S. Department of Energy’s National Nuclear Security Administration under contract DE-AC04-94AL85000.
Appendix A MEAM theory
The total energy of a system of atoms in the MEAM Baskes (1992) is approximated as the sum of the atomic energies
| (7) |
The energy of atom consists of the embedding energy and the pair potential terms:
| (8) |
is the embedding function, is the background electron density at the site of atom , and is the pair potential between atoms and separated by a distance . The embedding energy represents the energy cost to insert atom at a site where the background electron density is . The embedding energy is given in the form
| (9) |
where the sublimation energy and parameter depend on the element type of atom . The background electron density is given by
| (10) |
where
| (11) |
and
| (12) |
The zeroth and higher order densities, , , , and are given in Eqs. (15). The composition-dependent electron density scaling is given by
| (13) |
where is an element-dependent density scaling, is the first nearest-neighbor coordination of the reference system, and is given by
| (14) |
where is the shape factor that depends on the reference structure for atom . Shape factors for various structures are specified in the work of Baskes (1992). The partial electron densities are given by
| (15a) | |||||
| (15b) | |||||
| (15c) | |||||
| (15d) | |||||
where is the component of the displacement vector from atom to atom . is the screening function between atoms and and is defined in Eqs. (22). The atomic electron densities are computed as
| (16) |
where is the nearest-neighbor distance in the single-element reference structure and is element-dependent parameter. Finally, the average weighting factors are given by
| (17) |
where is an element-dependent parameter.
The pair potential is given by
| (18) | ||||
| (19) | ||||
| (20) | ||||
| (21) | ||||
where , and are element-dependent parameters and depends upon the structure of the reference system. The background densities in Eq. (19) are the densities for the reference structure computed with interatomic spacing .
The screening function is designed so that if atoms and are unscreened and within the cutoff radius , and if they are completely screened or outside the cutoff radius. It varies smoothly between 0 and 1 for partial screening. The total screening function is the product of a radial cutoff function and three body terms involving all other atoms in the system:
| (22a) | ||||
| (22b) | ||||
| (22c) | ||||
| (22d) | ||||
| (22e) | ||||
Note that and can be defined separately for each -- triplet, based on their element types. The parameter controls the distance over which the radial cutoff is smoothed from 1 to 0 near .
Appendix B Equilibrium lattice parameter and bulk modulus
MEAM postulates the Rose universal equation of stateRose et al. (1984)
| (23) |
for the reference structure of each single element and for each element pair. The , scaled distance from the equilibrium nearest neighbor position , is
| (24) |
Two parameters may be specified for each element/pair: for negative, and for positive . Then
| (25) |
The MEAM potential parameter is related to the equilibrium atomic volume , the bulk modulus , and the cohesive energy of the reference structure as follows
| (26) |
The DFT equilibrium energies and bulk moduli were obtained by fitting energy-volume dependence to Murnaghan equation of state Murnaghan (1944)
Appendix C Trigonal and tetragonal shear modulus
For small deformations of a cubic crystal, the change of energy density due to straining is
| (28) | |||||
where are strains in modified Voigt notation.
The trigonal shear modulus was determined from rhombohedral deformation given by and in 28, leading to
| (29) |
The tetragonal shear modulus was determined from the deformation given by in 28, leading to
| (30) |
References
- Horstemeyer (2010) M. F. Horstemeyer, in Pract. Aspects Comput. Chem., edited by J. Leszczynski and M. K. Shukla (Springer Netherlands, 2010) pp. 87–135.
- Daw and Baskes (1983) M. S. Daw and M. I. Baskes, Phys. Rev. Lett. 50, 1285 (1983).
- Daw and Baskes (1984) M. S. Daw and M. I. Baskes, Phys. Rev. B 29, 6443 (1984).
- Baskes (1987) M. I. Baskes, Phys. Rev. Lett. 59, 2666 (1987).
- Daw (1989) M. S. Daw, Phys. Rev. B 39, 7441 (1989).
- Baskes et al. (1989) M. I. Baskes, J. S. Nelson, and A. F. Wright, Phys. Rev. B 40, 6085 (1989).
- Baskes (1992) M. I. Baskes, Phys. Rev. B 46, 2727 (1992).
- Baskes et al. (1994) M. I. Baskes, J. E. Angelo, and C. L. Bisson, Modell. Simul. Mater. Sci. Eng. 2, 505 (1994).
- Gall et al. (2000) K. Gall, M. F. Horstemeyer, M. van Schilfgaarde, and M. I. Baskes, J. Mech. Phys. Solids. 48, 2183 (2000).
- Lee and Baskes (2000) B.-J. Lee and M. I. Baskes, Phys. Rev. B 62, 8564 (2000).
- Huang et al. (1995) H. Huang, N. M. Ghoniem, J. K. Wong, and M. I. Baskes, Modell. Simul. Mater. Sci. Eng. 3, 615 (1995).
- Baskes (1997) M. I. Baskes, Mater. Chem. Phys. 50, 152 (1997).
- Baskes (1999) M. I. Baskes, Mater. Sci. Eng. A 261, 165 (1999).
- Lee et al. (2003) B.-J. Lee, J.-H. Shim, and M. I. Baskes, Phys. Rev. B 68, 144112 (2003).
- Hu et al. (2001) W. Hu, B. Zhang, B. Huang, F. Gao, and D. J. Bacon, J. Phys.: Condens. Matter 13, 1193 (2001).
- Hu et al. (2003) W. Hu, H. Deng, X. Yuan, and M. Fukumoto, Eur. Phys. J. B 34, 429 (2003).
- Lee and Lee (2005) B.-J. Lee and J. W. Lee, Calphad 29, 7 (2005).
- Lee et al. (2010) B.-J. Lee, W.-S. Ko, H.-K. Kim, and E.-H. Kim, Calphad 34, 510 (2010).
- Kang and Cai (2007) K. Kang and W. Cai, Philos. Mag. 87, 2169 (2007).
- Gates et al. (2005) T. S. Gates, G. M. Odegard, S. J. V. Frankland, and T. C. Clancy, Compos. Sci. Technol. 65, 2416 (2005).
- Noronha and Farkas (2002) S. J. Noronha and D. Farkas, Phys. Rev. B 66, 132103 (2002).
- Martínez et al. (2008) E. Martínez, J. Marian, A. Arsensil, M. Victoria, and J. Perlado, J. Mech. Phys. Solids. 56, 869 (2008).
- Potirniche et al. (2006) G. P. Potirniche, M. F. Horstemeyer, G. J. Wagner, and P. M. Gullett, Int. J. Plast. 22, 257 (2006).
- Van Swygenhoven et al. (2004) H. Van Swygenhoven, P. M. Derlet, and A. G. Frøseth, Nat. Mater. 3, 399 (2004).
- Johnson and Oh (1989) R. A. Johnson and D. J. Oh, J. Mater. Res. 4, 1195 (1989).
- Johnson (1989) R. A. Johnson, Phys. Rev. B 39, 12554 (1989).
- Zhou et al. (2001) X. W. Zhou, H. N. G. Wadley, R. A. Johnson, D. J. Larson, N. Tabat, A. Cerezo, A. K. Petford-Long, G. D. W. Smith, P. H. Clifton, R. L. Martens, and T. F. Kelly, Acta Mater. 49, 4005 (2001).
- Zhou et al. (2004) X. W. Zhou, R. A. Johnson, and H. N. G. Wadley, Phys. Rev. B 69, 144113 (2004).
- Mishin et al. (2005) Y. Mishin, M. J. Mehl, and D. A. Papaconstantopoulos, Acta Mater. 53, 4029 (2005).
- Mendelev et al. (2009) M. I. Mendelev, M. Asta, M. J. Rahman, and J. J. Hoyt, Philos. Mag. 89, 3269 (2009).
- Liu and Adams (1998) X. Y. Liu and J. B. Adams, Acta Mater. 46, 3467 (1998).
- Apostol and Mishin (2011) F. Apostol and Y. Mishin, Phys. Rev. B 83, 054116 (2011).
- Liu et al. (1999a) X.-Y. Liu, C.-L. Liu, and L. J. Borucki, Acta Mater. 47, 3227 (1999a).
- Mendelev et al. (2005) M. I. Mendelev, D. J. Srolovitz, G. J. Ackland, and S. Han, J. Mater. Res. 20, 208 (2005).
- Ohira et al. (2001) T. Ohira, Y. Inoue, K. Murata, and J. Murayama, Appl. Surf. Sci. 171, 175 (2001).
- Ohira and Inoue (1997) T. Ohira and Y. Inoue, in MRS Proceedings, Vol. 492 (1997) pp. 401–406.
- Valone et al. (2006) S. M. Valone, M. I. Baskes, and R. L. Martin, Phys. Rev. B 73, 214209 (2006).
- Kim et al. (2009a) H.-K. Kim, W.-S. Jung, and B.-J. Lee, Acta Mater. 57, 3140 (2009a).
- Kang et al. (2009) K.-H. Kang, I. Sa, J.-C. Lee, E. Fleury, and B.-J. Lee, Scr. Mater. 61, 801 (2009).
- Do et al. (2009) E. C. Do, Y.-H. Shin, and B.-J. Lee, J. Phys.: Condens. Matter 21, 325801 (2009).
- Kim et al. (2010) H.-K. Kim, W.-S. Jung, and B.-J. Lee, J. Mater. Res. 25, 1288 (2010).
- Chenoweth et al. (2008) K. Chenoweth, A. C. T. van Duin, and W. A. Goddard, J. Phys. Chem. A 112, 1040 (2008).
- Angelo et al. (1995) J. E. Angelo, N. R. Moody, and M. I. Baskes, Modell. Simul. Mater. Sci. Eng. 3, 289 (1995).
- Baskes et al. (1997) M. I. Baskes, X. Sha, J. E. Angelo, and N. R. Moody, Modell. Simul. Mater. Sci. Eng. 5, 651 (1997).
- Cheng et al. (2009) Y. Q. Cheng, E. Ma, and H. W. Sheng, Phys. Rev. Lett. 102, 245501 (2009).
- Bonny et al. (2009) G. Bonny, R. C. Pasianot, N. Castin, and L. Malerba, Philos. Mag. 89, 3531 (2009).
- Jelinek (2011) B. Jelinek, “ASE Atomistic Potential Tests,” http://code.google.com/p/ase-atomistic-potential-tests (2011).
- Blöchl (1994) P. E. Blöchl, Phys. Rev. B 50, 17953 (1994).
- Kresse and Joubert (1999) G. Kresse and D. Joubert, Phys. Rev. B 59, 1758 (1999).
- Kresse and Hafner (1993) G. Kresse and J. Hafner, Phys. Rev. B 47, 558 (1993).
- Kresse and Furthmüller (1996) G. Kresse and J. Furthmüller, Phys. Rev. B 54, 11169 (1996).
- Perdew et al. (1992) J. P. Perdew, J. A. Chevary, S. H. Vosko, K. A. Jackson, M. R. Pederson, D. J. Singh, and C. Fiolhais, Phys. Rev. B 46, 6671 (1992).
- Monkhorst and Pack (1976) H. J. Monkhorst and J. D. Pack, Phys. Rev. B 13, 5188 (1976).
- Jelinek et al. (2007) B. Jelinek, J. Houze, S. Kim, M. F. Horstemeyer, M. I. Baskes, and S.-G. Kim, Phys. Rev. B 75, 054106 (2007).
- Lee et al. (2011) T. Lee, M. I. Baskes, S. M. Valone, and J. D. Doll, “Atomistic modeling of thermodynamic equilibrium and polymorphism of iron,” (2011), Los Alamos Preprint: LA-UR 11-03286.
- Liu et al. (1997a) X.-Y. Liu, P. Ohotnicky, J. Adams, C. Rohrer, and R. Hyland, Surf. Sci. 373, 357 (1997a).
- Wright (2006) A. F. Wright, Phys. Rev. B 74, 165116 (2006).
- Tzanetakis et al. (1976) P. Tzanetakis, J. Hillairet, and G. Revel, Phys. Status Solidi B 75, 433 (1976).
- Carling et al. (2003) K. M. Carling, G. Wahnström, T. R. Mattsson, N. Sandberg, and G. Grimvall, Phys. Rev. B 67, 054101 (2003).
- Hehenkamp (1994) T. Hehenkamp, J. Phys. Chem. Solids 55, 907 (1994).
- Andersson and Simak (2004) D. A. Andersson and S. I. Simak, Phys. Rev. B 70, 115108 (2004).
- Dannefaer et al. (1986) S. Dannefaer, P. Mascher, and D. Kerr, Phys. Rev. Lett. 56, 2195 (1986).
- Throwe et al. (1989) J. Throwe, T. C. Leung, B. Nielsen, H. Huomo, and K. G. Lynn, Phys. Rev. B 40, 12037 (1989).
- Hehenkamp et al. (1992) T. Hehenkamp, W. Berger, J.-E. Kluin, C. Lüdecke, and J. Wolff, Phys. Rev. B 45, 1998 (1992).
- Krimmel and Fähnle (2000) H. Krimmel and M. Fähnle, Phys. Rev. B 62, 5489 (2000).
- Mendelev et al. (2003a) M. I. Mendelev, D. J. Srolovitz, G. J. Ackland, D. Y. Sun, and M. Asta, Philos. Mag. 83, 3977 (2003a).
- Ackland et al. (1997) G. J. Ackland, D. J. Bacon, A. F. Calder, and T. Harry, Philos. Mag. A 75, 713 (1997).
- Domain and Becquart (2001) C. Domain and C. S. Becquart, Phys. Rev. B 65, 024103 (2001).
- Schaefer et al. (1977) H.-E. Schaefer, K. Maire, M. Weller, D. Herlach, A. Seeger, and J. Diehl, Scr. Metall. 11, 803 (1977).
- Mendelev et al. (2008) M. I. Mendelev, M. J. Kramer, C. A. Becker, and M. Asta, Philos. Mag. 88, 1723 (2008).
- Mishin et al. (2001) Y. Mishin, M. J. Mehl, D. A. Papaconstantopoulos, A. F. Voter, and J. D. Kress, Phys. Rev. B 63, 224106 (2001).
- Timonova et al. (2007) M. Timonova, B.-J. Lee, and B. J. Thijsse, Nucl. Instrum. Methods Phys. Res., Sect. B 255, 195 (2007).
- Ryu et al. (2009) S. Ryu, C. R. Weinberger, M. I. Baskes, and W. Cai, Modell. Simul. Mater. Sci. Eng. 17, 075008 (2009).
- Ramos de Debiaggi et al. (2006) S. Ramos de Debiaggi, M. de Koning, and A. M. Monti, Phys. Rev. B 73, 104103 (2006).
- Purja Pun and Mishin (2009) G. P. Purja Pun and Y. Mishin, Acta Mater. 57, 5531 (2009).
- Sandberg et al. (2002) N. Sandberg, B. Magyari-Köpe, and T. R. Mattsson, Phys. Rev. Lett. 89, 065901 (2002).
- Gillespie et al. (2007) B. A. Gillespie, X. W. Zhou, D. A. Murdick, H. N. G. Wadley, R. Drautz, and D. G. Pettifor, Phys. Rev. B 75, 155207 (2007).
- Tersoff (1988) J. Tersoff, Phys. Rev. B 38, 9902 (1988).
- Erhart and Albe (2005) P. Erhart and K. Albe, Phys. Rev. B 71, 035211 (2005).
- Al-Mushadani and Needs (2003) O. K. Al-Mushadani and R. J. Needs, Phys. Rev. B 68, 235205 (2003).
- Kim et al. (2009b) S.-G. Kim, M. F. Horstemeyer, M. I. Baskes, M. Rais-Rohani, S. Kim, B. Jelinek, J. Houze, A. Moitra, and L. Liyanage, J. Eng. Mater. Technol. 131, 041210 (2009b).
- Mendelev et al. (2003b) M. I. Mendelev, S. Han, D. J. Srolovitz, G. J. Ackland, D. Y. Sun, and M. Asta, Philos. Mag. 83, 3977 (2003b).
- Dudarev and Derlet (2005) S. L. Dudarev and P. M. Derlet, J. Phys.: Condens. Matter 17, 7097 (2005).
- Fu et al. (2004) C.-C. Fu, F. Willaime, and P. Ordejón, Phys. Rev. Lett. 92, 175503 (2004).
- Jesson et al. (1997) B. J. Jesson, M. Foley, and P. A. Madden, Phys. Rev. B 55, 4941 (1997).
- Vitos et al. (1998) L. Vitos, A. V. Ruban, H. L. Skriver, and J. Kollár, Surf. Sci. 411, 186 (1998).
- De Boer et al. (1988) F. De Boer, R. Boom, W. Mattens, A. Miedema, and A. Niessen, Cohesion in Metals: Transition Metal Alloys, edited by F. R. de Boer and D. G. Pettifor, Vol. 1 (North-Holland, Amsterdam, 1988).
- Wilson et al. (1990) J. H. Wilson, J. D. Todd, and A. P. Sutton, J. Phys.: Condens. Matter 2, 10259 (1990).
- Timonova and Thijsse (2011) M. Timonova and B. J. Thijsse, Modell. Simul. Mater. Sci. Eng. 19, 015003 (2011).
- Stekolnikov et al. (2002) A. A. Stekolnikov, J. Furthmüller, and F. Bechstedt, Phys. Rev. B 65, 115318 (2002).
- Eaglesham et al. (1993) D. J. Eaglesham, A. E. White, L. C. Feldman, N. Moriya, and D. C. Jacobson, Phys. Rev. Lett. 70, 1643 (1993).
- Liu et al. (1999b) X. Y. Liu, C. L. Liu, and L. J. Borucki, Acta Mater. 47, 3227 (1999b).
- Błoński and Kiejna (2007) P. Błoński and A. Kiejna, Surf. Sci. 601, 123 (2007).
- Balamane et al. (1992) H. Balamane, T. Halicioglu, and W. A. Tiller, Phys. Rev. B 46, 2250 (1992).
- Mattsson and Kohn (2001) A. E. Mattsson and W. Kohn, J. Chem. Phys. 115, 3441 (2001).
- Armiento and Mattsson (2005) R. Armiento and A. E. Mattsson, Phys. Rev. B 72, 085108 (2005).
- Perdew et al. (2008) J. P. Perdew, A. Ruzsinszky, G. I. Csonka, O. A. Vydrov, G. E. Scuseria, L. A. Constantin, X. Zhou, and K. Burke, Phys. Rev. Lett. 100, 136406 (2008).
- Mattsson et al. (2006) A. E. Mattsson, R. Armiento, P. A. Schultz, and T. R. Mattsson, Phys. Rev. B 73, 195123 (2006).
- Peierls (1940) R. Peierls, Proc. Phys. Soc. London 52, 34 (1940).
- Nabarro (1947) F. R. N. Nabarro, Proc. Phys. Soc. London 59, 256 (1947).
- Carrez et al. (2009) P. Carrez, D. Ferré, and P. Cordier, Modell. Simul. Mater. Sci. Eng. 17, 035010 (2009).
- Vítek (1966) V. Vítek, Phys. Status Solidi 18, 687 (1966).
- Zimmerman et al. (2000) J. A. Zimmerman, H. Gao, and F. F. Abraham, Modell. Simul. Mater. Sci. Eng. 8, 103 (2000).
- Datta et al. (2008) A. Datta, U. V. Waghmare, and U. Ramamurty, Acta Mater. 56, 2531 (2008).
- Mihalkovic and Widom (2009) M. Mihalkovic and M. Widom, “Alloy database,” http://euler.phys.cmu.edu/alloy/ (2009).
- Ravi et al. (2006) C. Ravi, C. Wolverton, and V. Ozoliņš, Europhys. Lett. 73, 719 (2006).
- Wolverton and Ozoliņš (2001) C. Wolverton and V. Ozoliņš, Phys. Rev. Lett. 86, 5518 (2001).
- Murray (1985) J. L. Murray, Int. Met. Rev. 30, 211 (1985).
- Ravi and Wolverton (2005) C. Ravi and C. Wolverton, Metall. Mater. Trans. A 36, 2013 (2005).
- Besson and Morillo (1997) R. Besson and J. Morillo, Phys. Rev. B 55, 193 (1997).
- Shaojun et al. (1998) L. Shaojun, D. Suqing, and M. Benkun, Phys. Rev. B 58, 9705 (1998).
- Zhang et al. (1997) W.-q. Zhang, Q. Xie, X.-j. Ge, and N.-x. Chen, J. Appl. Phys. 82, 578 (1997).
- Meschel and Kleppa (1991) S. Meschel and O. Kleppa, Metall. Mater. Trans. A 22, 2162 (1991).
- Solares (2006) S. J. Solares, Multi-scale simulations of single-walled carbon nanotube atomic force microscopy and density functional theory characterization of functionalized and non-functionalized silicon surfaces, Ph.D. thesis, California Institute of Technology (2006).
- Moroni et al. (1999) E. G. Moroni, W. Wolf, J. Hafner, and R. Podloucky, Phys. Rev. B 59, 12860 (1999).
- Zhou et al. (2007) S. Zhou, Y. Wang, F. Shi, F. Sommer, L.-Q. Chen, Z.-K. Liu, and R. Napolitano, J. Phase Equilib. Diffus. 28, 158 (2007).
- Narasimhan and Davenport (1995) S. Narasimhan and J. W. Davenport, Phys. Rev. B 51, 659 (1995).
- Zhong et al. (2005) Y. Zhong, M. Yang, and Z.-K. Liu, Calphad 29, 303 (2005).
- Wang et al. (2008) N. Wang, W.-Y. Yu, B.-Y. Tang, L.-M. Peng, and W.-J. Ding, J. Phys. D: Appl. Phys. 41, 195408 (2008).
- Kim et al. (2009c) Y.-M. Kim, N. J. Kim, and B.-J. Lee, Calphad 33, 650 (2009c).
- Liu et al. (1997b) X.-Y. Liu, P. P. Ohotnicky, J. B. Adams, C. L. Rohrer, and R. W. Hyland, Surf. Sci. 373, 357 (1997b).
- Murray (1982) J. Murray, J. Phase Equilib. 3, 60 (1982).
- Villars and Calvert (1985) P. Villars and L. D. Calvert, Pearson’s handbook of crystallographic data for intermetallic phases (American Society for Metals, Materials Park, OH, 1985).
- Singh et al. (2003) D. Singh, C. Suryanarayana, L. Mertus, and R.-H. Chen, Intermetallics 11, 373 (2003).
- Fries and Jantzen (1998) S. G. Fries and T. Jantzen, Thermochim. Acta 314, 23 (1998).
- Liu (1997) X.-Y. Liu, The development of empirical potentials from first-principles and application to Al alloys, Ph.D. thesis, University of Illinois at Urbana-Champaign (1997).
- Maugis et al. (2006) P. Maugis, J. Lacaze, R. Besson, and J. Morillo, Metall. Mater. Trans. A 37, 3397 (2006).
- Gonzales-Ormeño et al. (2002) P. G. Gonzales-Ormeño, H. M. Petrilli, and C. G. Schön, Calphad 26, 573 (2002).
- Watson and Weinert (1998) R. E. Watson and M. Weinert, Phys. Rev. B 58, 5981 (1998).
- Kulikov et al. (1999) N. I. Kulikov, A. V. Postnikov, G. Borstel, and J. Braun, Phys. Rev. B 59, 6824 (1999).
- Friák and Neugebauer (2010) M. Friák and J. Neugebauer, Intermetallics 18, 1316 (2010).
- Lechermann et al. (2005) F. Lechermann, M. Fähnle, and J. M. Sanchez, Intermetallics 13, 1096 (2005).
- Fu and Yoo (1992) C. L. Fu and M. H. Yoo, Acta Metall. Mater. 40, 703 (1992).
- Lee and Lee (2010) E. Lee and B.-J. Lee, J. Phys.: Condens. Matter 22, 175702 (2010).
- SHU et al. (2001) X. SHU, W. HU, H. XIAO, H. DENG, and B. ZHANG, J. Mater. Sci. Technol. (Shenyang, China) 17, 601 (2001).
- Vailhé and Farkas (1997) C. Vailhé and D. Farkas, Acta Mater. 45, 4463 (1997).
- Kubaschewski and Dench (1955) O. Kubaschewski and W. A. Dench, Acta Metall. 3, 339 (1955).
- Desai (1987) P. D. Desai, J. Phys. Chem. Ref. Data 16, 109 (1987).
- Hultgren et al. (1973) R. Hultgren, P. D. Desai, D. T. Hawkins, M. Gleiser, and K. K. Kelley, Selected values of the thermodynamic properties of binary alloys (American Society for Metals, Metals Park, OH, 1973).
- Gale et al. (2004) W. Gale, C. Smithells, and T. Totemeier, Smithells metals reference book (Butterworth-Heinemann, 2004).
- Pearson (1958) W. B. Pearson, A Handbook of lattice Spacings and Structures of Metals and Alloys (Pergamon Press, New York, 1958).
- Yoo et al. (1990) M. H. Yoo, T. Takasugi, S. Hanada, and O. Izumi, Mater. Trans., JIM 31, 435 (1990).
- Simmons and Wang (1971) G. Simmons and H. Wang, Single crystal elastic constants and calculated aggregate properties (MIT Press, 1971).
- Krajčí and Hafner (2002) M. Krajčí and J. Hafner, J. Phys.: Condens. Matter 14, 5755 (2002).
- Bailey et al. (2004) N. P. Bailey, J. Schiøtz, and K. W. Jacobsen, Phys. Rev. B 69, 144205 (2004).
- King and Kleppa (1964) R. C. King and O. J. Kleppa, Acta Metall. 12, 87 (1964).
- Predel and Ruge (1972) B. Predel and H. Ruge, Mater. Sci. Eng. 9, 333 (1972).
- Davis (1998) J. R. Davis, ed., Metals Handbook Desk Edition, 2nd ed. (ASM International, 1998).
- Chu and Steeves (2011) J. J. Chu and C. A. Steeves, J. Non-Cryst. Solids 357, 3765 (2011).
- Wilson (1941) A. J. C. Wilson, Proc. Phys. Soc. 53, 235 (1941).
- Plimpton (1995) S. J. Plimpton, J. Comput. Phys. 117, 1 (1995).
- Bahn and Jacobsen (2002) S. R. Bahn and K. W. Jacobsen, Comput. Sci. Eng. 4, 56 (2002).
- Becker (2011) C. A. Becker, in Models, Databases, and Simulation Tools Needed for the Realization of Integrated Computational Materials Engineering, edited by S. M. Arnold and T. T. Wong (ASM International, 2011) Atomistic simulations for engineering: Potentials and challenges, http://www.ctcms.nist.gov/potentials.
- Rose et al. (1984) J. H. Rose, J. R. Smith, F. Guinea, and J. Ferrante, Phys. Rev. B 29, 2963 (1984).
- Murnaghan (1944) F. D. Murnaghan, Proc. Natl. Acad. Sci. U. S. A. 30, 244 (1944).