Near-Infrared Reverberation by Dusty Clumpy Tori in Active Galactic Nuclei
Abstract
According to recent models, the accretion disk and black hole in active galactic nuclei are surrounded by a clumpy torus. We investigate the NIR flux variation of the torus in response to a UV flash for various geometries. Anisotropic illumination by the disk and the torus self-occultation contrast our study with earlier works. Both the waning effect of each clump and the torus self-occultation selectively reduce the emission from the region with a short delay. Therefore, the NIR delay depends on the viewing angle (where a more inclined angle leads to a longer delay) and the time response shows an asymmetric profile with a negative skewness, opposing to the results for optically thin tori. The range of the computed delay coincides with the observed one, suggesting that the viewing angle is primarily responsible for the scatter of the observed delay. We also propose that the red NIR-to-optical color of type-1.8/1.9 objects is caused by not only the dust extinction but also the intrinsically red color. Compared with the modest torus thickness, both a thick and a thin tori display the weaker NIR emission. A selection bias is thus expected such that NIR-selected AGNs tend to possess moderately thick tori. A thicker torus shows a narrower and more heavily skewed time profile, while a thin torus produces a rapid response. A super-Eddington accretion rate leads to a much weaker NIR emission due to the disk self-occultation and the disk truncation by the self-gravity. A long delay is expected from an optically thin and/or a largely misaligned torus. A very weak NIR emission, such as in hot-dust-poor active nuclei, can arise from a geometrically thin torus, a super-Eddington accretion rate or a slightly misaligned torus.
Subject headings:
accretion, accretion disks — dust, extinction — galaxies: active — galaxies: structure — infrared: galaxies — infrared: ISM1. Introduction
Active galactic nuclei (AGNs) are powered by gas accretion onto supermassive black holes (BHs) at the center of each galaxy. A variety of observations suggest that the accretion disk and the BH are surrounded by an optically and geometrically thick torus (Telesco et al. 1984; Antonucci & Miller 1985; Miller & Goodrich 1990; Radovich et al. 1999). Since the torus potentially plays a role of a gas reservoir for the accretion disk, its nature, such as the structure, the size and the mass, has long been investigated (Pier & Krolik 1992, 1993; Fukue & Sanbuichi 1993; Granato & Danese 1994; Efstathiou & Rowan-Robinson 1995 Beckert & Duschl 2004; Mor et al. 2009).
A large geometrical thickness of the torus revealed by various observations (Antonucci 1993; Pogge 1989; Wilson & Tsvetanov 1994; Schmitt & Kinney 1996) indicates that numerous dusty clumps, rather than a smooth mixture of gas and dust, constitute the torus with a large clump-to-clump velocity dispersion (Krolik & Begelman 1988; Wada & Norman 2002; Hönig & Beckert 2007). Temperature of clumps is less than a critical temperature K above which dust grains are sublimated (Barvainis 1987). Infrared (IR) emission and absorption features provide unique opportunities to probe the clumpy torus (Nenkova et al. 2002, 2008; Dullemond & van Bemmel 2005; Hönig et al. 2006; Geballe et al. 2006; Shirahata et al. 2007; Ibar & Lira 2007; Schartmann et al. 2008; Deo et al. 2011).
Clumps are heated by illumination from the central accretion disk, and closer clumps have higher temperature. Inner edge of the dusty torus is determined by the sublimation process so that clumps’ temperature equals there, and radiates at Near-IR (NIR) as ”3m bump” (Rees et al. 1969; Neugebauer et al. 1979; Edelson & Malkan 1986; Kobayashi et al. 1993). Based on the energy balance of the clump closest to the BH, Barvainis (1987) derived the innermost radius of the torus (dust sublimation radius, denoted as in this study):
| (1) |
where and are UV luminosity and the size of dust grains, respectively.
Indeed, NIR emission from type-1 AGNs lags behind optical variation by an order of a month (Clavel et al. 1989; Glass 1992, 2004; Nelson 1996; Oknyanskij et al. 1999; Minezaki et al. 2004; Suganuma et al. 2004). Moreover, the luminosity dependency of the time lag also coincides with the theoretical prediction as (Suganuma et al. 2006; Gaskell et al. 2007). However, the NIR-to-optical time lag is systematically smaller than the lag predicted from Equation (1) by a factor of (Oknyanskij & Horne 2001; Kishimoto et al. 2007; Nenkova et al. 2008). To tackle with this conflict, Kawaguchi & Mori (2010, hereafter Paper I) pointed out that the illumination by an optically thick disk is inevitably anisotropic, which is a fact missing in deriving Equation (1). There is a systematic difference between the inclination angle at which we observe the disk in type-1 AGNs and the angle at which an aligned torus observes the disk. The effects of the anisotropic illumination naturally resolve the puzzle of the systematic deviation of a factor of (Paper I).
In Paper I, we assumed the configuration appropriate for a typical type-1 AGN. In this study, we investigate the expected characteristics of the NIR emission for various geometries of the disk, the torus and the observer. Anisotropic illumination by the disk and the effect of the torus self-occultation contrast our study with earlier works. The next section describes the calculational methods of our model. Then, properties of NIR emission from an aligned (Section 3) and a misaligned (Section 4) tori are presented. Finally, we make a summary of this study in Section 5.
2. Model Description
We calculate NIR reverberation/echo from the inner part of the torus in response to a flash of disk illumination. The calculational method is essentially the same as Paper I, except for the incorporation of the torus self-occultation in this study. By considering the anisotropy of the disk illumination, we solved the inner structure of the torus, and explained why the observed time delay of NIR emission is systematically shorter than Equation (1). A large grain size and/or extinction between the torus and the disk are possibly alternative concepts to reduce the inner radius of the torus (Maiolino et al. 2001; Gaskell & Benker 2007; Gaskell et al. 2007; Kishimoto et al. 2007).
While the geometry of the torus, the disk and the observer appropriate for a typical type-1 AGN was assumed in Paper I, we here investigate how the NIR response differs with various possible geometries. A variety of type-1 objects with a common are compared. In other words, we compute for objects with the same isotropic-equivalent luminosity (“luminosity presuming isotropic emission”) in optical/UV.
Barvainis (1992) examined the NIR response due to the dust reverberation of an AGN torus. Since the inner radius of the torus is an input parameter there, the mean time delay of NIR emission behind the optical/UV flux variations is simply coupled with the assumed inner radius. On the other hand, in Paper I and this study, both the inner radius and the time delay are output of calculations. Moreover, he supposed that the whole torus, an ensemble of cube-shaped, optically thick clumps, is optically thin. Since the inner part of an AGN clumpy torus is likely optically thick (Appendix), we take into account the torus self-occultation as well as the anisotropic emission from spherical, optically thick clumps. Similarities and differences in the results for the time response between our and his calculations are discussed in Sections 2.4 and 3.1.
In radiative transfer calculations of dusty clumpy tori (e.g., Hönig et al. 2006; Nenkova et al. 2008), the isotropic illumination, mainly in optical and UV, is assumed for simplicity. We take into account the fact that the disk emission is inevitably anisotropic. Then, the broadband color between the optical/UV radiation from the disk and the NIR emission from the torus can be computed appropriately. In Sections 3.1 and 3.2, we compare our results with theirs.
Below, our calculational method is summarised.
2.1. Anisotropic Illumination of Disk
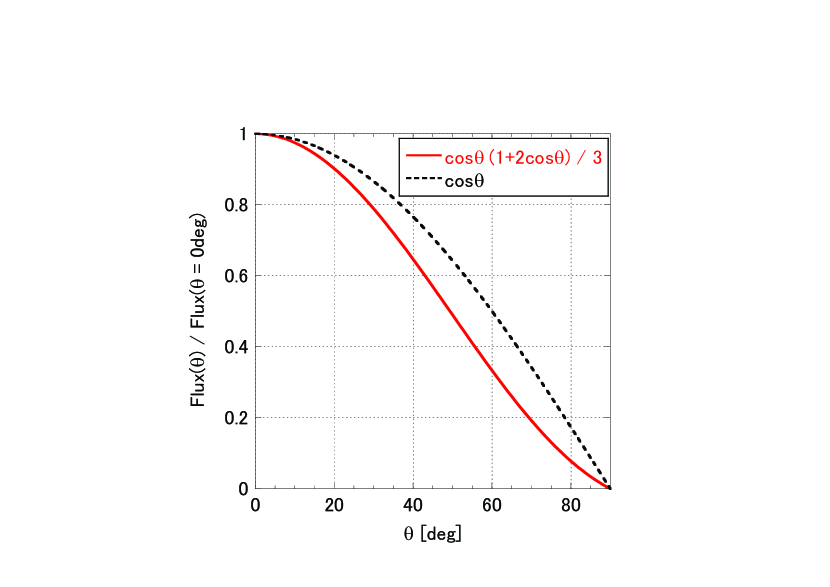
Radiation flux () from a unit surface area of an optically thick disk toward a unit solid angle at the polar angle of decreases with an increasing as follows (Netzer 1987):
| (2) |
Here, the first term represents the change in the projected surface area, while the latter represents the limb darkening effect for plasma, whose opacity is dominated by electron scattering over absorption (Sunyaev & Titarchuk 1985; Phillips & Meszaros 1986). Figure 1 shows the -dependency of , where the former effect alone is also drawn for comparison. An accretion disk emits lesser radiation in the direction closer to its equatorial plane (i.e., larger ; Laor & Netzer 1989; Sun & Malkan 1989; Hubeny et al. 2000). If the torus and the disk are aligned, the assumption of isotropic emission from accretion disks (e.g., Equation (1)) obviously overestimates the radiation flux toward the torus, leading the overestimation of the inner radius of the torus.
This effect works even if the disk is infinitesimally thin. As shown in Section 3.3, a nonzero thickness of the disk brings about another anisotropy of illumination flux, such that the torus is not illuminated below the disk height at larger than a critical angle . Except in Section 3.3, we throughout adopt a thin disk with an aspect ratio of , like the standard accretion disk model (Shakura & Sunyaev 1973).
The effects of anisotropic emission and orientation have been discussed in the context of the Baldwin effect in the line fluxes of photo-ionised emission (Netzer 1985; Francis 1993; Bottorff et al. 1997). These effects upon the torus were examined for the first time in Paper I.
2.2. Inner Structure of Torus
The inner edge of the torus is determined so that the temperature of a clump (at the irradiated surface) equals there. Since the radiation flux from the disk varies with the polar angle , the sublimation radius of the torus is also a function of . Namely, is the distance between the torus edge and the central BH for various . In contrast, we express the sublimation radius estimated under the isotropic emission assumption (Equation (1)) as . The anisotropic illumination given in Equation (2) results in
| (3) |
Here, is the polar angle toward the observer seen from the central accretion disk. Outside this radius, there are numerous clumps with their temperature below . In the case of an isotropic emission from the disk, the torus edge is supposed to stand at a distance of . Although various grain sizes result in the sublimation process occurring over a transition zone rather than a single distance (Nenkova et al. 2008), we employ a sharp boundary for simplicity.
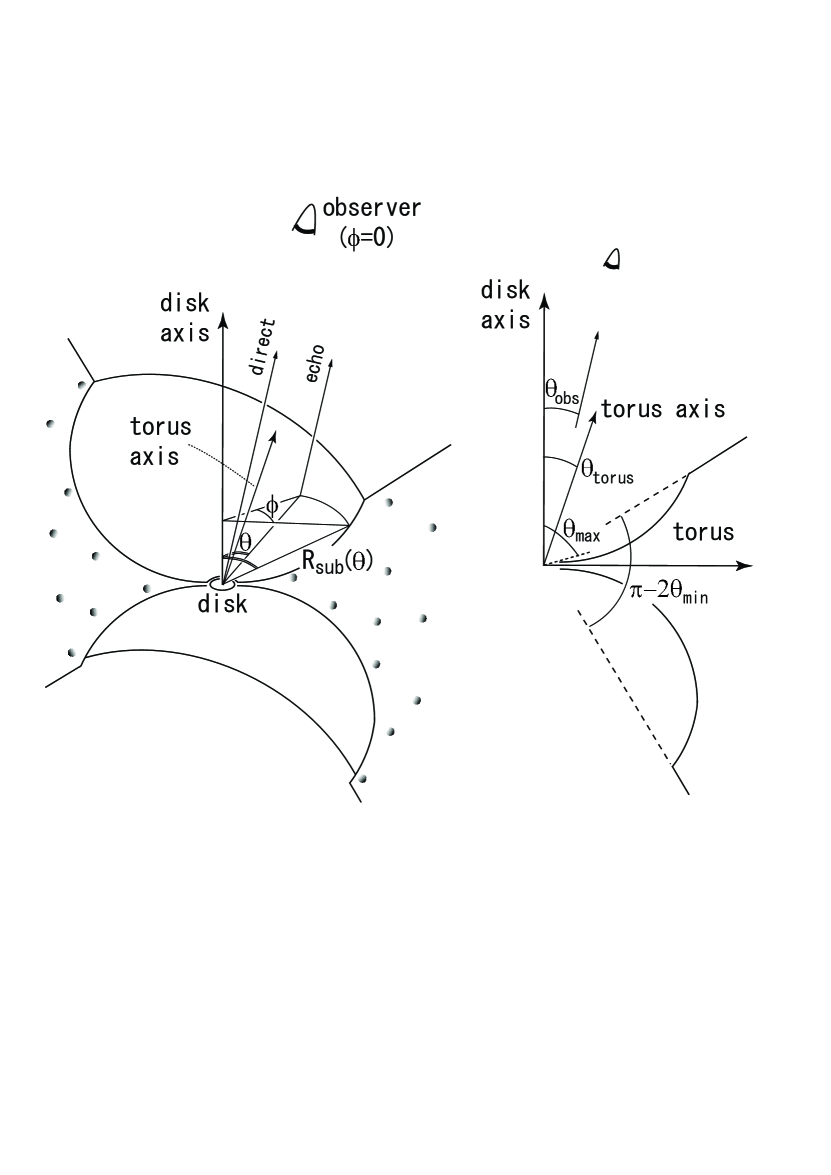
In Paper I, we found that (1) the torus inner edge is located closer to the central BH than suggested by previous estimations (Equation (1)) and that (2) the structure of the edge is concave/hollow. Moreover, (3) our result indicated that the innermost edge of the torus may connect with the outermost edge of the accretion disk continuously (e.g., Emmering et al. 1992; Elitzur & Shlosman 2006). Figure 2 shows a schematic view of the torus inner region. If the torus is indeed a reservoir of gas for the disk, angular momenta of the infalling gas will align these axes. The misalignment between the torus and the disk is investigated in Section 4.
2.3. Calculation of Transfer Function
Current interferometric NIR observations (e.g., Swain et al. 2003; Kishimoto et al. 2009) and future Adaptive Optics imaging with m telescopes cannot spatially resolve the innermost region (radius and shape) of the torus in nearby Seyfert galaxies. Thus, observations of time variability will continue to be powerful tools to probe the innermost structure of the torus even in the coming decade. We calculate the time variation of NIR emission in response to a -function like variation of the optical/UV illumination [transfer function ]. Transfer functions contain various information of the re-emitting region, such as the shape and the emissivity profile etc (Blandford & McKee 1982; Netzer 1990; Gaskell et al. 2007). Time variation of the reprocessed radiation (NIR in this study) is a convolution of the illumination flux variation with . We calculate and its centroid , which corresponds to the observed time lag. Since the time profile is also one of the characteristics of this study compared to the earlier work (Sections 2.4 and 2.5), we also calculate the width and the skewness to describe the shape of :
| (4) | |||||
| (5) |
A negative (or positive) means that the distribution has a left (or right) tail. The computed and would be useful to interpret and predict the cross correlation functions between NIR and optical/UV light curves. A larger will correspond to a larger uncertainty in the measurements of the time delay. As to the detectability of NIR variations, a small and a high indicate the relative (i.e. in mag) and absolute (e.g., in erg s-1) variability, respectively.
When the illumination flux varies, the inner edge of the torus shifts in principle (Laor 2004). Depending on whether dust grains in the clumps are sublimated or not, clumps belong to either the broad emission line region or the dusty torus (Netzer & Laor 1993; Suganuma et al. 2006). However, it takes year for the inner region of the torus to adjust to the varying illumination flux (Koshida et al. 2009; Pott et al. 2010). Thus, we regard that the inner structure of the dusty torus is steady in the timescale of NIR-to-optical time lag (months).
To calculate for the clumpy torus, we consider the following items; (1) the optical path, (2) NIR emissivity of the torus inner region as a function of and (3) anisotropic emission of each clump. In this work, (4) we include the effect of torus self-occultation (i.e., absorption of NIR emission from a clump by other clumps on the line of sight). While the torus self-occultation is a minor effect for a typical type-1 AGN, it plays a significant role for inclined viewing angles, thick tori and misaligned tori. Considering the self-occultation, we ignore the response from the aligned torus at (Appendix).
First, (1) the optical path difference is written as
| (6) |
where is the azimuthal angle and defined so that for the observer (Figure 2). The concave shape of the inner region of the torus reduces the optical path difference. Clumps at slightly farther and those at slightly closer than will also emit NIR radiation, smearing out the resultant NIR response. Since this effect unlikely changes the drastically, we consider only optical paths that hit the inner edge of the torus.
Next, (2) for the emissivity as a function of , we assume that (2-1) the clump size increases and (2-2) the clump number density decreases when the clump-to-BH distance increases (e.g., Hönig et al. 2006; Schartmann et al. 2008). Following Paper I, the emissivity of NIR flux per is assumed to be proportional to .
Third, (3) the anisotropy of the NIR emission from each clump is considered, since clumps are optically thick to NIR (and optical/UV) radiation (see Appendix for details). Namely, the question is how extent the illuminated surface of a clump is seen by the observer (Nenkova et al. 2002). Let us suppose that an observer looks at a clump with an angle , where means a face-on view of the illuminated surface. We adopt the following anisotropic coefficient for the waning effect,
| (7) |
This coefficient is chosen so as to reproduce the Monte Carlo calculations by Hönig et al. (2006) for a single clump observed from three different .
Finally, (4) if the line of sight from a region to the observer passes through the torus, we omit the NIR flux from such a region. Radiation energy absorbed by the clumps on the way will be re-radiated at Mid-IR bands.
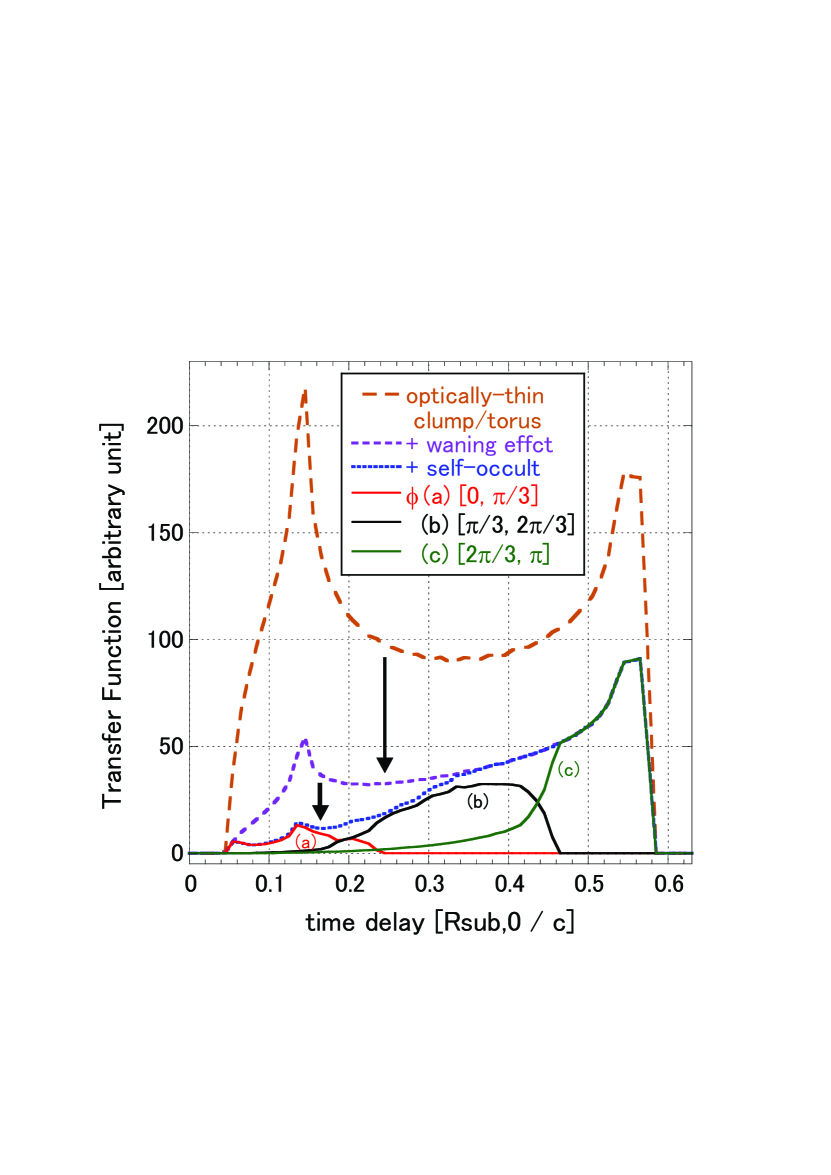
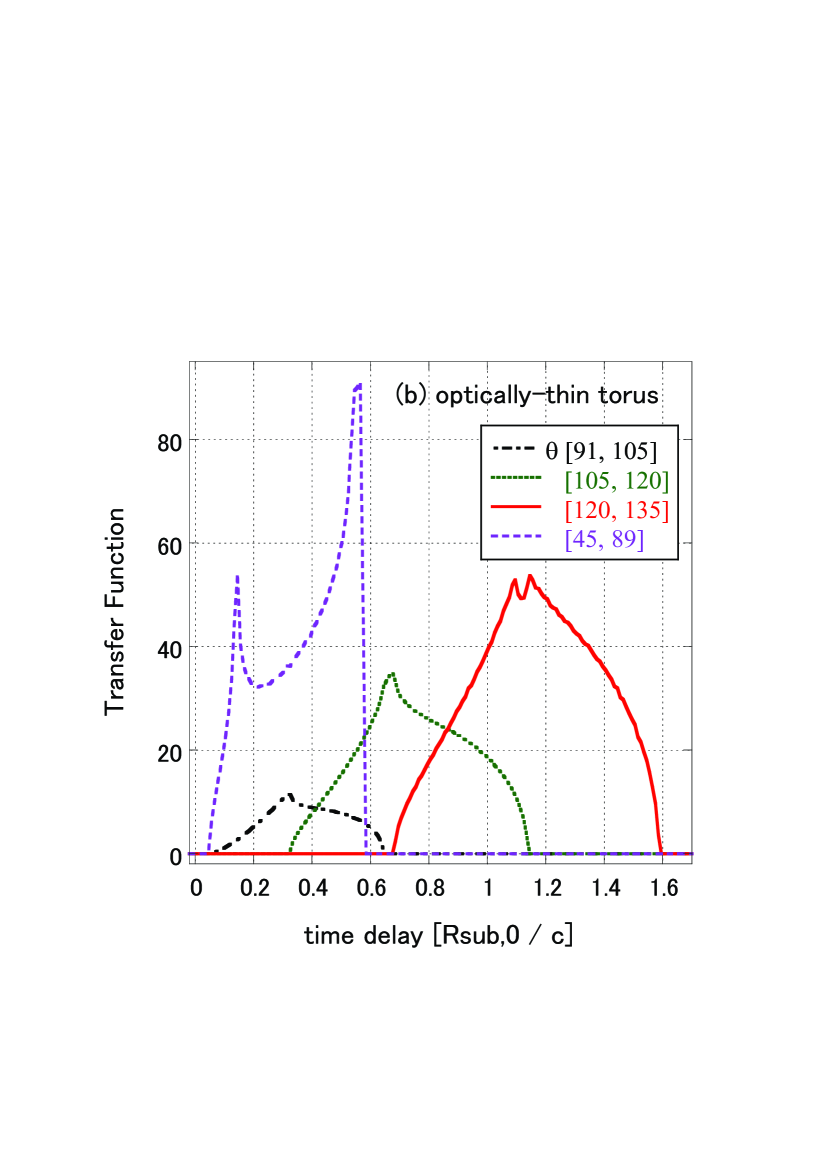
The dotted line in Figure 3 presents the resultant transfer function of the aligned torus for = 25°, calculated by summing up the NIR responses from different portions of the torus at (, ). The integration is done from to in the -direction and 0 to in the -direction. Here, the opening angle of the torus is assumed to be 45°, which is roughly consistent with various observational results (e.g., the ratio between types-1 and -2 AGNs and/or opening angles of light cones in the narrow line region), and the maximum of the torus is set to 89° (i.e., thin disk approximation). This parameter set is identical to the one adopted in Paper I, and is regarded as fiducial in this study. The mean delay , the width and the skewness of are , and , respectively. For typical Seyfert 1 galaxies and quasars (e.g., with UV luminosity of erg s-1 and erg s-1), the expected inner radii are 0.1 and 1 pc (Equation 1), while our resultant delays for the fiducial parameter set are about a month and a year, respectively (see Figure 7).
The long-dashed line is computed by switching off both the waning effect and the torus self-occultation, making the left horn higher than the right one similar to the time response of optically thin tori (Barvainis 1992). Then, the short-dashed line takes into account the waning effect, and is identical to the presented in Paper I, with , and of , and , respectively. The torus self-occultation results in a slight increase of and a more skewed profile. We will see the reason for these changes in the next subsection.
2.4. Response from various
In order to clarify contributions from different , we divide the torus inner edge into three regions equally. The three solid lines in Figure 3 show the from each range. Among them, the left one is produced by the low region (), showing the rapid response at (due to a short optical path difference) and a strong reduction of flux by the waning effect (large ) and the torus self-occultation. On the contrary, the right one with the longer delay at comes from the large region (), where clumps tend to direct their illuminated surface toward the observer, suffering from less waning effect. We see that the torus self-occultation affects no influence at with the fiducial parameter set. In other words, both the waning effect and the self-occultation selectively reduce the emission from the region with a short delay, making the right horn higher than the left one, opposing to the results for optically thin tori (Barvainis 1992). The fluences, , from each region are 1.3, 6.4 and 10.4 from low to high , respectively.
2.5. Response from various
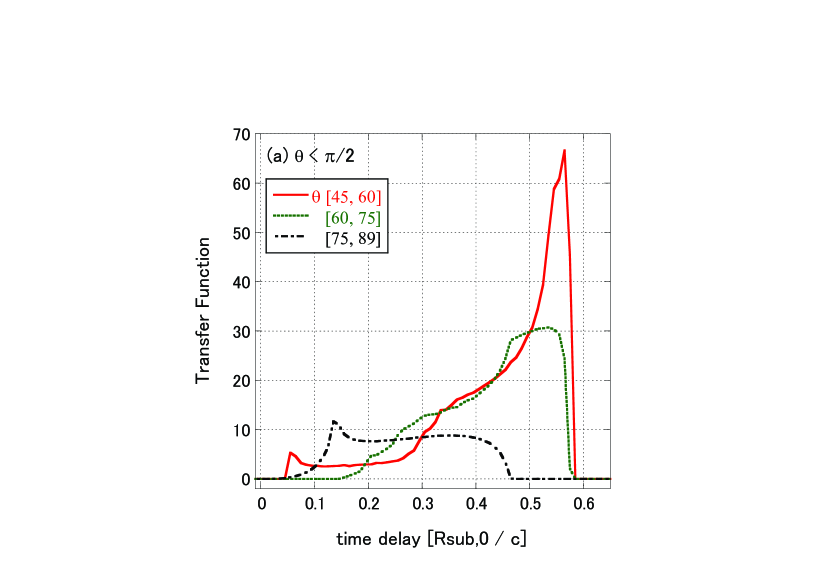
Later, we change the torus thickness (Section 3.2) and the disk thickness (Section 3.3). To understand how they will affect the time response of NIR emission, we draw from different ranges (at ) separately in Figure 4a. It turns out that most NIR flux arises from small regions at ° (i.e., the region with a high latitude from the equatorial plane), which show similar time delay. Because the emissivity is assumed in proportion to , the fluence from the largest range (75°–89°) near the equatorial plane, where the torus inner edge is closest to the central BH, is small. The NIR fluences from each range, from small to large , is 8.4, 6.8 and 2.9, respectively. Therefore, little difference in for various and a shorter for an extremely thin (°) torus are expected. Consequences of a thick torus are not drawn straightforwardly, because of the torus self-occultation.
In case the torus is optically thin (cf. Appendix), we shortly mention the contribution from the far side () of the torus. Depending on the origin of optical/UV time variability of AGNs (X-ray reprocessing or change in the accretion rate etc.; e.g., Kawaguchi et al. 1998; Sakata et al. 2011), the link between the disk fluxes to and to will vary. The NIR time variations from is controlled by the variations of the disk flux to , which we cannot observe. Thus, if the disk illumination to the two sides are random, the NIR flux variations from influence the measurements of the optical/UV-to-NIR lag as noise. On the other hand, if the time variations of disk illumination toward the two sides are similar, the time delay of NIR emission will become longer, as follows. To calculate the NIR response from , we replace in Equation (3) by , and switched off the self-occultation effect. Figure 4b presents NIR responses from , which have long time delay due to their long light path. If no extinction affects the NIR emission from (as Barvainis 1992 assumed), we will obtain the net response from ° with of . In other words, a long may be a signature of an extremely low volume filling factor of clumps in the torus and/or a very thin torus (Appendix).
3. Aligned Torus: Various Dependencies
In this section, we present various dependencies of the NIR emission from the torus whose rotation axis is aligned to the disk axis. At the end of each subsection, we shortly summarise the obtained dependency by contrasting with the result for the fiducial parameter set.
3.1. Viewing Angle:
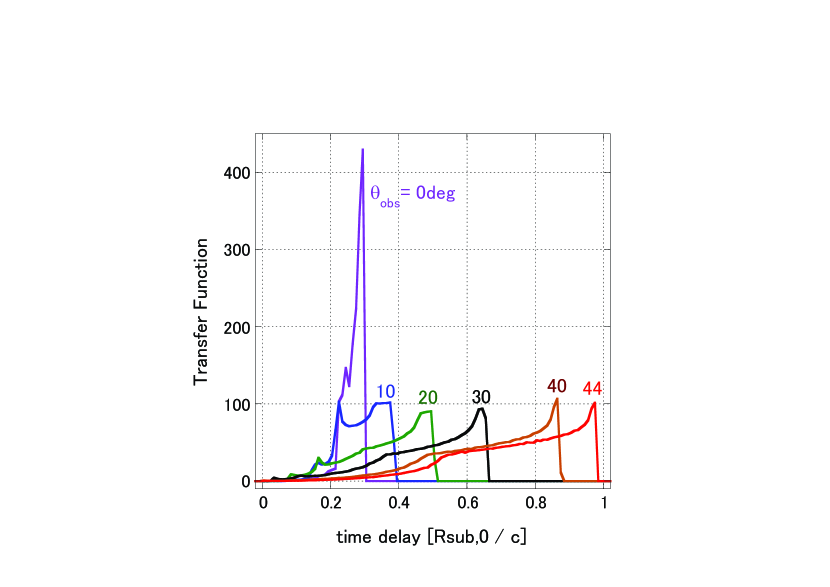
Figure 5 shows the transfer functions for various , from an exactly pole-on geometry (°) to inclined viewing angles. With a large (–), the line of sight grazes the upper boundary of the torus, which would corresponds to the situation in type-1.8/1.9 AGNs. Here, and are fixed at 45° and 89°, respectively. As increases, we see that (1) the centroid of the response increases, (2) the NIR fluence also increases, and (3) the profile becomes broad. In addition, (4) is quite peaky for a nearly face-on geometry. The first and second results are our new findings. Although the third and forth trends are already reported for optically thin tori by Barvainis (1992), we find here that both trends are also true for optically thick tori.

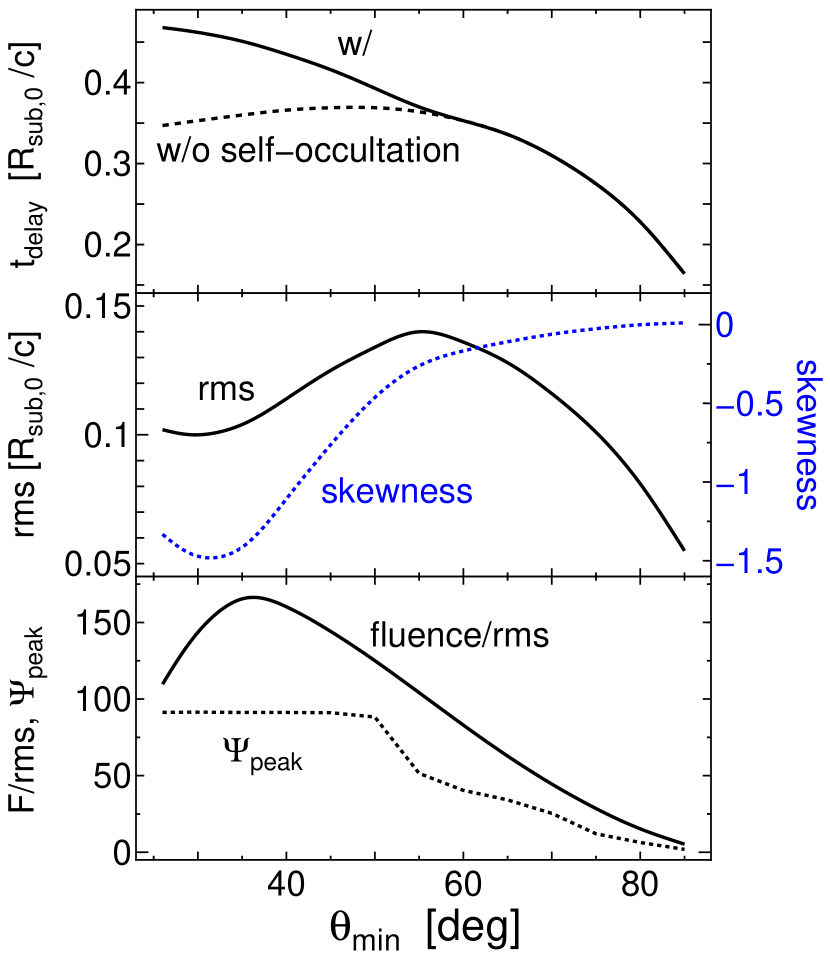
First, (1) is drawn as a function of in Figure 6. For comparison, the result computed without the self-occultation is also shown. The torus veils selectively the region with a short delay (Figure 3), hence enlarges . The self-occultation shows larger influences for more inclined angles. On the right-hand side, we also draw a histogram of the observed delay in the unit of (based on Figure 7). The computed ranges from 0.27 to 0.74 (0.27 to 0.60 without the self-occultation), which covers the range of the observed time delay. In contrast, since Barvainis (1992) assumed an optically thin torus, was expected to have no (or quite weak) -dependency.
Since such a broad range is not achieved by the changes of and as we will see later, we propose that the viewing angle is the key parameter responsible for the observed scatter about the regression line in the – diagram (Oknyanskij & Horne 2001; Suganuma et al. 2006). Conversely, the measurements of are potentially useful to estimate the inclination angles.
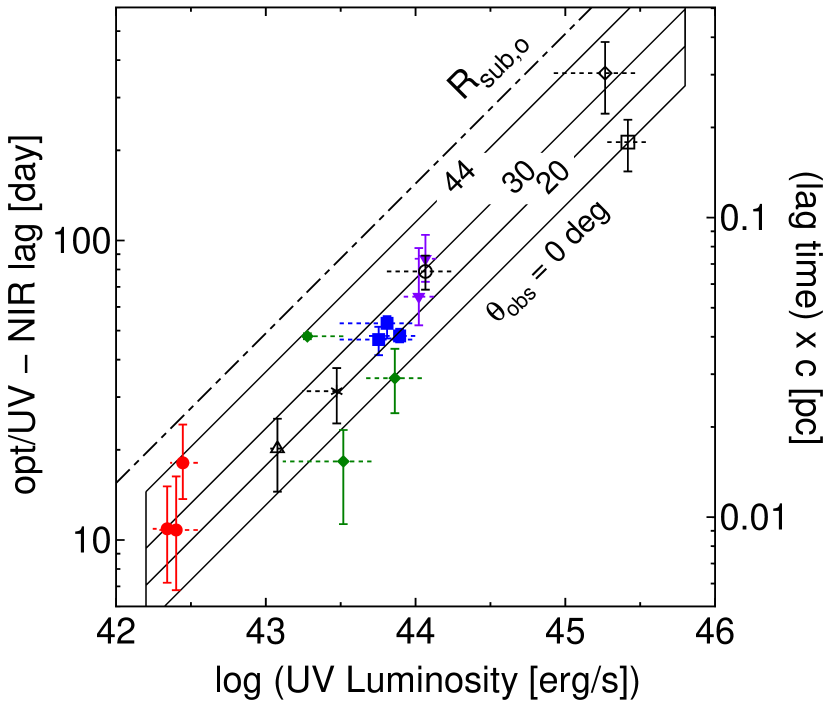
In order to compare our results with the observed data more directly, the v.s. diagram is drawn in Figure 7 (Suganuma et al. 2006 and references therein). Following Kishimoto et al. (2007), we estimate by . The uncertainty of the is on average. Our loci for various (with and fixed at the fiducial values) well cover the observed scatter. A type-1.5 Seyfert galaxy NGC3227 (triangle) is located at an area with a small (–), which would require a hysteresis effect (Koshida et al. 2009) or a thin torus for its relatively short . Among the three points for NGC4151 (green diamonds), the lower two data (collected in 1969-1980 and 1990-1998) are consistent with a pole-on view, while the upper one in 2001 indicates an inclined angle. A change of the viewing angle on the timescale of tens years, due to e.g., a precession of the disk, is indicated.
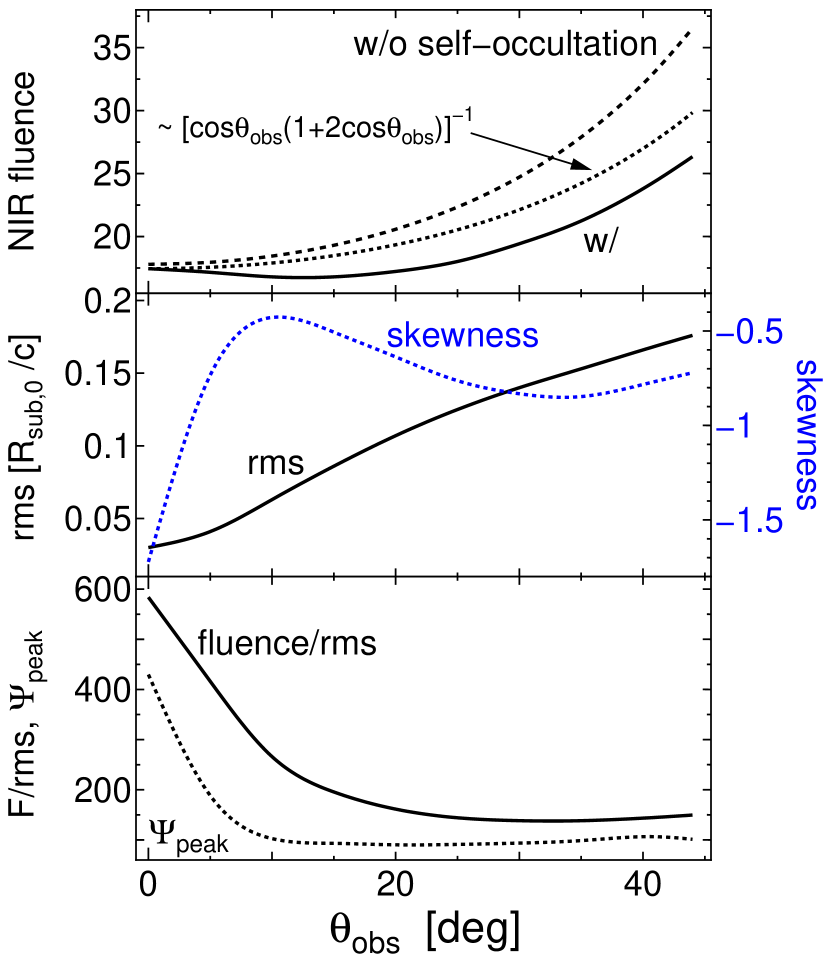
Second, (2) the top panel of Figure 8 shows that the NIR fluence toward the observer, , is insensitive to the viewing angle at and increases with at more inclined angles (solid line). Comparing ° with °, the fluence increases by a factor of 1.5. Due to the self-occultation, the NIR flux decreases by 19% at ° and by 26–28% at –.
Regarding a continuous illumination from the disk as a series of flash, we can draw conclusions other than the time response of NIR emission. Namely, the obtained NIR fluence indicates the NIR flux toward the observer under a given steady optical/UV illumination. We recall that we compute for various objects with a common optical flux toward the observer. Therefore, the -axis (NIR fluence) directly indicates the NIR-to-optical color. In other words, the NIR-to-optical color becomes red as increases. We thus argue that the red IR-optical color observed for type-1.8/1.9 AGNs compared with type-1 objects (Alonso-Herrero et al. 2003) arises not only from dust extinction but also from their intrinsically red color.
The red color for large objects can originate in the reduction of optical flux toward large (Equation (2)) and/or in the change of NIR flux. Here, we try to distinguish its origin. The dotted line shows the disk flux toward °, in proportion to , normalised so that it coincides with the NIR fluence at °. If the NIR emission is isotropic, the NIR fluence in this diagram should change as the dotted line. Instead, if the computed NIR fluence is smaller (or larger) than the dotted line, it means the NIR flux decreases (or increases) with . Our result indicates that the NIR flux decreases with due to the torus self-occultation, but its -dependency is weaker than that of the disk flux, thereby presenting the red NIR-optical color for inclined angles. The reduction of the NIR flux toward a larger is consistent with the radiative transfer calculations under an isotropic optical/UV illumination (Hönig et al. 2006; Nenkova et al. 2008). Incorporation of the anisotropy of the optical/UV flux from the disk (Equation (2)) enables us to predict the NIR-optical/UV color.
Third, (3) the middle panel of Figure 8 describes the profile of . As increases, the width of also increases, meaning that becomes broader. Both and increase with , and their ratio slightly rises toward a smaller viewing angle: a ratio increases twice between – and . With a small , the echo from various parts of the inner edge arrives at the observer at a similar delay, making the quite narrow. For larger , a variety of light pass difference arise between and , which causes the broader . We expect that the cross correlation function between NIR and optical/UV flux variations becomes broader for type-1.5–1.9 AGNs compared with a typical type-1 object. The skewness is always negative (i.e., with a tail toward a shorter time delay), and the degree of asymmetry gets larger for a pole-on view.
Finally, (4) we comment on the NIR variability amplitude (to be precise, the ratio of the NIR amplitude to the optical/UV one). A peaky will result in a large NIR amplitude, whereas a less peaky smears out the variability of reprocessed emission, producing a less NIR amplitude. In order to see this quantitatively, we draw the NIR fluence-to- ratio and the peak value of as a function of in the bottom panel of Figure 8. For nearly pole-on view with °, both quantities rise. For a given optical/UV variability, such pole-on objects will show large NIR variability amplitudes. At °, the peakiness of is insensitive to the viewing angle.
By contrast with the fiducial of 25°, objects with a small viewing angle will exhibit a short time delay with a narrow and peaky response. On the other hand, a more inclined viewing angle leads to a longer delay with a broader profile and to an intrinsically redder NIR-to-optical color. The -dependent delay contrasts our work with the earlier study for optically thin tori (Barvainis 1992). The computed range of coincides with the observed one. The NIR response always shows an asymmetry with a tail toward a shorter delay.
3.2. Torus Thickness:
In Paper I, we assumed that the semi-thickness of the torus (from the equatorial plane to the upper surface) is 45°. However, luminous AGNs (quasars) seem to have thinner tori than Seyfert galaxies (Lawrence 1991; Ueda et al. 2003; La Franca et al. 2005; Arshakian 2005; Simpson 2005; Maiolino et al. 2007; Hasinger 2008; Treister et al. 2008). Moreover, recent hard X-ray observations discovered type-2 AGNs with very thick tori (Levenson et al. 2002; Ueda et al. 2007; Eguchi et al. 2009; Noguchi et al. 2010). In this subsection, we show the expected characteristics of the NIR emission from type-1 AGNs with thick and thin tori.
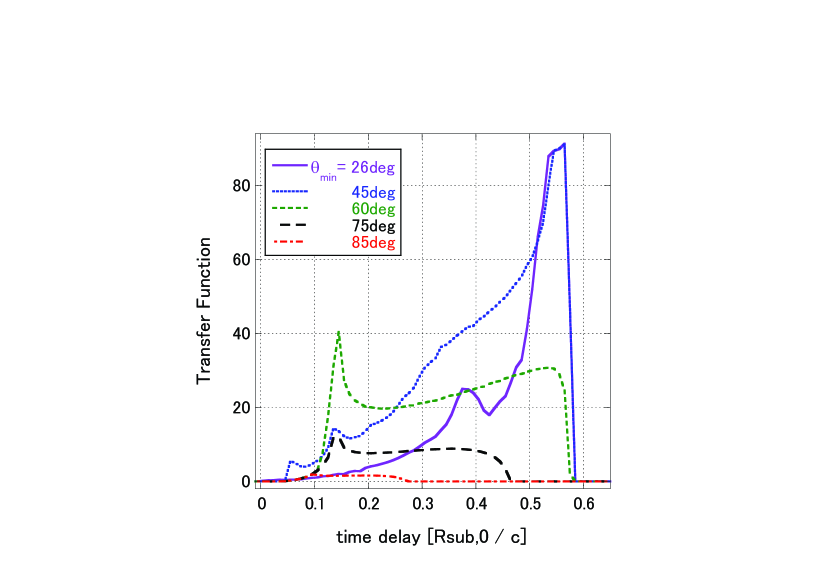
Figure 9 shows transfer functions for various , with and fixed at 25° and 89°, respectively. When the torus thickens from to , the self-occultation selectively veils the region with a short delay at , hence enlarges the delay and reduces the fluence, the width and . In other words, the self-occultation by the region with and hides the rapid response (left horn), which originates in the large () region and becomes visible when the torus gets thin (°). On the other hand, the self-occultation unlikely influences the result for a thin torus. As shown in Section 2.5, a rapid response is obtained when the torus is extremely thin (°), since is small at large .
To see the -dependency more quantitatively, we draw as a function of in the top panel of Figure 10. Clearly, becomes short for thin tori. Therefore, we expect that luminous quasars will show a relatively short time delay in the unit of . For instance, if the torus thickness is reduced for luminous objects, the loci in Figure 7 shown by the solid lines become bent (convex). The computed ranges from 0.16 to 0.47 for in –. In contrast to the -dependency, it seems difficult to explain the observed range (shown as the histogram in Figure 6) by a change of alone.
As the torus becomes thicker, shows a longer delay with a narrower and more heavily skewed profile at due to the torus self-occultation (middle panel). This trend opposes to the results for various viewing angles, where and are positively correlated each other. Although a low is expected for a thin torus (bottom panel), the small implies a large relative variability in the NIR emission.
Next, Figure 9 also shows that the NIR fluence is a strong function of . Qualitatively, it is trivial, since various mean various solid angles of the torus subtended at the central BH, . Here,
| (8) |
However, as shown in numerical results by Nenkova et al. (2008), the NIR flux is not exactly in proportion to . [Therefore, we need a caution when relating the observed NIR-to-UV luminosity ratio with (e.g., Mor & Trakhtenbrot 2011; see also Section 3.3).] Moreover, we let the inner radius of the torus vary with . Thus, it is not obvious how the NIR fluence of our torus model varies with .
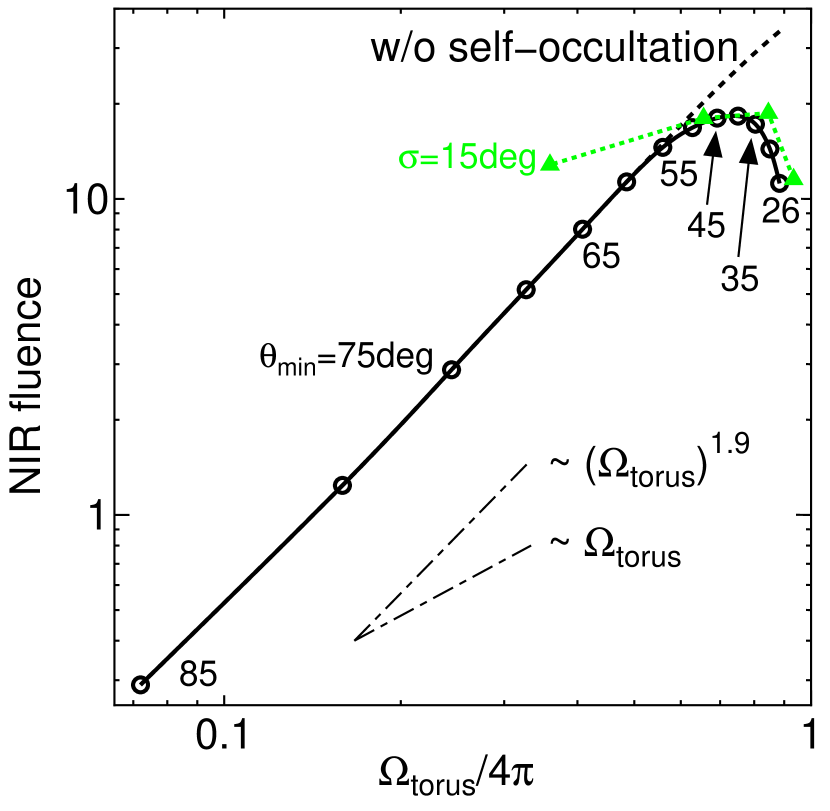
Figure 11 shows that the NIR fluence decreases drastically as increases. A thin torus locates its inner radius at a short distance from the BH (Equation (3) and Figure 2), where the size of clumps is small and the NIR emissivity is low (Section 2.3). For thin tori with °, we find that the NIR fluence is roughly in proportion to . Thus, luminous quasars are expected to show weak NIR emission (blue NIR-to-optical color), which is consistent with the observed trend of the decreasing NIR-to-optical flux ratio with an increasing optical luminosity (Maiolino et al. 2007; Treister et al. 2008; Jiang et al. 2010; Mor et al. 2011). AGNs with very weak NIR emission (such as ”hot-dust-poor” AGNs named by Hao et al. 2010) may indicate that their tori are very thin. For comparison, we also draw the flux densities at 2 m from clumpy tori seen from °, based on a radiative transfer computation (Figure 8 of Nenkova et al. 2008, corrected following its Erratum by Nenkova et al. 2010, and scaled to match with our result at °). They present the results for four different torus semi-thickness , with a gaussian clump distribution. For the smooth boundaries of the torus in the direction, the solid angle is computed as (see Apendix):
| (9) |
which is larger than . The steeper decline of the NIR flux in our result is likely due to the dependency of , in contrast to the constant sublimation radius (resulted from the presumed istropic illumination) in their computations.
Next, we move on to the result for a thick torus. The self-occultation reduces the NIR flux by 55–67% for –, whereas it results in a reduction by % for the fiducial of . Due to the self-occultation, too thick tori with ° exhibit lesser NIR flux (i.e., intrinsically bluer NIR-optical color) than a torus with a moderate thickness with –. The flux reduction of a thick torus compared with a modestly thick torus is again consistent with the result by Nenkova et al. (2008).
Bringing together the two behaviours, both a thick and a thin tori show the weak NIR emission. Namely, a modest thickness of the torus leads to the strongest NIR emission. Therefore, a selection bias will arise such that NIR-selected AGNs tend to possess moderately thick tori.
Compared with the modest torus thickness (), both a thick and a thin tori display the weaker NIR emission (i.e., a bluer NIR-optical color). A thick torus shows a slightly delayed, narrow and largely skewed NIR response. On the other hand, as the torus gets thinner, the NIR response becomes more rapid, narrower, closer to time-symmetric and low.
3.3. Disk Thickness:
When the accretion rate exceeds the Eddington rate (), an optically thick advection-dominated accretion flow (a slim disk) appears (Abramowicz et al. 1988). Since super-Eddington disks are geometrically thick (Abramowicz et al. 1988; Madau 1988), they cannot illuminate the directions near their equatorial plane by the disk self-occultation (Fukue 2000).
As discussed in Paper I, some AGNs with presumably super-Eddington accretion rates show the weak NIR emission (Ark564, TonS180, J0005 and J0303; Rodríguez-Ardila & Mazzalay 2006; Kawaguchi et al. 2004; Jiang et al. 2010; see, however, Hao et al. 2010). Small due to the self-occultation by a geometrically thick disk can be a reason for the weakness. Moreover, the observed data do not support the concept of Eddington-limited accretion (Collin & Kawaguchi 2004). Thus, a strong anisotropy of the disk emission, such as Equation (2) and the disk self-occultation, is required to allow gas infall to super-Eddington accreting sources. In this subsection, we examine the influences of the disk thickness and the accretion rate upon the NIR emission in more detail.
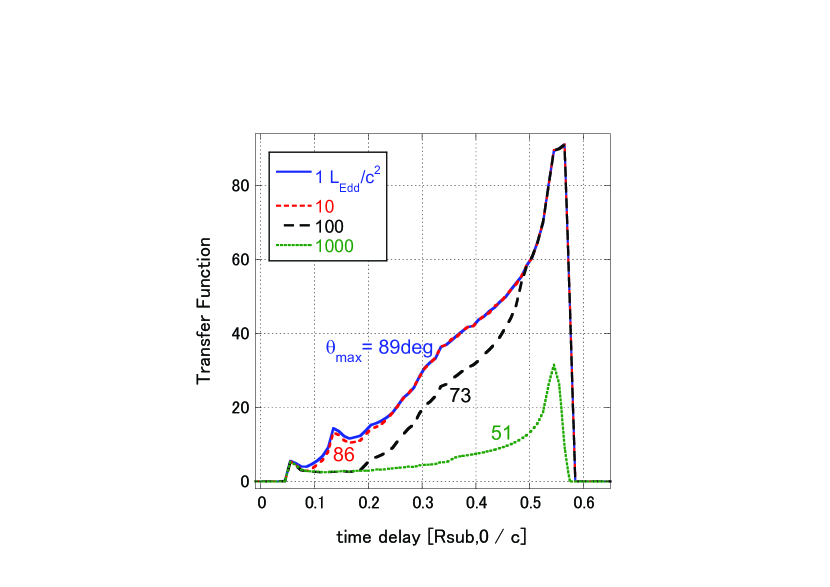
In principle, the disk thickness is a function of the distance from the central BH. Both the illumination spectrum from an AGN disk and the absorption efficiency of dust have their peaks at Far-UV (e.g., Laor & Draine 1993). Therefore, we deduce the disk thickness at the Far-UV emitting region. Based on the work by Kawaguchi (2003; his Figure 5 for a BH), the semi-thickness of the disk (= 90°) at the region with the temperature of (4–5) K are 1°, 4°, 17° and 39°, for the accretion rates of 1, 10, 100 and 1000 , respectively. Comparing the first and the last cases, the solid angle of the torus illuminated by the disk (Equation 8) differs by a factor of 9 (a smaller with a higher accretion rate).
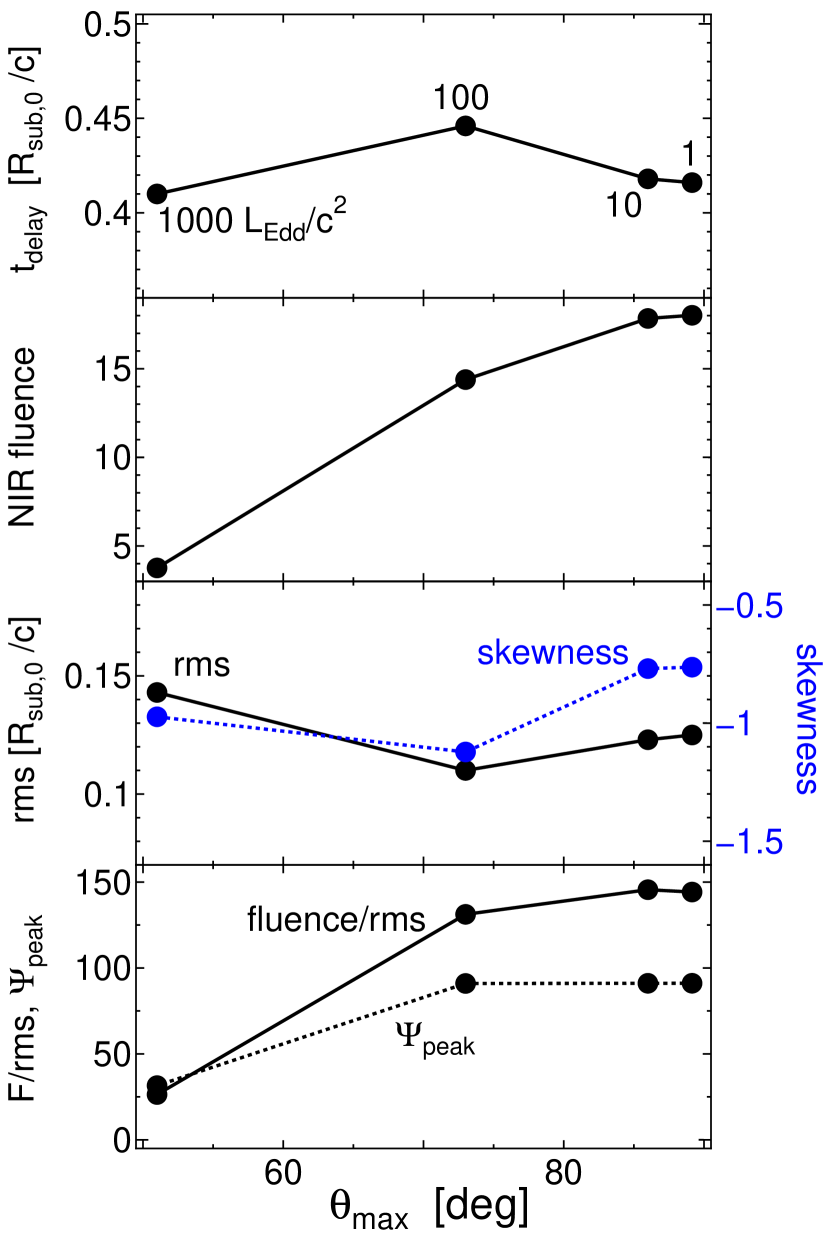
Transfer functions for four accretion rates are presented in Figure 12. As we see in Section 2.5, is insensitive to (top panel of Figure 13). Therefore, the observed broad range of is not reproduced by a change of the accretion rate. Larger accretion rates make the disk thicker and the shade of the disk itself larger (i.e., smaller ; Equation (8)). Thus, the NIR fluence becomes small as the accretion rate increases, as shown in the second panel. By changing the accretion rate from 1 to 1000, the fluence becomes . This is consistent with the weakness of the X-ray emission line from neutral iron, which potentially originates in the illuminated torus, in a narrow-line quasar (Takahashi et al. 2010; cf. Page et al. 2004). Similar to , and are insensitive to (third panel). On the contrary, the height of (bottom panel) is affected by the accretion rates in the sense that super-Eddington sources will show a low absolute variation.
Other than the reduction of and , super-Eddington accretion rates cause another influence upon the NIR flux. Sub-Eddington accretion disks suffer little from the disk self-gravity, hence extend far away from the central BH, radiating across UV, optical and NIR bands (Tomita et al. 2006; Kishimoto et al. 2008). When the accretion rate becomes super-Eddington, the disk self-gravity starts to govern the disk and truncate the outer part of the disk. Due to the truncation, super-Eddington disks do not radiate at NIR (Kawaguchi et al. 2004). To sum up, both small of the torus and the small outer radius of the disk, caused by the high accretion rate, provide less NIR emission.
In contrast to the result for a thin disk with a sub-Eddington accretion rate of , a super-Eddington accretion rate leads to a much weaker NIR emission (with a help of the disk self-gravity) and to a low time response.
Here, we summarise the three dependencies examined above. Only the variation of the viewing angles reproduces the observed range of the time delay. Therefore, we propose that the viewing angle is the key parameter responsible for the observed scatter in the – diagram. A weak NIR emission (such as in hot-dust-poor AGNs in the weakest cases) indicates either a thin torus, a thick torus or the super-Eddington accretion. On the other hand, a stronger NIR flux (a redder NIR-optical color) than the fiducial one is obtained only by a large viewing angle for a modestly thick torus.
4. Misaligned Torus
So far, we have assumed that the rotation axis of the torus is aligned to that of the disk. Since a specific angular momentum is likely larger in the torus than in the disk, the assumption sounds plausible. Indeed, we have examples, where the rotation axes of maser disks are aligned to the jet directions (e.g., Miyoshi et al. 1995; Meisenheimer et al. 2007; Mamyoda et al. 2009). However, there are also a number of examples showing the misalignment between the maser disks and the jets (e.g., Yamauchi et al. 2004; Raban et al. 2009). Random orientation between jets and galactic axes is also reported (Clarke et al. 1998; Nagar & Wilson 1999; Schmitt et al. 2001).
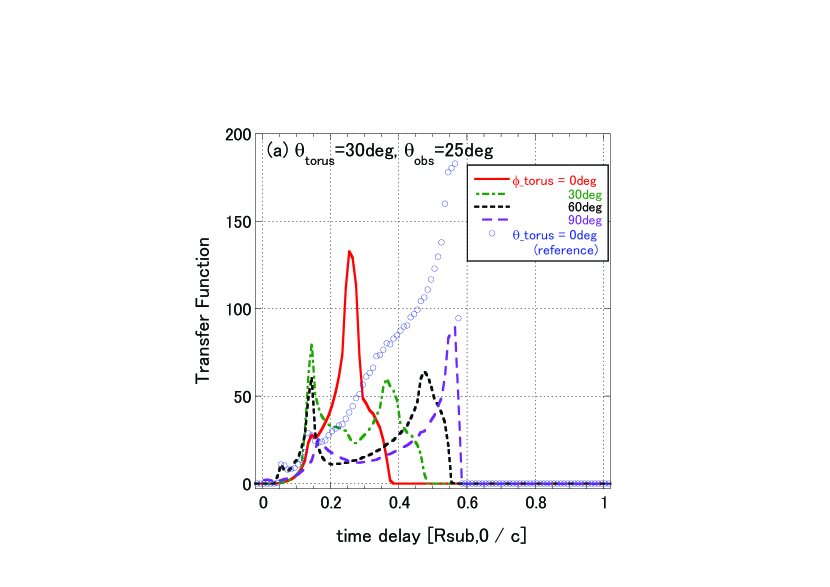
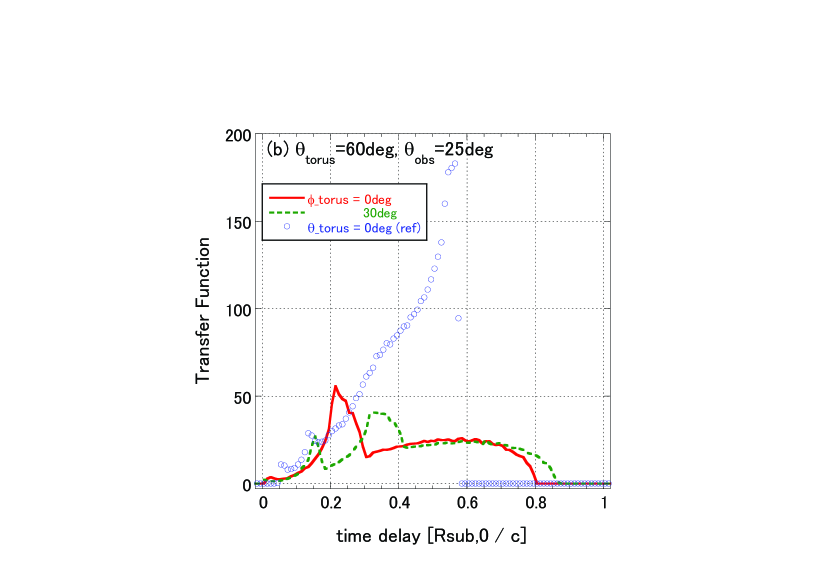
In this section, we investigate the consequences of the misalignment between the torus and the disk axes. Now, we introduce and to specify the rotation axis of the torus relative to that of the disk and the observer (). Figure 2 shows the geometry with ° and °.
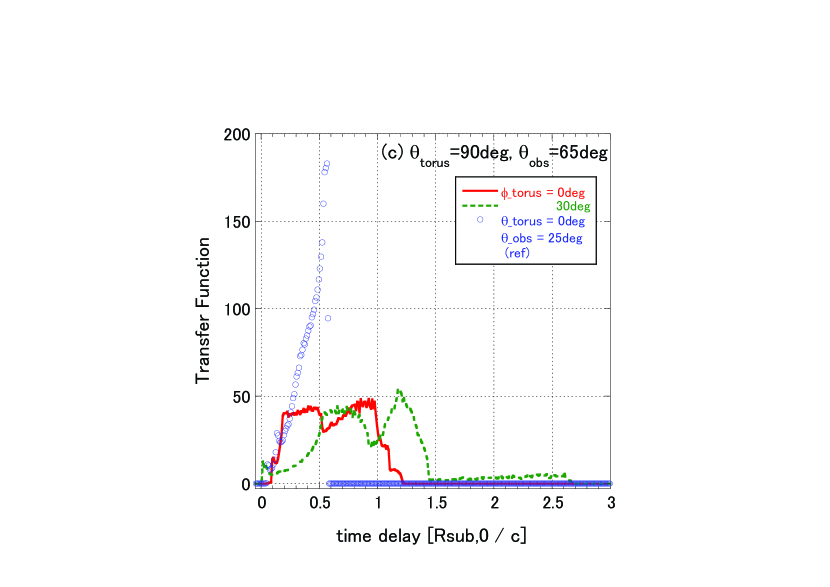
Three are examined; 30°, 60° and 90°. In the first two cases, we adopt of °. Since the direction to of is obscured by the torus if °, of 65° is chosen in the last case. With ° and 90°, the inner edge of the torus at becomes visible. Thus, for these two , we integrate not only from 0 to but also from to . Here, the semi-thickness of the torus and the disk are fixed at 45° and 1° (i.e., ° and °), respectively.
Figure 14 shows the transfer functions (integrating from 0 to ), and Table 1 summarises the results of a series of calculations. For reference, we also show the response of the aligned torus from , which is identical to the twice enlarged version of the dotted line in Figure 3 (obtained by integration). For of 90, the disk illumination flux toward the torus is larger than the flux toward the observer, meaning that the inner radius of the torus is large. Blank fields (and °) in the Table mean that the direction to the observer from the central BH is obscured by the torus with such parameter sets. In other words, a large excludes type-1 AGNs, and is biased to type-2 AGNs.
| ° | ||||
| [deg] | [deg] | |||
| 0 | 30 | 60 | 90 | |
| 0 | ()aaHereafter, the time delay is quoted in this unit. | |||
| Fluence = 36bbNIR fluence for the fiducial parameter set is calculated by integrating from 0 to , which has twice the fluence shown in Sections 2 and 3. | ||||
| = 0.13 | ||||
| = | ||||
| 30 | 0.25 | 0.28 | 0.35 | 0.41 |
| 13 | 13 | 13 | 12 | |
| 0.06 | 0.11 | 0.15 | 0.15 | |
| 60 | 0.43 | 0.47 | ||
| 16 | 17 | |||
| 0.19 | 0.20 | |||
| ° | ||||
| 90 | 0.62 | 0.98 | ||
| 38 | 44 | |||
| 0.28 | 0.50 | |||
A variety of is achieved from 0.25 to 0.98 , which is wide enough to match up with the observed range (Figure 6). A short is obtained for of 30, and is associated with a small NIR fluence. The geometry with ° and ° is similar to a pole-on view of aligned tori (Section 3.1), producing a very narrow NIR response at a short time delay. On the other hand, a large is realized for of 90, accompanied with a fluence similar to the one for the fiducial parameter.
As the torus becomes inclined relative to the disk, the torus hides not only the region with a short delay but also various area of the inner edge of the torus, making the NIR fluence small and the time response complicated. Contributions from , which are observable for of and , appear at a longer time delay. Thus, they tend to increase the time delay, the NIR fluence and the skewness (). With °, the NIR emission from is large enough to compensate the flux reduction due to the torus self-occultation, exhibiting a comparable fluence to the reference result. A long (), if observed in the future, may be a signature of a large (°; i.e., heavily misaligned).
In case the torus self-occultation does not work due to an extremely small volume filling factor of clumps etc (Appendix), an aligned torus shows the NIR response as described in Section 2.5 with . Summing up all the four lines in Figure 4b and multiply the fluence by two (to convert the integration to the 0–2 integration), we obtain the fluence of 140. In contrast, we find that misaligned tori without the self-occultation effect show a yet longer delay with a huge NIR fluence. For instance, for with and for with , and with the fluence of 250 and 960, respectively. Therefore, an extremely long () delay with a big NIR flux would mean a misaligned optically thin torus.
5. Summary
According to recent models, the accretion disk and the BH in AGNs are surrounded by a clumpy torus, with its inner radius governed by the dust sublimation process. Regarding the inner radius of the torus, there was a systematic deviation between the observational results and the theory. In Paper I, we showed that the anisotropy of the disk emission resolves this conflict for a typical type-1 AGN. We found that the anisotropy makes the torus inner region closer to the central BH and concave. Furthermore, the innermost edge of the torus may connect with the outermost edge of the accretion disk continuously.
In this study, we have calculated the NIR flux variation of the torus in response to a UV flash for various geometries of the disk, the torus and the observer. Anisotropic illumination by the disk and the effect of the torus self-occultation contrast our study with earlier works. We have found that both the waning effect of each clump and the torus self-occultation selectively reduce the emission from the region with a short delay. Thus, the resultant NIR time response shows a -dependent delay and an asymmetric profile with a negative skewness, opposing to the results for optically thin tori (Barvainis 1992).
By contrast with the fiducial viewing angle of 25°, a small viewing angle results in a short time delay with a narrow and peaky response. On the other hand, a more inclined viewing angle leads to a longer delay with a broader profile and to a redder NIR-to-optical color. We propose that the red NIR-optical color of type-1.8/1.9 objects is caused by not only the dust extinction but also intrinsically red color. The computed range of coincides with the observed one.
Compared with the modest torus thickness of , both a thick and a thin tori display the weaker NIR emission, consistent with the work by Nenkova et al. (2008). In other words, a modest thickness of the torus leads to the strongest NIR emission. A selection bias is thus expected such that NIR-selected AGNs tend to possess moderately thick tori. For thin tori, we have found that the NIR fluence is in proportion to . As the torus becomes thicker, the NIR response shows a slightly longer delay with a narrower and more heavily skewed profile due to the torus self-occultation. This trend opposes to the viewing angle dependency, where the delay and the width are positively correlated each other. On the contrary, as the torus gets thinner, the NIR response becomes more rapid, narrower, closer to time-symmetric and low.
In contrast to a thin disk with a sub-Eddington accretion rate, a super-Eddington accretion rate leads to a much weaker () NIR emission due to the disk self-occultation and the disk truncation by the self-gravity, and to a low time response.
Among the three dependencies examined for aligned tori, only the variation of the viewing angles reproduces the observed range of the delay. Therefore, we propose that the viewing angle is the key parameter responsible for the observed scatter about the regression line in the v.s. diagram. Conversely, the measurements of are potentially useful to estimate the inclination angles.
We have also investigated the consequences of the misalignment between the torus and the disk axes. A variety of is achieved, which is wide enough to cover the observed range. A short delay is obtained for a small misalignment and is associated with a small NIR fluence, while a a long delay is obtained for a largely misaligned torus with an usual fluence. This trend contrasts with the viewing angle dependency for aligned tori, where a short delay is associated with a normal NIR fluence while a long delay means a large NIR fluence. For highly misaligned cases, contributions from increase the time delay (up to ), the NIR fluence and the skewness ().
In case the torus is optically thin (with an inefficient self-occultation), the time delay of the NIR emission from an aligned torus becomes longer. Moreover, misaligned optically thin tori show a yet longer delay () with a huge NIR flux.
From an observational point of view, these numerical results are summarised as follows. If the observed time delay of the NIR emission is short, it will mean either a small viewing angle, a geometrically thin torus, or a slightly misaligned torus. If the delay is long, on the other hand, it indicates either an inclined viewing angle, an aligned optically thin torus, or a largely misaligned torus. An extremely long delay () would mean a misaligned optically thin torus. As to the NIR flux, a blue NIR-to-optical color (i.e., a weak NIR emission such as in hot-dust-poor AGNs in the weakest cases) indicates either a geometrically thin torus, a geometrically thick torus, a super-Eddington accretion, or a slight misalignment between the torus and the disk. On the other hand, a red NIR-optical color (a large NIR emission) means a large viewing angle with a modest geometrical thickness of the torus or a largely misaligned optically thin torus.
Appendix A Optical Thickness of Clumpy Tori
We briefly summarise the basic properties of clumps in the torus. The main aim here is to deduce the optical thickness of the clumpy torus. If it is optically thin at NIR (as Barvainis 1992 assumed), we need to consider the NIR emission from all the clumps including those at the far side of the torus which is illuminated by the back side (relative to the observer) of the accretion disk. In contrast, if it is optically thick, the torus self-occultation should be incorporated appropriately.
Each clump located at a distance of from the central BH is characterised by the radius of and the mass of . Clumps that survive against its own thermal pressure and tidal shearing by the BH must be heavier than the Jeans mass and/or more compact than the tidal (Hill or Roche) radius (e.g., Vollmer et al. 2004). Marginally stable clumps, at the boundary of these criteria, have the following various quantities (Hönig & Beckert 2007),
| (A1) | |||||
| (A2) | |||||
| (A3) | |||||
| (A4) |
Here, , , and are the mean density in the clump, the column density of the clump, the sound speed in the clump and the proton mass, respectively. The normalization in (corresponding to cm-3) is consistent with the observed lower limit for the mean number density ( cm-3; Geballe et al. 2006; Shirahata et al. 2007). Incidentally, clumps in the broad line region (at cm) have their sizes around 1013 cm (Risaliti et al. 2009; Maiolino et al. 2010), consistent with the extrapolation of Equation (A1) to smaller . However, their density () and [] are much less than those expected from Equations (A3) and (A4).
The column density above means Compton-thick (), and corresponds to optical depths at - and -bands of 1400 and 160, respectively, using the conventional extinction law (Savage & Mathis 1979; Cardelli et al. 1989). In radiative transfer calculations of AGN tori, clumps with optical depth at -band of – are often adopted (Nenkova et al. 2008; Hönig et al. 2008; Deo et al. 2011). Krolik & Begelman (1988) estimates to be ( one tenth of Equation (A4)). Even with such a reduction of the clump opacity by –, each clump is still opaque to NIR photons.
Therefore, optical thickness of the torus is simply related to the probability that the incoming rays hit clumps. We treat the two directions separately: one in the vertical direction (parallel to the rotation axis) with a suffix of , and another along the equatorial plane with a suffix of . The key parameter here is the volume filling factor of clumps in the torus , for which we assume 0.03 (Vollmer et al. 2004). By writing the number density of clumps in the torus by ,
| (A5) | |||||
| (A6) | |||||
| (A7) |
where we assume the thickness of the torus to be . Now, means the mean number of clumps along the ray, and a fraction of the incoming rays pass through the torus without encountering any clumps (Natta & Panagia 1984; Nenkova et al. 2002).
If we adopt the clump size in Equation (A1), then
| (A8) |
Assuming that clumps are mainly heated by the direct illumination from the central accretion disk (i.e. ignoring the irradiation from nearby clumps), the clump temperature will be proportional to , with being the illumination luminosity (cf. Nenkova et al. 2008). Therefore, the size of torus emission is larger for larger at longer , in the form (Tristram et al. 2009). Then, we assume for as follows,
| (A9) |
with being the Eddington luminosity. In summary,
| (A10) |
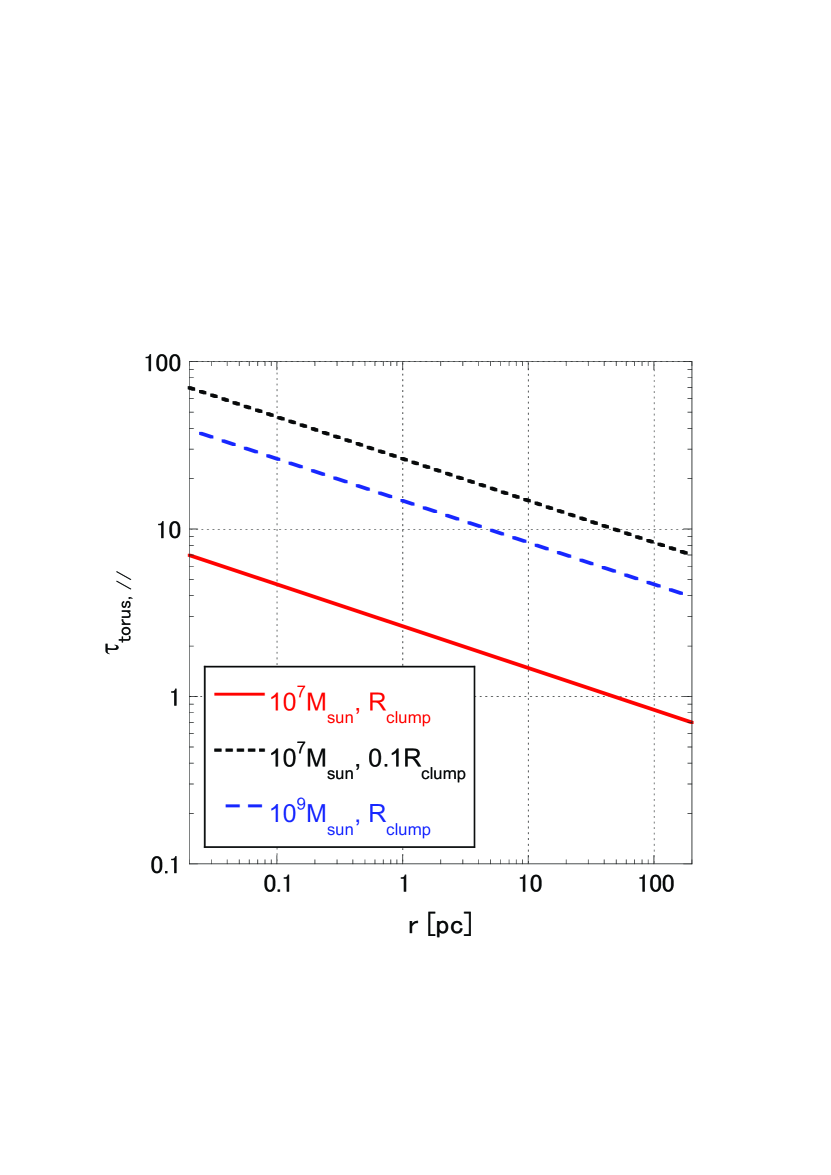
Figure 15 shows the optical thickness of the clumpy torus as a function of . Throughout, we fix , and so that these in parentheses in Equation (A10) equal unity. For instance, is about five at of 0.1pc.
The radius where the torus is opaque is achieved by setting :
| (A11) |
The inner part within this radius of the torus is likely optically thick. In this study, we therefore consider basically emission from the near side of the torus, as we did in Paper I. This assumption can be tested in principle via the profile of broad emission lines and its time variation (e.g., Peterson 2001). If some indications of the emission from the far side of the torus is observed, the volume filling factor seems extremely low () or the torus is very thin ().
Similarly, we deduce the optical thickness perpendicular to the rotation axis , which is equivalent to (the average number of clumps along radial equatorial rays) denoted by Nenkova et al. (2008). They showed that is likely between 5 and 15, consistent with our estimation below. Adopting the inner radius of and the clump size in Equation (A1),
| (A12) | |||||
| (A13) |
Here, we assume . Since this optical thickness is also larger than unity, we restrict ourselves to non-obscured objects (i.e., the geometry where the line of sight to the central BH is not blocked by the torus).
References
- Abramowicz et al. (1988) Abramowicz, M. A., Czerny, B., Lasota, J. P., & Szuszkiewicz, E. 1988, ApJ, 332, 646
- Alonso-Herrero et al. (2003) Alonso-Herrero, A., Quillen, A. C., Rieke, G. H., Ivanov, V. D., & Efstathiou, A. 2003, AJ, 126, 81
- Antonucci (1993) Antonucci, R. 1993, ARA&A, 31, 473
- Antonucci & Miller (1985) Antonucci, R. R. J., & Miller, J. S. 1985, ApJ, 297, 621
- Arshakian (2005) Arshakian, T. G. 2005, A&A, 436, 817
- Barvainis (1987) Barvainis, R. 1987, ApJ, 320, 537
- Barvainis (1992) Barvainis, R. 1992, ApJ, 400, 502
- Beckert & Duschl (2004) Beckert, T., & Duschl, W. J. 2004, A&A, 426, 445
- Blandford & McKee (1982) Blandford, R. D., & McKee, C. F. 1982, ApJ, 255, 419
- Bottorff et al. (1997) Bottorff, M., Korista, K. T., Shlosman, I., & Blandford, R. D. 1997, ApJ, 479, 200
- Cardelli et al. (1989) Cardelli, J. A., Clayton, G. C., & Mathis, J. S. 1989, ApJ, 345, 245
- Clarke et al. (1998) Clarke, C. J., Kinney, A. L., & Pringle, J. E. 1998, ApJ, 495, 189
- Clavel et al. (1989) Clavel, J., Wamsteker, W., & Glass, I. S. 1989, ApJ, 337, 236
- Collin & Kawaguchi (2004) Collin, S., & Kawaguchi, T. 2004, A&A, 426, 797
- Deo et al. (2011) Deo, R. P., Richards, G. T., Nikutta, R., Elitzur, M., Gallagher, S. C., Ivezić, Ž., & Hines, D. 2011, ApJ, 729, 108
- Dullemond & van Bemmel (2005) Dullemond, C. P., & van Bemmel, I. M. 2005, A&A, 436, 47
- Edelson & Malkan (1986) Edelson, R. A., & Malkan, M. A. 1986, ApJ, 308, 59
- Efstathiou & Rowan-Robinson (1995) Efstathiou, A., & Rowan-Robinson, M. 1995, MNRAS, 273, 649
- Eguchi et al. (2009) Eguchi, S., Ueda, Y., Terashima, Y., Mushotzky, R., & Tueller, J. 2009, ApJ, 696, 1657
- Elitzur & Shlosman (2006) Elitzur, M., & Shlosman, I. 2006, ApJ, 648, L101
- Emmering et al. (1992) Emmering, R. T., Blandford, R. D., & Shlosman, I. 1992, ApJ, 385, 460
- Francis (1993) Francis, P. J. 1993, ApJ, 405, 119
- Fukue (2000) Fukue, J. 2000, PASJ, 52, 829
- Fukue & Sanbuichi (1993) Fukue, J., & Sanbuichi, K. 1993, PASJ, 45, 135
- (25) Gaskell, C.M., & Benker, A.J. 2007, astro-ph/0711.1013
- (26) Gaskell, C.M., Klimek E.S. Nazarova L.S. 2007, astro-ph/0711.1025
- Geballe et al. (2006) Geballe, T. R., Goto, M., Usuda, T., Oka, T., & McCall, B. J. 2006, ApJ, 644, 907
- Glass (1992) Glass, I. S. 1992, MNRAS, 256, 23P
- Glass (2004) Glass, I. S. 2004, MNRAS, 350, 1049
- Granato & Danese (1994) Granato, G. L., & Danese, L. 1994, MNRAS, 268, 235
- Hao et al. (2010) Hao, H., et al. 2010, ApJ, 724, L59
- Hasinger (2008) Hasinger, G. 2008, A&A, 490, 905
- Hönig & Beckert (2007) Hönig, S. F., & Beckert, T. 2007, MNRAS, 380, 1172
- Hönig et al. (2006) Hönig, S. F., Beckert, T., Ohnaka, K., & Weigelt, G. 2006, A&A, 452, 459
- Hubeny et al. (2000) Hubeny, I., Agol, E., Blaes, O., & Krolik, J. H. 2000, ApJ, 533, 710
- Ibar & Lira (2007) Ibar, E., & Lira, P. 2007, A&A, 466, 531
- Jiang et al. (2010) Jiang, L., et al. 2010, Nature, 464, 380
- Kawaguchi (2003) Kawaguchi, T. 2003, ApJ, 593, 69
- Kawaguchi et al. (1998) Kawaguchi, T., Mineshige, S., Umemura, M., & Turner, E. L. 1998, ApJ, 504, 671
- Kawaguchi & Mori (2010) Kawaguchi, T., & Mori, M. 2010, ApJ, 724, L183 (Paper I)
- Kawaguchi et al. (2004) Kawaguchi, T., Pierens, A., & Huré, J.-M. 2004, A&A, 415, 47
- Kishimoto et al. (2008) Kishimoto, M., Antonucci, R., Blaes, O., Lawrence, A., Boisson, C., Albrecht, M., & Leipski, C. 2008, Nature, 454, 492
- Kishimoto et al. (2009) Kishimoto, M., Hönig, S. F., Antonucci, R., Kotani, T., Barvainis, R., Tristram, K. R. W., & Weigelt, G. 2009, A&A, 507, L57
- Kishimoto et al. (2007) Kishimoto, M., Hönig, S. F., Beckert, T., & Weigelt, G. 2007, A&A, 476, 713
- Kobayashi et al. (1993) Kobayashi, Y., Sato, S., Yamashita, T., Shiba, H., & Takami, H. 1993, ApJ, 404, 94
- Koshida et al. (2009) Koshida, S., et al. 2009, ApJ, 700, L109
- Krolik & Begelman (1988) Krolik, J. H., & Begelman, M. C. 1988, ApJ, 329, 702
- La Franca et al. (2005) La Franca, F., et al. 2005, ApJ, 635, 864
- Laor (2004) Laor, A. 2004, AGN Physics with the Sloan Digital Sky Survey, 311, 169
- Laor & Draine (1993) Laor, A., & Draine, B. T. 1993, ApJ, 402, 441
- Laor & Netzer (1989) Laor, A., & Netzer, H. 1989, MNRAS, 238, 897
- Levenson et al. (2002) Levenson, N. A., Krolik, J. H., Życki, P. T., Heckman, T. M., Weaver, K. A., Awaki, H., & Terashima, Y. 2002, ApJ, 573, L81
- Lawrence (1991) Lawrence, A. 1991, MNRAS, 252, 586
- Madau (1988) Madau, P. 1988, ApJ, 327, 116
- (55) Maiolino, R., Marconi, A., & Oliva E. 2001, A&A, 365, 37
- Maiolino et al. (2007) Maiolino, R., Shemmer, O., Imanishi, M., Netzer, H., Oliva, E., Lutz, D., & Sturm, E. 2007, A&A, 468, 979
- Maiolino et al. (2010) Maiolino, R., et al. 2010, A&A, 517, A47
- Mamyoda et al. (2009) Mamyoda, K., Nakai, N., Yamauchi, A., Diamond, P., & Huré, J.-M. 2009, PASJ, 61, 1143
- Meisenheimer et al. (2007) Meisenheimer, K., et al. 2007, A&A, 471, 453
- Miller & Goodrich (1990) Miller, J. S., & Goodrich, R. W. 1990, ApJ, 355, 456
- Minezaki et al. (2004) Minezaki, T., Yoshii, Y., Kobayashi, Y., Enya, K., Suganuma, M., Tomita, H., Aoki, T., & Peterson, B. A. 2004, ApJ, 600, L35
- Miyoshi et al. (1995) Miyoshi, M., Moran, J., Herrnstein, J., Greenhill, L., Nakai, N., Diamond, P., & Inoue, M. 1995, Nature, 373, 127
- Mor et al. (2009) Mor, R., Netzer, H., & Elitzur, M. 2009, ApJ, 705, 298
- Mor & Trakhtenbrot (2011) Mor, R., & Trakhtenbrot, B. 2011, arXiv:1105.3198
- Nagar & Wilson (1999) Nagar, N. M., & Wilson, A. S. 1999, ApJ, 516, 97
- Natta & Panagia (1984) Natta, A., & Panagia, N. 1984, ApJ, 287, 228
- Nelson (1996) Nelson, B. O. 1996, ApJ, 465, L87
- Nenkova et al. (2002) Nenkova, M., Ivezić, Ž., & Elitzur, M. 2002, ApJ, 570, L9
- Nenkova et al. (2008) Nenkova, M., Sirocky, M. M., Nikutta, R., Ivezić, Ž., & Elitzur, M. 2008, ApJ, 685, 160
- Nenkova et al. (2010) Nenkova, M., Sirocky, M. M., Nikutta, R., Ivezić, Ž., & Elitzur, M. 2010, ApJ, 723, 1827
- Netzer (1985) Netzer, H. 1985, MNRAS, 216, 63
- Netzer (1987) Netzer, H. 1987, MNRAS, 225, 55
- Netzer (1990) Netzer, H. 1990, in Active Galactic Nuclei, ed. R. D. Blandford, H. Netzer, & L. Woltjer (Berlin: Springer), 57
- Neugebauer et al. (1979) Neugebauer, G., Oke, J. B., Becklin, E. E., & Matthews, K. 1979, ApJ, 230, 79
- Noguchi et al. (2010) Noguchi, K., Terashima, Y., Ishino, Y., Hashimoto, Y., Koss, M., Ueda, Y., & Awaki, H. 2010, ApJ, 711, 144
- Oknyanskij & Horne (2001) Oknyanskij, V. L., & Horne, K. 2001, Probing the Physics of Active Galactic Nuclei, 224, 149
- Oknyanskij et al. (1999) Oknyanskij, V. L., Lyuty, V. M., Taranova, O. G., & Shenavrin, V. I. 1999, Astronomy Letters, 25, 483
- Page et al. (2004) Page, K. L., O’Brien, P. T., Reeves, J. N., & Turner, M. J. L. 2004, MNRAS, 347, 316
- Peterson (2001) Peterson, B. M. 2001, in Advanced Lectures on the Starburst-AGN Connection, ed. I. Aretxaga, D. Kunth, and R. Mujica (Singapore: World Scientific), 3
- Phillips & Meszaros (1986) Phillips, K. C., & Meszaros, P. 1986, ApJ, 310, 284
- Pier & Krolik (1992) Pier, E. A., & Krolik, J. H. 1992, ApJ, 401, 99
- Pier & Krolik (1993) Pier, E. A., & Krolik, J. H. 1993, ApJ, 418, 673
- Pogge (1989) Pogge, R. W. 1989, ApJ, 345, 730
- Pott et al. (2010) Pott, J.-U., Malkan, M. A., Elitzur, M., Ghez, A. M., Herbst, T. M., Schödel, R., & Woillez, J. 2010, ApJ, 715, 736
- Raban et al. (2009) Raban, D., Jaffe, W., Röttgering, H., Meisenheimer, K., & Tristram, K. R. W. 2009, MNRAS, 394, 1325
- Radovich et al. (1999) Radovich, M., Klaas, U., Acosta-Pulido, J., & Lemke, D. 1999, A&A, 348, 705
- Rees et al. (1969) Rees, M. J., Silk, J. I., Werner, M. W., & Wickramasinghe, N. C. 1969, Nature, 223, 788
- Risaliti et al. (2009) Risaliti, G., et al. 2009, MNRAS, 393, L1
- Rodríguez-Ardila & Mazzalay (2006) Rodríguez-Ardila, A., & Mazzalay, X. 2006, MNRAS, 367, L57
- Sakata et al. (2011) Sakata, Y., Morokuma, T., Minezaki, T., Yoshii, Y., Kobayashi, Y., Koshida, S., & Sameshima, H. 2011, ApJ, 731, 50
- Savage & Mathis (1979) Savage, B. D., & Mathis, J. S. 1979, ARA&A, 17, 73
- Schartmann et al. (2008) Schartmann, M., Meisenheimer, K., Camenzind, M., Wolf, S., Tristram, K. R. W., & Henning, T. 2008, A&A, 482, 67
- Schmitt et al. (2001) Schmitt, H. R., Antonucci, R. R. J., Ulvestad, J. S., Kinney, A. L., Clarke, C. J., & Pringle, J. E. 2001, ApJ, 555, 663
- Schmitt & Kinney (1996) Schmitt, H. R., & Kinney, A. L. 1996, ApJ, 463, 498
- Shakura & Sunyaev (1973) Shakura, N. I., & Sunyaev, R. A. 1973, A&A, 24, 337
- Shirahata et al. (2007) Shirahata, M., Nakagawa, T., Goto, M., Usuda, T., Suto, H., & Geballe, T. R. 2007, The Central Engine of Active Galactic Nuclei, 373, 505
- Simpson (2005) Simpson, C. 2005, MNRAS, 360, 565
- Suganuma et al. (2004) Suganuma, M., et al. 2004, ApJ, 612, L113
- Suganuma et al. (2006) Suganuma, M., et al. 2006, ApJ, 639, 46
- Sun & Malkan (1989) Sun, W.-H., & Malkan, M. A. 1989, ApJ, 346, 68
- Sunyaev & Titarchuk (1985) Sunyaev, R. A., & Titarchuk, L. G. 1985, A&A, 143, 374
- Swain et al. (2003) Swain, M., et al. 2003, ApJ, 596, L163
- Takahashi et al. (2010) Takahashi, H., Hayashida, K., & Anabuki, N. 2010, PASJ, 62, 1483
- Telesco et al. (1984) Telesco, C. M., Becklin, E. E., Wynn-Williams, C. G., & Harper, D. A. 1984, ApJ, 282, 427
- Tomita et al. (2006) Tomita, H., et al. 2006, ApJ, 652, L13
- Treister et al. (2008) Treister, E., Krolik, J. H., & Dullemond, C. 2008, ApJ, 679, 140
- Tristram et al. (2009) Tristram, K. R. W., et al. 2009, A&A, 502, 67
- Ueda et al. (2003) Ueda, Y., Akiyama, M., Ohta, K., & Miyaji, T. 2003, ApJ, 598, 886
- Ueda et al. (2007) Ueda, Y., et al. 2007, ApJ, 664, L79
- Vollmer et al. (2004) Vollmer, B., Beckert, T., & Duschl, W. J. 2004, A&A, 413, 949
- Wada & Norman (2002) Wada, K., & Norman, C. A. 2002, ApJ, 566, L21
- Wilson & Tsvetanov (1994) Wilson, A. S., & Tsvetanov, Z. I. 1994, AJ, 107, 1227
- Yamauchi et al. (2004) Yamauchi, A., Nakai, N., Sato, N., & Diamond, P. 2004, PASJ, 56, 605