The Hyperactive L Dwarf 2MASS J131530942649513: Continued Emission and a Brown Dwarf Companion111Data presented herein were obtained at the W. M. Keck Observatory, which is operated as a scientific partnership among the California Institute of Technology, the University of California and the National Aeronautics and Space Administration, and made possible by the generous financial support of the W. M. Keck Foundation; and with the 6.5-m Magellan Telescopes located at Las Campanas Observatory, Chile.
Abstract
We report new observations of the unusually active, high proper motion L5e dwarf 2MASS J131530942649513. Optical spectroscopy with Magellan/MagE reveals persistent nonthermal emission, with narrow H I Balmer, Na I and K I lines all observed in emission. Low-resolution near-infrared spectroscopy with IRTF/SpeX indicates the presence of a low-temperature companion, which is resolved through multi-epoch laser guide star adaptive optics imaging at Keck. The comoving companion is separated by 3384 mas, and its relative brightness ( = 5.090.10) makes this system the second most extreme flux ratio very low-mass binary identified to date. Resolved near-infrared spectroscopy with Keck/OSIRIS identifies this companion as a T7 dwarf. The absence of Li I absorption in combined-light optical spectroscopy constrains the system age to 0.8–1.0 Gyr, while the system’s kinematics and unusually low mass ratio (M2/M1 = 0.3–0.6) suggests that it is even older. A coevality test of the components also indicates an older age, but reveals discrepancies between evolutionary and atmosphere model fits of the secondary which are likely attributable to poor reproduction of its near-infrared spectrum. With a projected separation of 6.60.9 AU, the 2MASS J13152649 system is too widely separated for mass exchange or magnetospheric interactions to be powering its persistent nonthermal emission. Rather, the emission is probably chromospheric in nature, signaling an inversion in the age-activity relation in which strong magnetic fields are maintained by relatively old and massive ultracool dwarfs.
Subject headings:
binaries: visual — stars: chromospheres — stars: individual (2MASS J131530942649513 (catalog )) — stars: low mass, brown dwarfs — stars: magnetic fields1. Introduction
Nonthermal emission is commonly observed among the lowest-mass stars, traced by optical line (e.g., Ca II, H I sequence), X-ray, UV and radio emission. This emission can be both persistent (quiescent) and eruptive, with short-duration flares from M dwarfs occurring at a rate of roughly 3% (Hilton et al., 2010). The incidence and strength of quiescent magnetic activity as traced by the H line reaches 80% and 4, respectively, among nearby late-type M dwarfs (Gizis et al., 2000; West et al., 2004, 2011; Schmidt et al., 2007), but both metrics decline precipitously for the cooler L and T dwarfs (Burgasser et al., 2002b; Schmidt et al., 2007, 2010) and sources far from the Galactic plane (West et al., 2006, 2008). Similar declines are seen in X-ray emission, but surprisingly not at radio frequencies (Berger, 2002; Burgasser & Putman, 2005; Berger, 2006; Antonova et al., 2008). Assuming that this nonthermal emission arises from magnetic interaction, the decline with vertical scale height among M dwarfs is likely an age effect, as angular momentum loss over time results in weakened magnetic dynamos. However, spin-down timescales exceed 5 Gyr beyond spectral type M5 (West et al., 2008), and many late-type dwarfs are found to be rapid rotators (P 2-10 hr; Mohanty & Basri 2003; Zapatero Osorio et al. 2006; Reiners & Basri 2008) exhibiting kilogauss magnetic fields at their photospheres (Reiners & Basri, 2007; Hallinan et al., 2008). Hence, the decline in magnetic emission with spectral type must arise from a different effect. The favored cause is the decoupling of cooler, increasingly neutral photospheres from magnetic structures, which reduces magnetic stresses and the frequency of magnetic reconnection above the (sub)stellar surface (e.g., Meyer & Meyer-Hofmeister 1999; Mohanty et al. 2002; Gelino et al. 2002). Deeper reconnection events may continue to power strong flaring bursts observed in a handful of weakly active or inactive late-M and L dwarfs (e.g., Reid et al. 1999; Liebert et al. 2003; Schmidt et al. 2007).
Contrary to these trends, a very rare set of low-temperature “hyperactive” dwarfs exhibit unusually prodigious and persistent nonthermal emission. One of the first examples of these to be identified was 2MASS J131530942649513 (hereafter 2MASS J13152649; Hall 2002b; Gizis 2002), a high proper motion L5e dwarf which has exhibited sustained but variable H emission on no fewer than seven epochs spanning nearly a decade (Hall, 2002b, a; Gizis, 2002; Liebert et al., 2003; Fuhrmeister et al., 2005; Barrado Y Navascués, 2006; Kirkpatrick et al., 2008). With 4, 2MASS J13152649 is as active as a mid-type M dwarf, but is 1–2 orders of magnitude brighter in H than comparably-classified L dwarfs (Gizis et al., 2000; Schmidt et al., 2007). In addition, H and Na I D lines have also been observed in emission (Fuhrmeister et al., 2005). Since the photosphere of 2MASS J13152649 is cool and likely to be highly neutral, the origin of its unexpected emission remains a mystery. Neither the kinematics nor spectral characteristics of 2MASS J13152649 indicate youth, and the absence of mid-infrared excess argues against accretion from a protoplanetary or debris disk (Riaz & Gizis, 2007). Other hyperactive dwarfs, such as the L1e dwarf 2MASS J10224821+5825453 ( 3.5 to 2.7; Schmidt et al. 2007) and the T6.5e dwarf 2MASS J1237392+652615 ( 4.6 to 4.2; Burgasser et al. 2000, 2002b; Liebert & Burgasser 2007; hereafter 2MASS J1237+6526) also lack evidence of disk accretion and do not appear to be particularly young. Alternative mechanisms, such as acoustic heating, unusually strong magnetic fields, and Roche lobe overflow from a substellar companion have been proposed, but none of these scenarios have been validated.
In this article, we report new observations of 2MASS J13152649 that reveal both continued nonthermal optical line emission in several neutral atomic species, and the presence of a T dwarf companion at a projected separation of 7 AU. In Section 2 we describe our combined-light optical and near-infrared spectroscopic observations, the latter of which yields preliminary evidence for a brown dwarf companion. In Section 3 we describe adaptive optics (AO) imaging and spectroscopic observations that confirm the presence of the companion and allow determination of its separation and classification. In Section 4 we analyze the observed and inferred physical properties of the components, the latter based on comparison to evolutionary and atmospheric models. We also perform a coevality test to examine the reliability of these models. In Section 5 we discuss how the properties of 2MASS J13152649 argue for a magnetic origin to its persistent emission, powered by a strong magnetic field retained by a relatively old and massive cool dwarf. We summarize our results in Section 6.
2. Observations: Combined Light Spectroscopy
2.1. Magellan/MagE Optical Spectroscopy
Moderate-resolution optical spectra of 2MASS J13152649 were obtained on 2011 March 26 (UT) with the Magellan Echellette (MagE; Marshall et al. 2008), mounted on the 6.5m Landon Clay Telescope at Las Campanas Observatory. Conditions during the observations were clear with 06 seeing. Two exposures totaling 3000 s were obtained at an average airmass of 1.003 using the 07 slit aligned with the parallactic angle; this setup provided 3200–10050 Å spectroscopy at a resolution 4000. We also observed the spectrophotometric flux standard EG 274 (Hamuy et al., 1994) on the same night for flux calibration. ThAr lamps were obtained after each source observation for wavelength calibration, and internal quartz and dome flat field lamps were obtained during the night for pixel response calibration. Data were reduced using the MASE reduction pipeline (Bochanski et al., 2009), following standard procedures for order tracing, flat field correction, wavelength calibration (including heliocentric correction), optimal source extraction, order stitching, and flux calibration.
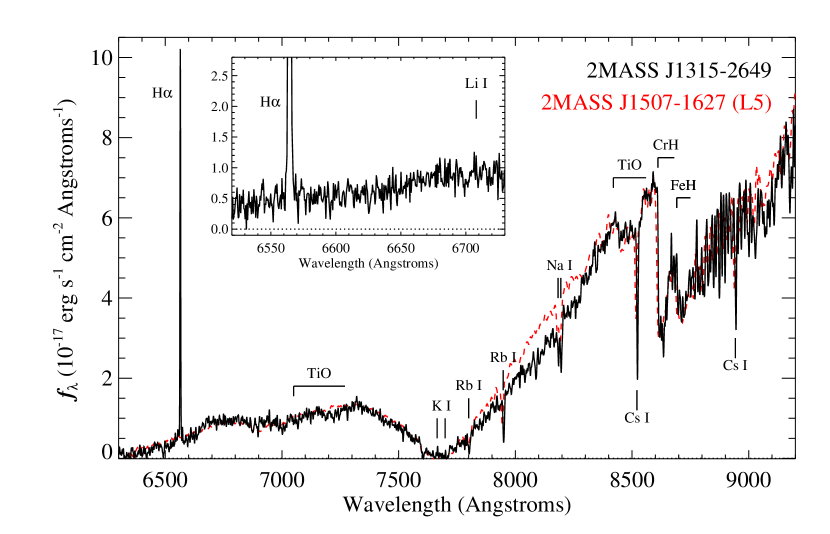
The red portion of the reduced spectrum is shown in Figure 1, flux-calibrated to an apparent -band magnitude of 20.160.14 as estimated from Two Micron All Sky Survey (2MASS) photometry and a mean = 4.970.13 color for L5 dwarfs (Schmidt et al., 2010). We confirm the characteristic mid-L dwarf features identified in previous studies, including strong FeH and CrH bands; weak TiO absorption (relative to late-M and early-L dwarfs); line absorption from Na I, Rb I and Cs I; and the strongly pressure-broadened 7700 Å K I doublet. The overall spectral shape is well-matched to the L5 dwarf 2MASS J150747691627386 (Reid et al., 2000), consistent with previously reported classifications (Gizis, 2002; Kirkpatrick et al., 2008). We confirm the absence of 6710 Å Li I absorption as reported by Kirkpatrick et al. (2008) to an equivalent width (EW) limit of 0.5 Å. This is well below measured EWs for equivalently-classified L dwarfs (e.g., Kirkpatrick et al. 2000). We also see no evidence of any peculiar spectral features associated with low surface gravities, such as enhanced VO absorption or weakened alkali lines (Kirkpatrick et al., 2006; Cruz et al., 2009). Line center measurements of the alkali lines indicate a heliocentric radial velocity of 79 km s-1.
| Species | Equivalent Width | Line Flux | |
|---|---|---|---|
| (Å) | (10-17 erg s-1 cm-2) | ||
| Absorption | |||
| Li I (6710 Å) | 0.5 | ||
| Rb I (7802 Å) | 4.90.8 | ||
| Rb I (7950 Å) | 5.40.6 | ||
| Na I (8186 Å) | 1.20.3 | ||
| Na I (8197 Å) | 2.50.3 | ||
| Cs I (8523 Å) | 4.20.2 | ||
| Cs I (8946 Å) | 2.90.7 | ||
| Emission | |||
| H (4342 Å) | aaNo continuum available to measure an equivalent width. | 4.01.8 | -5.120.20 |
| H (4863 Å) | aaNo continuum available to measure an equivalent width. | 13.11.5 | -4.610.08 |
| H (6565 Å) | 584 | 34.91.2 | -4.180.06 |
| Na I (5892 Å) | aaNo continuum available to measure an equivalent width. | 1.60.2 | -5.500.08 |
| Na I (5898 Å) | aaNo continuum available to measure an equivalent width. | 2.10.3 | -5.400.08 |
| K I (7667 Å) | aaNo continuum available to measure an equivalent width. | 0.60.1 | –5.920.10 |
| K I (7701 Å) | aaNo continuum available to measure an equivalent width. | 0.90.2 | –5.790.13 |
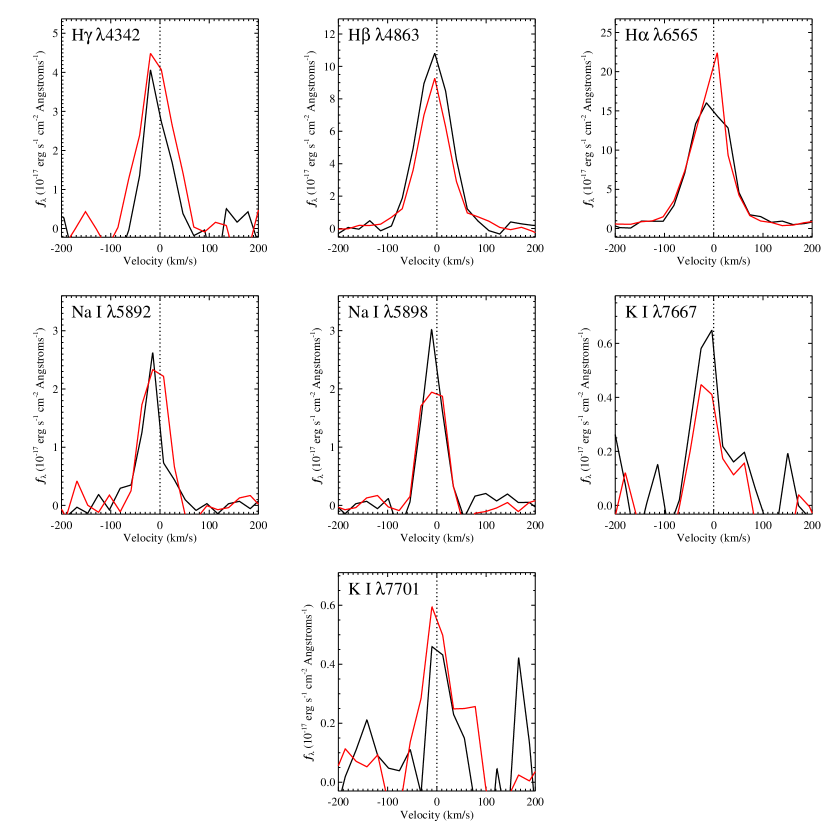
The most striking feature in the optical spectrum of 2MASS J13152649 is its pronounced H emission. We measure an equivalent width of 584 Å in the MagE data, in the middle of prior measurements that span 24 to 160 Å. We also detect H (4342 Å) and H (4863 Å) in emission, and confirm the presence of Na I emission as reported in Fuhrmeister et al. (2005). In addition, we detect weak emission in the cores of the 7700 Å K I doublets, but no emission from the 5877 Å He I D3 (EW 18 Å) or 8500–8660 Å Ca II triplet lines (EW 0.3 Å).222We were unable to quantify the presence or absence of the 3935 and 3970 Å Ca II H & K lines due to an error in the reduction pipeline. Visual inspection of the spectral images indicates that these lines are not present. Line profiles of detected emission features (Figure 2) show no appreciable broadening at the 75 km s-1 velocity resolution of MagE, nor do we detect any significant velocity shift between emission and absorption lines ( = 416 km s-1). As most of these lines are superimposed on an undetected continuum, we report in Table 1 line fluxes and relative line-to-bolometric luminosities, that latter computed using the bolometric correction/spectral type relations of Liu et al. (2010). Our measurement of = 4.180.06 is similar to the first detection made by Hall (2002b), and is again 1–2 orders of magnitude greater than measured quiescent or flaring fluxes for equivalently classified L dwarfs. The Balmer decrement = 2.70.3 is roughly comparable to the mean values for non-flaring M dwarfs (Gizis et al., 2002). H and H emission contribute 61% and 23% of the total measured line flux of 4.
2.2. IRTF/SpeX Near-Infrared Spectroscopy
Low resolution near-infrared spectra of 2MASS J13152649 were obtained on 2009 June 30 (UT) with the 3m NASA Infrared Telescope Facility SpeX spectrograph (Rayner et al., 2003). Observing conditions were clear and dry with 07 seeing at -band. We used the prism-dispersed mode of SpeX with a 05 slit (aligned to the parallactic angle) to obtain a continuous 0.7–2.5 spectrum with resolution . A total of 8 exposures of 120 s each were obtained in two ABBA dither pairs, nodding along the slit, at an average airmass of 1.50. We also observed the A0 V star HD 125438 ( = 7.10) for flux calibration and telluric absorption correction, as well as internal flat field and argon arc lamps for pixel response and wavelength calibration. Data were reduced with the IDL SpeXtool package, version 3.4 (Vacca et al., 2003; Cushing et al., 2004), using standard settings; see Burgasser & McElwain (2006) for details.
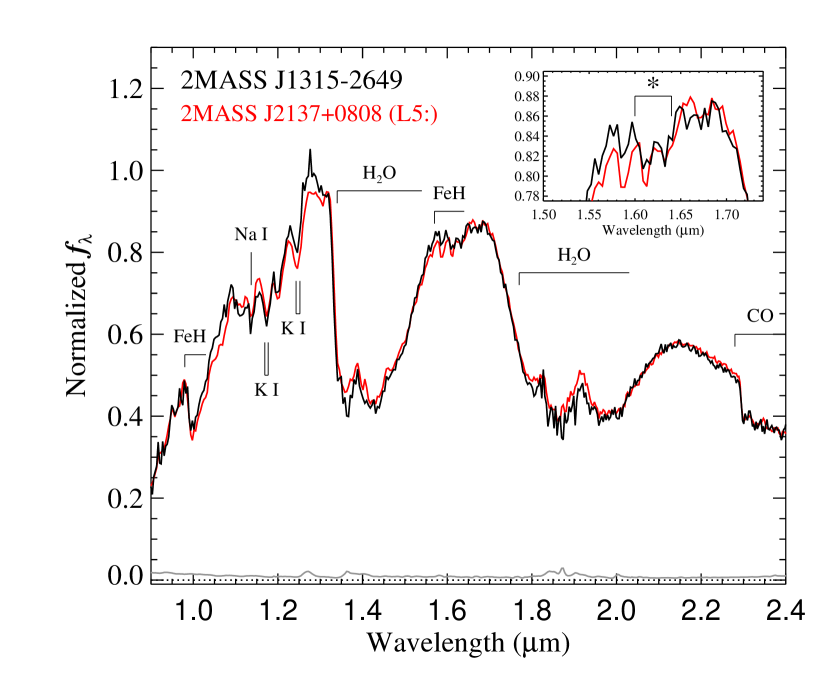
The reduced spectrum of 2MASS J13152649 is shown in Figure 3, compared to the L5 dwarf 2MASS J21373742+0808463 (hereafter 2MASS J2137+0808; Reid et al. 2008). Its near-infrared spectral morphology is consistent with its L5 optical type, with strong H2O and CO absorption bands, FeH absorption at 1.0 and 1.6 , and (unresolved) alkali line absorption in the 1.1–1.3 region. The overall spectral shape is again consistent with a normal L5 field dwarf, with no evidence of an unusual surface gravity, metallicity or cloud content (e.g., McGovern et al. 2004; Allers et al. 2007; Burgasser et al. 2008b; Looper et al. 2008b).
There is, however, a subtle “notch” feature present at 1.62 that differs from the spectrum of 2MASS J2137+0808 (see inset box of Figure 3). This feature has previously been noted in the combined-light spectra of L dwarf plus T dwarf binaries, arising from the overlap of FeH absorption in the primary and CH4 absorption in the secondary (e.g. Burgasser 2007b; Burgasser et al. 2008a; Gelino & Burgasser 2010; Geißler et al. 2011). To characterize this feature, we performed a spectral template fitting analysis similar to that described in Burgasser et al. (2008a), using 295 L2–T8 spectral templates from the SpeX Prism Spectral Libraries333http://www.browndwarfs.org/spexprism.. Fluxes of these templates were scaled to the /spectral type relation of Looper et al. (2008a), and all spectra were interpolated onto a common wavelength scale. Restricting potential secondaries to have T spectral types, a total of 17889 binary templates were constructed and compared to the spectrum of 2MASS J13152649 over the wavelength ranges 0.95–1.35 , 1.45–1.80 and 2.00–2.35 using the statistic.
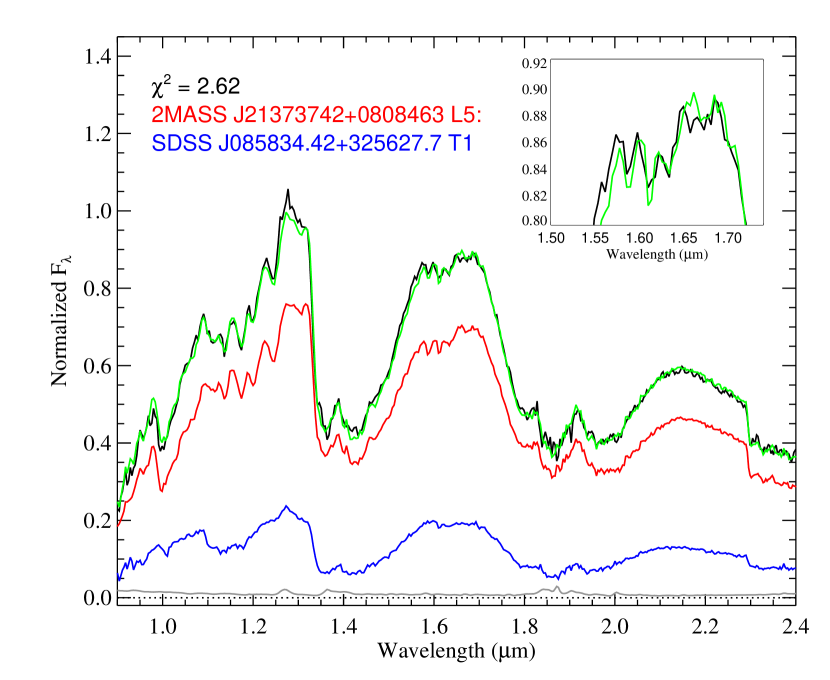
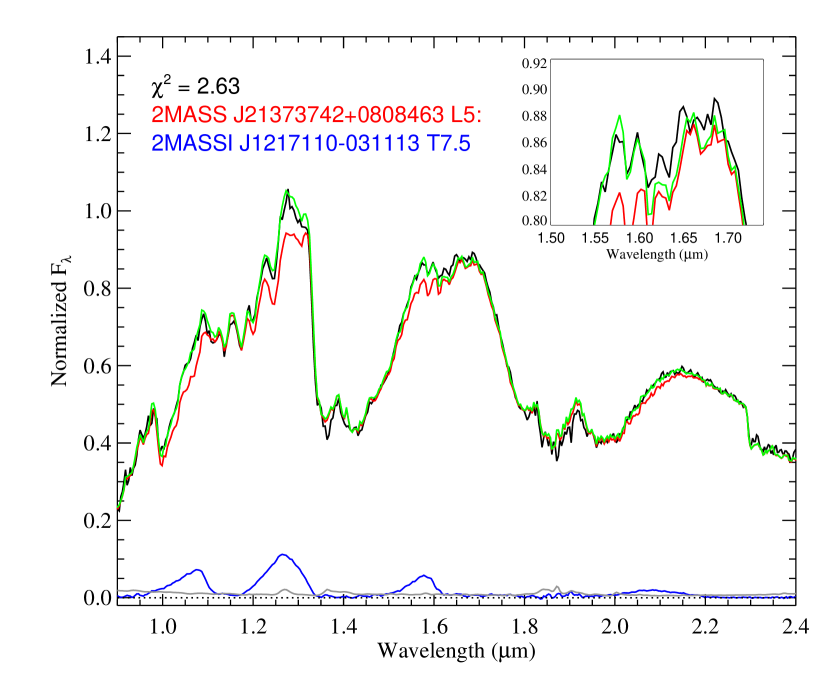
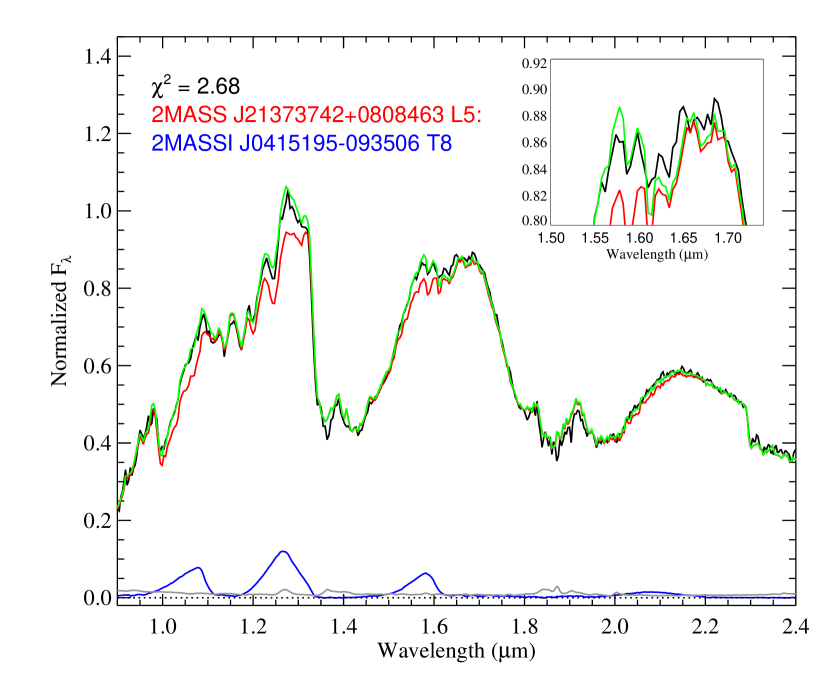
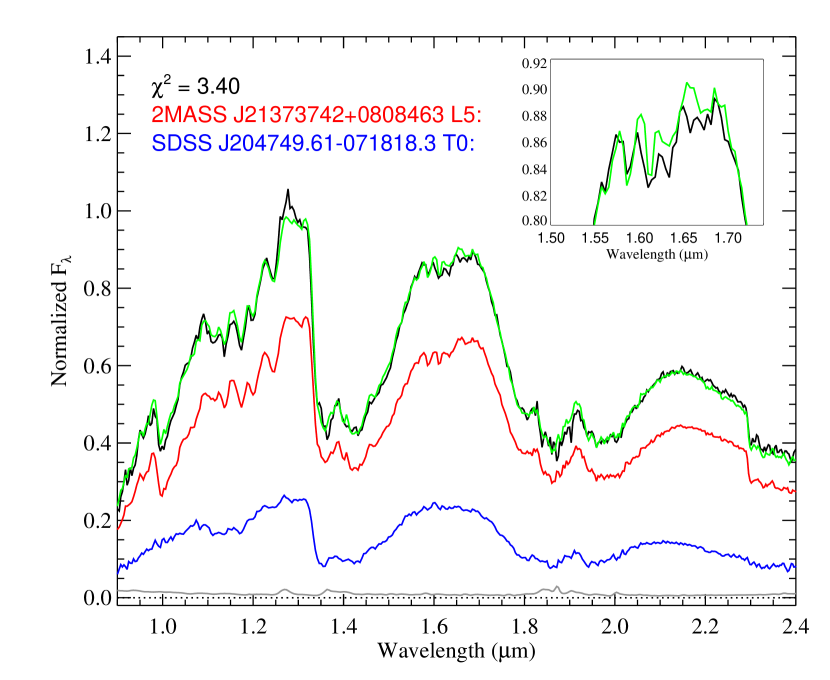
Figure 4 shows the four best-fitting binary templates from these comparisons, a combination of 2MASS J2137+0808 and either early- or late-type T dwarfs. The addition of a T-type companion fills in the “missing” flux at 1.58 , creating the distinct notch feature at 1.62 ; and at 1.27 , producing a somewhat sharper -band flux peak. Importantly, all of the binary templates shown in Figure 4 provide statistically superior fits to the spectrum of 2MASS J13152649 as compared to 2MASS J2137+0808 alone, based on the F-test statistic (Eqns. 2–6 in Burgasser et al. 2010a). However, we cannot precisely constrain the properties of the secondary from this analysis; the average spectral type of all of the template fits weighted by the F-test probability distribution function (F-PDF) is T34.
3. Resolved Imaging and Spectroscopy
3.1. Keck/NIRC2 Near-Infrared Imaging
To more accurately characterize this putative companion, high-resolution, near-infrared images of 2MASS J13152649 were obtained with the 10m Keck II laser guide star adaptive optics system (LGSAO; Wizinowich et al. 2006; van Dam et al. 2006) and facility NIRC2 near-infrared camera. Observations were conducted on two runs, 2010 March 24 and 2010 May 13 (UT), both with clear skies and fair seeing (1 and 05, respectively). We used the narrow camera with image scale 9.9630.011 mas pixel-1 (Pravdo et al., 2006) covering a 102102 field of view. Images were obtained through the , , and filters, using a three-point dither pattern that avoided the noisy, lower left quadrant of the focal plane array. Exposure times ranged from 30 s with 8 coadds to 120 s with 2 coadds per pointing position, with total integrations of 360 s to 720 s in a given filter. The sodium LGS provided the wave front reference source for AO correction, while tip-tilt aberrations and quasi-static changes were measured by monitoring the = 12.8 field star USNO-B1.0 0631-0348160 (Monet et al., 2003) located = 386 from 2MASS J13152649. Images were reduced using custom IDL444Interactive Data Language. scripts, as described in Gelino & Burgasser (2010).
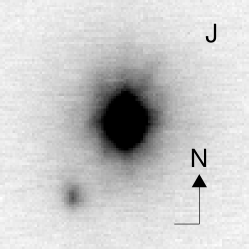
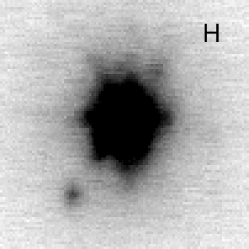
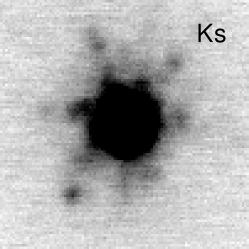
Figure 5 displays the reduced NIRC2 images from our May observations. A faint source is clearly present southeast of 2MASS J13152649, and was visible during both imaging epochs. Relative astrometry for each epoch was measured on the individual frames using a centroiding algorithm, and these values were then averaged and multiplied by the pixel scale (uncertainties include the standard deviations of the position measurements and 0.1% pixel scale uncertainty). Relative photometry was performed on the coadded mosaics through aperture photometry. As the point spread function (PSF) of the brighter component contributes significant flux (25%) to the brightness of the fainter object, photometry for the latter was extracted from a primary PSF-subtracted image, constructed by rotating the frame 180 about the centroid of the primary and differencing. Systematic errors in the primary subtraction were estimated by offsetting the rotation axis over a 55-pixel grid centered on the original centroid, subtracting, and measuring aperture photometry on the secondary. The final photometric values for each band and epoch were taken as the means and standard deviations of these 25 measurements.
| Parameter | Value |
|---|---|
| NIRC2 Epoch 2010 March 24 (UT) | |
| () | 1856 |
| () | 2773 |
| () | 3337 |
| () | 143.11.1 |
| (mag) | 3.120.05 |
| (mag) | 4.290.14 |
| (mag) | 4.910.18 |
| NIRC2 Epoch 2010 May 13 (UT) | |
| () | 1872 |
| () | 2867 |
| () | 3427 |
| () | 143.90.5 |
| (mag) | 3.000.03 |
| (mag) | 4.590.07 |
| (mag) | 5.170.12 |
| OSIRIS Epoch 2010 May 19 (UT) | |
| () | 1805 |
| () | 2866 |
| () | 3384 |
| () | 147.81.2 |
Note. — Angular separation () and position angle () measured from the brighter primary to the fainter secondary.
Results are listed in Table 2. Separations in right ascension and declination are consistent between both epochs, and (in conjunction with the OSIRIS observations described below) yield a mean separation of 3366 mas at position angle of , measured from primary to secondary. The mean relative magnitudes are also statistically consistent between epochs (to within 2), and indicate that the companion is both considerably fainter ( = 3.030.03, = 5.090.10) and bluer in the near-infrared. To our knowledge, this is the second most extreme near-infrared flux ratio measured for an ultracool dwarf binary to date5552MASS J13152649 is exceeded at -band only by the young TW Hydrae binary 2MASSW J1207334-393254AB ( = 7.00.2, = 4.980.14; Chauvin et al. 2004, 2005; Mohanty et al. 2007); and at -band only by the old, widely-separated binary SDSS J141624.08+134826.7AB ( = 4.310.02, = 6.850.17; Burningham et al. 2010; Scholz 2010; Burgasser et al. 2010b).. We examine the physical association of the companion in Section 4.3; hereafter, we refer to the two sources as 2MASS J13152649A and B.
3.2. Keck/OSIRIS Near-Infrared Spectroscopy
Resolved -band spectroscopy of 2MASS J13152649AB was obtained using the Keck II OH-Suppressing InfraRed Integral field Spectrograph (OSIRIS; Larkin et al. 2006) and LGSAO in mostly clear conditions on 2010 May 19 (UT). We used the 35 mas-scale camera and Hbb filter, providing 1.47–1.80 spectroscopy at an average resolution of 3800 and dispersion of 2.1 Å pixel-1 over a 056224 field of view. The instrument rotator was set at a position angle of 45 to accommodate both components in the rectangular field of view. Six exposures of 600 s each were obtained at an average airmass of 1.52 using a linear dither pattern with steps of 04 along the long axis, and tip-tilt correction for LGSAO operation was again provided by USNO-B1.0 0631-0348160. These observations were followed by a 600 s exposure of a blank sky frame. We also obtained three dithered 20 s exposures of the A0 V star HD 107120 ( = 9.90) in natural guide star (NGS) AO mode at an airmass of 1.56 for telluric absorption correction and flux calibration.
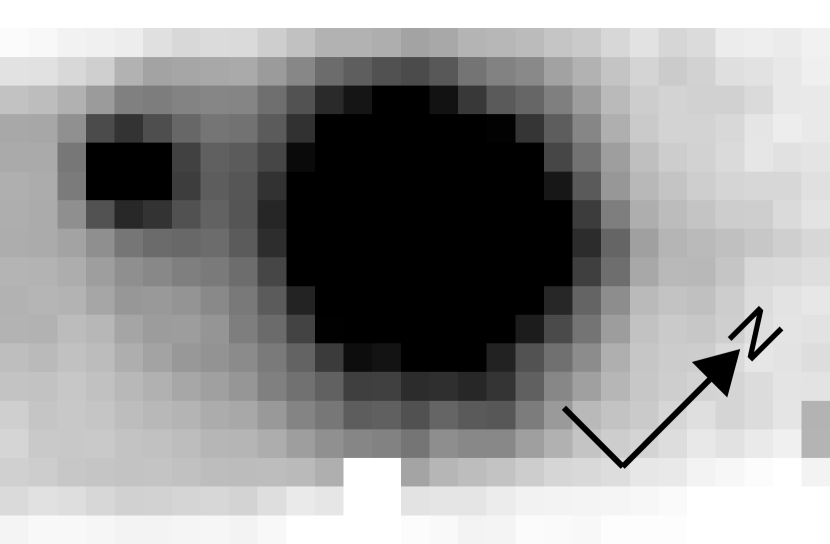
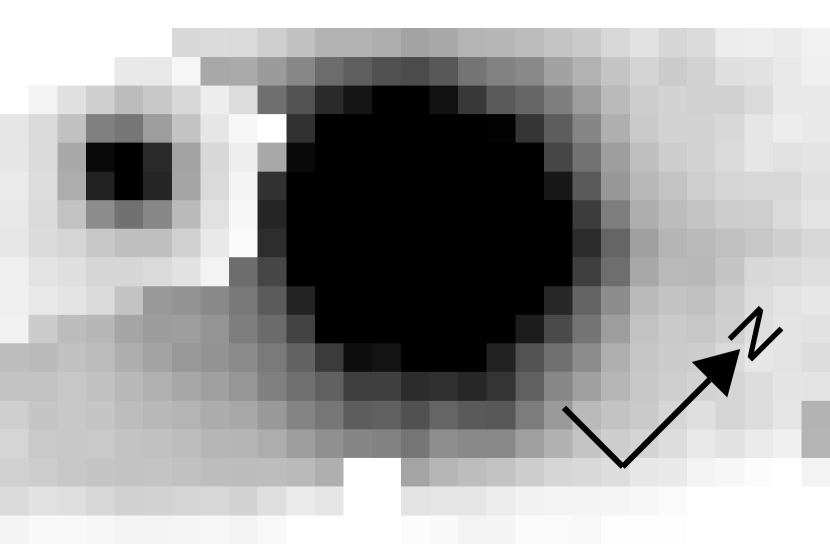
Data were reduced with the OSIRIS data reduction pipeline (Krabbe et al., 2004), version 2.3. We first subtracted the 600 s sky frame from each of the 2MASS J13152649 images, and a median-combined dark frame from the calibrator images. We then used the pipeline to adjust bias levels, remove detector artifacts and cosmic rays, extract and wavelength-calibrate the position-dependent spectra (using the most current rectification files as of February 2011), assemble 3D data cubes and correct for dispersion. Spectra for the 2MASS J13152649 primary and HD 107120 were extracted directly from the data cube by aperture photometry in each image plane, using a 3-pixel (105 mas) aperture and 10-20 pixel (350–700 mas) sky annulus. For the faint companion, light contamination from the primary was a concern, so we first performed a partial subtraction of the primary’s radial brightness profile. We sampled the profile over two position angle ranges 20–40 away from the separation axis, generating a mean profile as a function of wavelength and separation. We then subtracted this profile 25 about the separation axis. Figure 6 displays mosaics of both the original and subtracted images, illustrating the reduced background achieved around the companion. We measured aperture photometry for this component in each of the subtracted image planes, using a more restricted 1.5 pixel (52 mas) aperture and 3–5 pixel (105-175 mas) sky annulus. The individual spectra for all three sources were scaled and combined using the xcombspec routine in SpeXtool (Cushing et al., 2004). Flux calibration and telluric correction of the 2MASS J13152649AB spectra were performed using the xtellcor_general routine in SpeXtool, assuming a 20 nm Gaussian kernel for the A0V H I lines (Vacca et al., 2003).
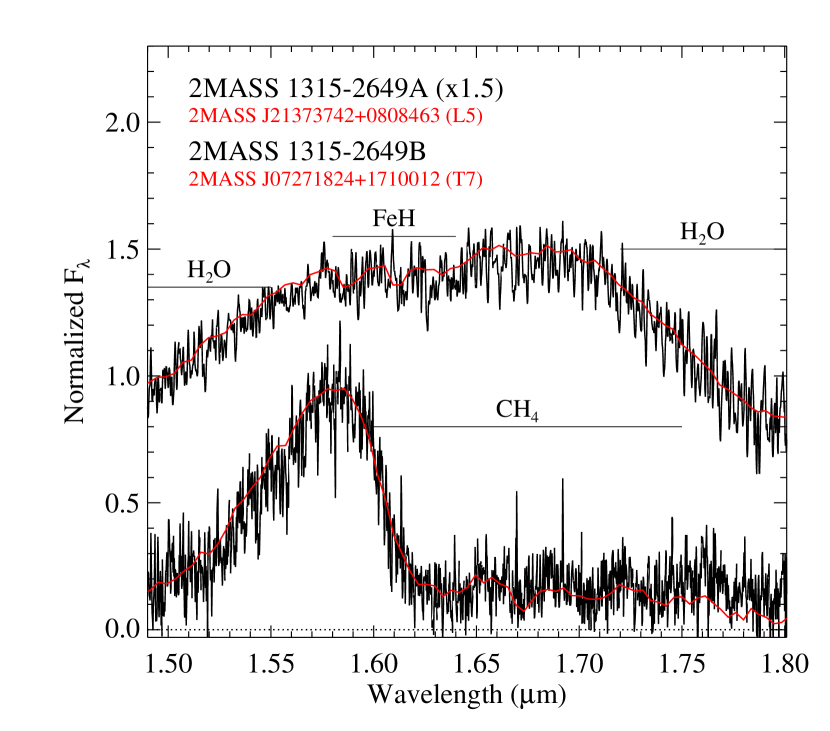
Figure 7 displays the reduced spectra of the two components of 2MASS J13152649. The spectrum of 2MASS J13152649A has exceptionally high signal-to-noise (S/N 200), and is similar to that of the combined-light SpeX spectrum, with strong H2O absorption wings shortward of 1.55 and longward of 1.7 , and weak FeH absorption in the 1.57–1.64 region, all indicative of a mid-type L dwarf. The notch feature, however, is no longer present. The spectrum of 2MASS J13152649B (S/N 25 at 1.6 ) is unambiguously that of a late-type T dwarf, with strong CH4 absorption at 1.6 .
4. Analysis
4.1. Component Spectral Classifications
Component spectral types were determined by comparing the resolved OSIRIS spectra to the SpeX Prism Spectral Libraries templates, restricting the template sample to optically-classified L dwarfs and near-infrared-classified T dwarfs. Following a -fitting procedure similar to that described above over the 1.5–1.8 region, we identified the L5 2MASS J21373742+0808463 (Reid et al., 2008) and the T7 2MASS J07271824+1710012 (Burgasser et al., 2002a) as the best-fitting templates to 2MASS J13152649A and B, respectively (Figure 7). An F-test weighted average of all templates indicates mean classifications of L3.52.5 and T70.6 for the components. The large uncertainty for the former is largely due to the broad diversity of near-infrared spectra exhibited by L dwarfs at a given optical spectral type, arising from variations in surface gravity, metallicity and cloud properties (Allers et al., 2007; Burgasser et al., 2008b; Looper et al., 2008b; Kirkpatrick et al., 2010). We therefore adopt the optical L5 classification for this component and the near-infrared T7 classification for the secondary.
4.2. Component Brightnesses, Distances and Luminosities
Component brightnesses on the MKO666Mauna Kea Observatory filter system; see Tokunaga et al. (2002) and Simons & Tokunaga (2002). system were determined by converting the combined-light 2MASS and relative NIRC2 magnitudes to MKO . These conversions were computed directly from the SpeX prism spectra of 2MASS J13152649AB (2MASS MKO) and the best-fit templates in Figure 7 (NIRC2 MKO) using the appropriate filter profiles and a Kurucz model spectrum of Vega (see Cushing et al. 2005). The resulting combined light and component magnitudes are listed in Tables 4.2 and 4, respectively. Both components appear to have relatively normal near-infrared colors for their spectral types (Leggett et al., 2010).
| Parameter | Value | Ref |
|---|---|---|
| Spectral Type | L5 | 1,2 |
| Est. Distance (pc) | 193 | 1 |
| MKO (mag) | 15.070.05 | 1,3 |
| MKO (mag) | 14.120.04 | 1,3 |
| MKO (mag) | 13.450.04 | 1,3 |
| MKO (mag) | 1.630.07 | 1,3 |
| (mas yr-1) | 68213 | 4 |
| (mas yr-1) | 28214 | 4 |
| (km s-1) | 6510 | 1,4 |
| (km s-1) | 79 | 1 |
| U (km s-1) | 388 | 1 |
| V (km s-1) | 419 | 1 |
| W (km s-1) | 135 | 1 |
| (mas) | 3363 | 1 |
| (AU) | 6.60.9 | 1 |
| () | 3363 | 1 |
| (mag) | 3.030.03 | 1 |
| (mag) | 4.530.06 | 1 |
| (mag) | 5.090.10 | 1 |
| Age (Gyr) | 0.8–1.0 | 1 |
| Est. Orbit PeriodaaFirst range gives modal values; second range samples the 90% confidence limits based on Monte Carlo simulation (see footnote 9). (yr) | 45–60 (15–95) | 1 |
| Parameter | 2MASS J13152649A | 2MASS J13152649B | Difference |
|---|---|---|---|
| Observables | |||
| NIR SpT | L3.52.5 | T70.6 | |
| MKO (mag) | 15.140.05 | 18.200.06 | |
| MKO (mag) | 14.140.03 | 18.660.07 | |
| MKO (mag) | 13.450.04 | 18.790.11 | |
| MKO (mag) | 1.690.06 | 0.590.12 | |
| Distance (pc) | 184 | 369 | 179 |
| (dex) | -4.190.16 | 5.860.16 | |
| Spectral Model Fit Parameters | |||
| Teff (K) | 176070 | 79070 | |
| (cm s-2) | 5.2 | 5.00.5 | |
| Evolutionary Models, Age = 1 Gyr | |||
| Mass (MJup) | 606 | 163 | 0.260.03aaMass ratio M2/M1. |
| Teff (K) | 1720150 | 63060 | |
| (cm s-2) | 5.260.04 | 4.570.09 | |
| Radius (RJup) | 0.900.01 | 1.010.02 | |
| Evolutionary Models, Age = 3 Gyr | |||
| Mass (MJup) | 742 | 284 | 0.380.05aaMass ratio M2/M1. |
| Teff (K) | 1770140 | 67070 | |
| (cm s-2) | 5.410.01 | 4.930.08 | |
| Radius (RJup) | 0.840.02 | 0.910.02 | |
| Evolutionary Models, Age = 5 Gyr | |||
| Mass (MJup) | 762 | 375 | 0.480.06aaMass ratio M2/M1. |
| Teff (K) | 1790140 | 69070 | |
| (cm s-2) | 5.440.02 | 5.100.08 | |
| Radius (RJup) | 0.830.02 | 0.850.02 | |
| Evolutionary Models, Age = 10 Gyr | |||
| Mass (MJup) | 771 | 485 | 0.620.06aaMass ratio M2/M1. |
| Teff (K) | 1790140 | 72070 | |
| (cm s-2) | 5.440.02 | 5.280.07 | |
| Radius (RJup) | 0.830.02 | 0.790.02 | |
Component distances were computed using the MKO absolute magnitude/spectral type relations of Liu et al. (2006); we considered both the “bright” and “faint” relations. Propagating uncertainties in component spectral types and photometry, and scatter in the relations, through Monte Carlo simulation yields consistent distances for each component in all three bands and both relations, with mean values of 184 pc and 359 pc for 2MASS J13152649A and B, respectively. These distances are formally consistent with each other, differing at the 1.8 level; the latter has a larger uncertainty due to the larger photometric error for this component (Table 4). The error-weighted mean distance of 203 pc matches the 21.7 pc estimate of Riaz & Gizis (2007). At this distance, the projected separation of the components is 6.60.9 AU, right at the peak of the separation distribution of resolved very low-mass field binaries (Allen, 2007).
Component luminosities were computed from the individual MKO magnitudes using bolometric correction (BC) relations as a function of spectral type, as quantified in Liu et al. (2010). Apparent bolometric magnitudes were converted to absolute bolometric magnitudes by adopting a common distance of 203 pc, and luminosities calculated assuming = 4.74. Luminosities computed in each of the bands were again mutually consistent, resulting in = 4.190.16 and 5.860.16 for 2MASS J13152649A and B, respectively. The luminosity for 2MASS J13152649A is similar to other L4.5–L5.5 field dwarfs as compiled by Golimowski et al. (2004) and Vrba et al. (2004), while 2MASS J13152649B is somewhat underluminous for its spectral type.
4.3. Kinematics and Physical Association
The similar distances and relative small projected separation of 2MASS J13152649A and B indicates that these sources are cospatial; we also find that their space motions are aligned. The three epochs of NIRC2 and OSIRIS relative astrometry are consistent with each other in both right ascension and declination, and despite the short period between the observations the high proper motion of 2MASS J13152649 ( = 68213 mas yr-1, = 28214 mas yr-1; Faherty et al. 2009) allows us to rule out either component as a (non-moving) background star at the 9 level. Furthermore, the magnitudes and position angles of the component proper motions are identical to within 47 mas yr-1 (4.4 km s-1 at 20 pc) and 4. The radial motions of the two components are also equivalent. Cross-correlation of the OSIRIS spectra with zero-velocity spectral model templates from Allard et al. (2010, see Section 4.4) yield identical velocities to within the uncertainties ( = 09 km s-1).
With a projected tangential velocity of = 7018 km s-1, and adopting the radial velocity from the combined-light optical spectrum above, we find space velocities in the Local Standard of Rest777Assuming a Solar motion of = 10 km s-1, = 5.25 km s-1 and = 7.17 km s-1 in the LSR (Dehnen & Binney, 1998), where the directions of follow a right-handed coordinate system. (LSR) of = 388 km s-1, = 419 km s-1 and = 135 km s-1. These values lie outside the 1 velocity spheroid for the “cold” population of nearby L dwarfs reported by Schmidt et al. (2010), but are within the velocity spheroid of local thick disk stars (e.g., Soubiran et al. 2003). Both the kinematics and spectral properties of 2MASS J13152649 are therefore consistent with an older dwarf system in the Galactic disk population.
4.4. Comparison to Atmospheric and Evolutionary Models
Assuming that 2MASS J13152649AB comprises a coeval system, insight into the physical properties of its components can be obtained by joint comparison to atmospheric and evolutionary models. The spectral and kinematics analysis above suggests that 2MASS J13152649AB is an older system; a more quantitative constraint comes from the absence of Li I absorption in the combined light optical spectrum, which is dominated by the L5 primary. The absence of this line sets a minimum mass of 0.06 M☉ for this component (Rebolo et al., 1992; Chabrier et al., 1996). Combined with its luminosity, the evolutionary models of Burrows et al. (1997), Baraffe et al. (2003) and Saumon & Marley (2008) indicate a minimum age for the primary ranging from 0.8 to 1.0 Gyr. This implies a minimum secondary mass of 0.013 M☉, around the deuterium-burning minimum mass limit (Chabrier & Baraffe, 2000; Spiegel et al., 2011).
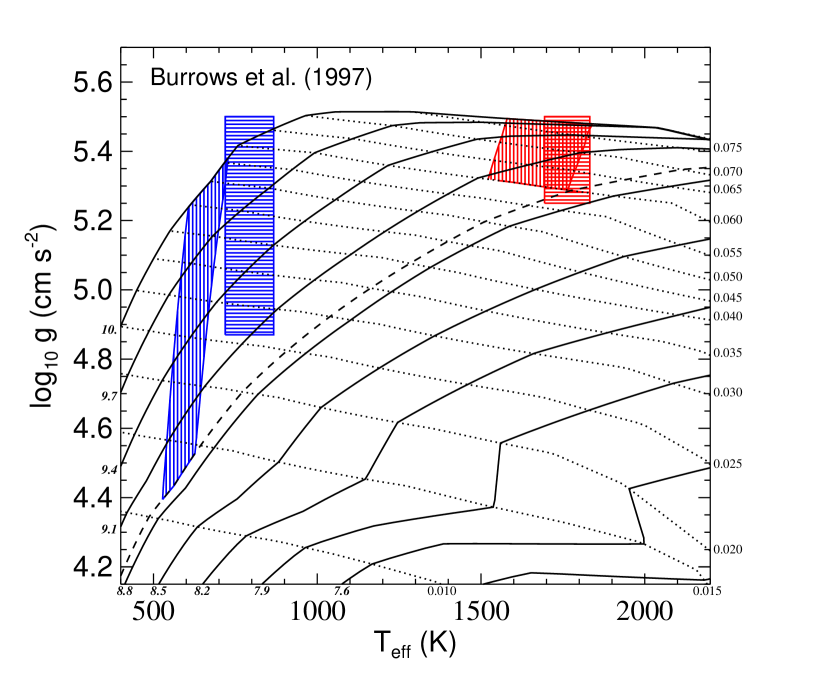
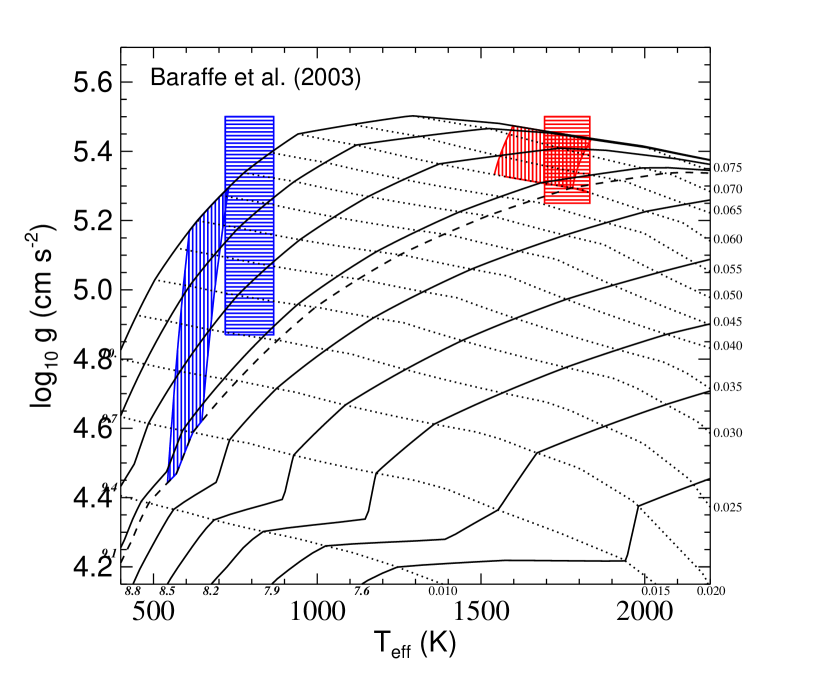
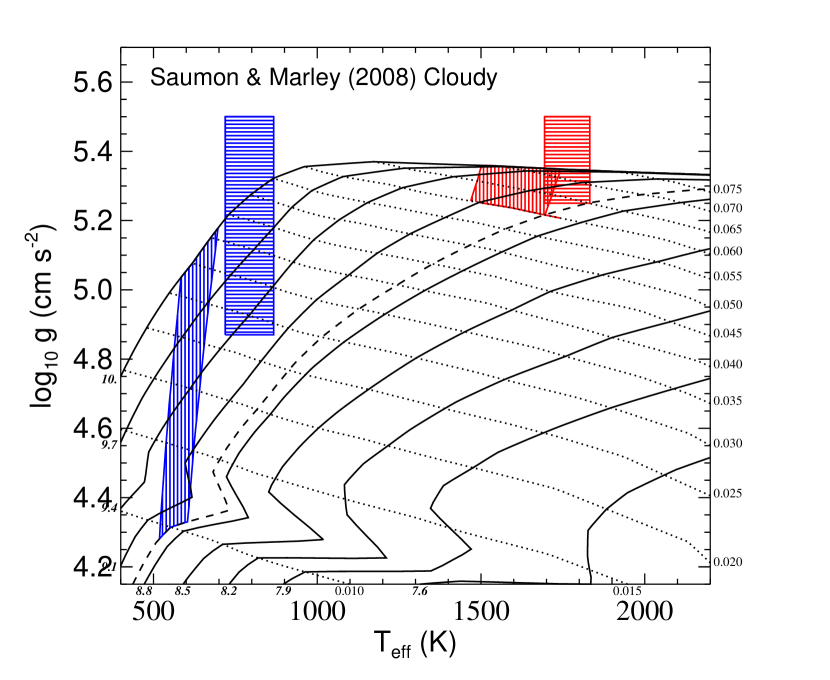
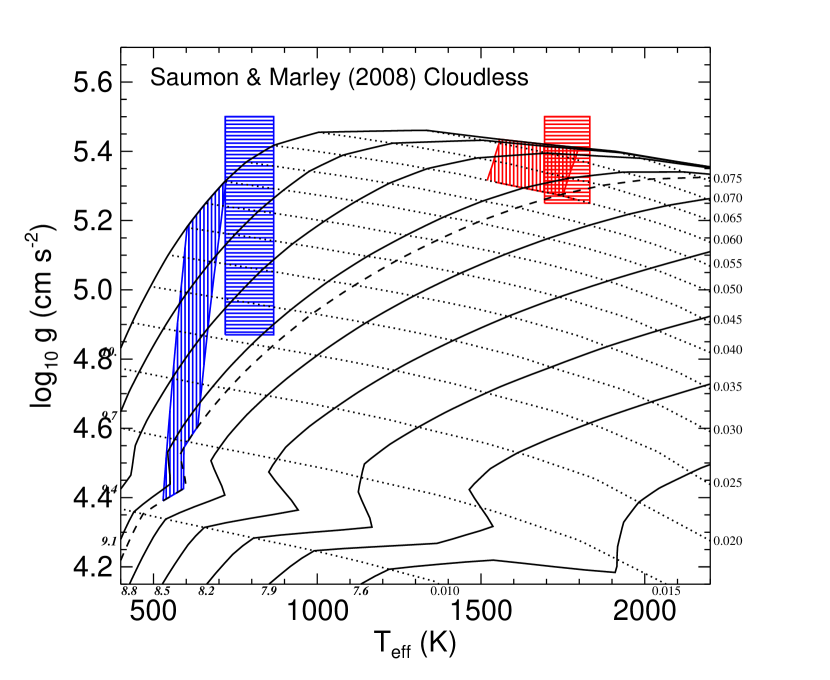
Figure 8 displays the regions in Teff/ space occupied by the components as constrained by their luminosities, the minimum mass of 2MASS J13152649A, and the evolutionary models listed above. Table 4 details specific physical properties for select ages based on the evolutionary models of Baraffe et al. (2003). With no empirical upper limit on the age of this system, the mass of 2MASS J13152649A could be above the hydrogen-burning mass limit (M 0.072 M☉ for 2 Gyr), while the secondary must be substellar at any age. The estimated mass ratio of the system, M2/M1, is one of the smallest inferred for a very low-mass binary: 0.3 (0.6) for an age of 1 Gyr (10 Gyr). This makes 2MASS J13152649AB a unique system, given that 90% of resolved brown dwarf binaries identified to date have (Allen, 2007; Burgasser et al., 2007). Indeed, if low-mass binaries prefer to be in higher mass ratio systems, these values further support the hypothesis that 2MASS J13152649 is quite old. Teff constraints on the components—1570–1930 K for the primary and 570–790 K for the secondary (1 ranges)—are again consistent with comparably classified field dwarfs (Golimowski et al., 2004; Cushing et al., 2008), with 2MASS J13152649B being somewhat on the cool side for its spectral type. The lower mass limit for 2MASS J13152649A tightly constrains its surface gravity to = 5.22–5.46 cm s-2, while 2MASS J13152649B has a broader constraint of 4.46–5.35 cm s-2.
An independent assessment of the component atmospheric parameters was made by fitting the OSIRIS spectra to the BT-Settl models of Allard et al. (2010). These models are based on the PHOENIX code (Hauschildt et al., 1999), and reflect an update to the original Settl models of Allard et al. (2003) with a microturbulence velocity field determined from 2D hydrodynamic models (Freytag et al., 2010) and updated solar abundances from Asplund et al. (2009). We followed the same fitting procedure described in Burgasser et al. (2010c, see also and ), using a set of solar-metallicity models sampling Teff = 600–2500 K (100 K steps) and = 4.0–5.5 cm s-2 (0.5 cm s-2 steps). Model surface fluxes (in units) and the OSIRIS spectra were smoothed to a common resolution of = 3500 using a Gaussian kernel, and interpolated onto a common wavelength grid. The data were then scaled to the appropriate -band apparent magnitude. Data and models were compared over the 1.5–1.75 region using a statistic, with the degrees of freedom equal to the number of resolution elements sampled. An optimal scaling factor was computed for each fit to minimize , where is the radius of the brown dwarf and its distance from the Sun (Bowler et al., 2009). We further constrained our model selection by requiring that the model-inferred distance be within 2 of the estimated spectrophotometric distance of the system (13–26 pc). Means and uncertainties in the atmospheric parameters were determined using the F-PDF as a weighting factor, as above; we also propagated sampling uncertainties of 50 K and 0.25 dex for Teff and , respectively. Note that these uncertainties quantify experimental errors; they do not account for systematic errors that arise from the fidelity of the model fits, as discussed below.
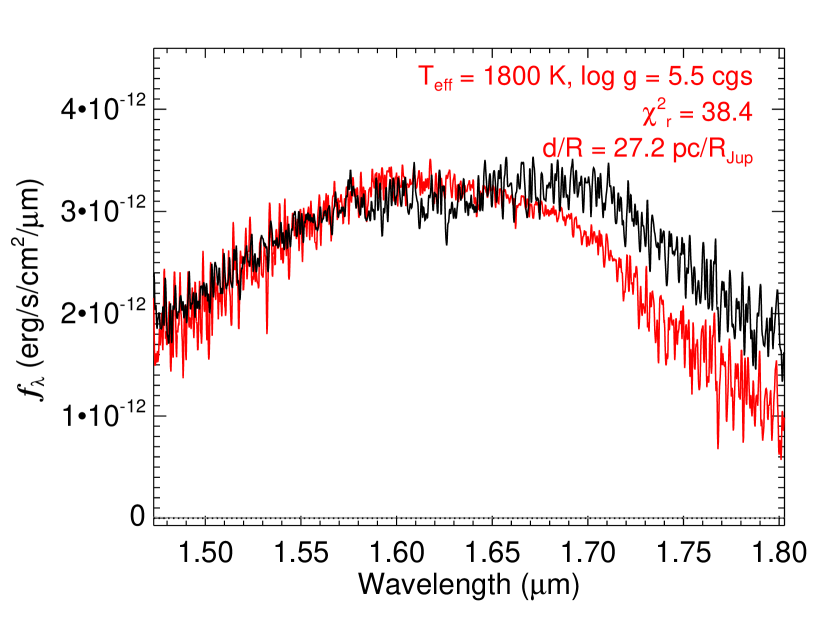
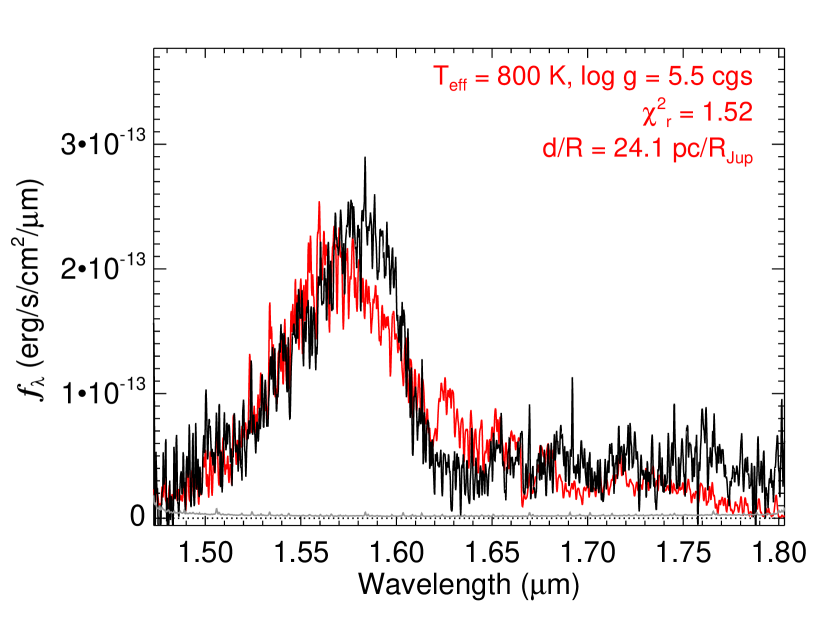
Figure 9 displays the best-fitting models for the OSIRIS spectra. For wavelengths shortward of 1.55 , the models provide reasonably good fits to the forest of H2O lines present in both component spectra. However, at longer wavelengths we see deviations in the primary arising from missing FeH opacity and a premature downturn in fluxes longward of 1.65 . The latter is symptomatic of overly blue spectral energy distributions across the near-infrared range exhibited by the models at these temperatures. There are also deviations in model fits to the secondary near the 1.58 peak and within the 1.6–1.75 CH4 absorption system. Note that, quantitatively, the fit to the secondary is better ( = 1.52) than that to the primary ( = 38.4), but this mainly stems from the high S/N data for the latter; neither fit reproduces the observed spectrum with great fidelity. Nevertheless, visual inspection confirms that these are the best fits among the model sample, and the inferred mean parameters—Teff = 176070 K and 5.2 cm s-2 for the primary and Teff = 79070 K and = 5.20.4 cm s-2 for the secondary—are roughly in line with estimates from the evolutionary model parameters above.
4.5. A Coevality Test
With independent determinations of luminosity and Teff for both components, we can now examine whether the evolutionary and atmospheric models are consistent with each other assuming the system is coeval; this is the so-called coevality test (e.g., Liu et al. 2010). Prior studies of brown dwarf binaries have produced mixed results with respect to this test, with a few low-temperature systems showing evidence of 50–100 K offsets (both high and low) between evolutionary and atmospheric models (Liu et al., 2008, 2010; Dupuy et al., 2009b, a; Konopacky et al., 2010). However, spectroscopic Teffs have generally been taken from estimates of comparably classified field dwarfs, rather than spectroscopic fits to the binary components themselves888Note that Konopacky et al. (2010) perform atmospheric model fits to resolved component photometry, rather than spectroscopy.. Such temperature estimation by proxy could result in systematic biases. The single exception is the T1+T6 binary Indi BC, for which resolved optical and near-infrared spectroscopy have enabled determinations of individual component luminosities and Teffs (Kasper et al., 2009; King et al., 2010), and comparison of these components on the HR diagram indicate that they are coeval with each other and with their stellar primary (Liu et al., 2010).

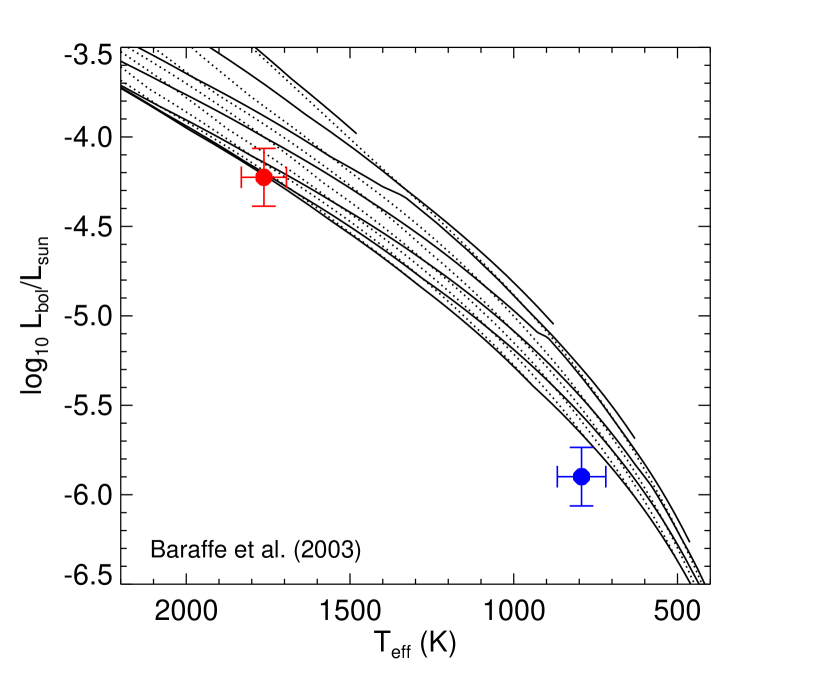
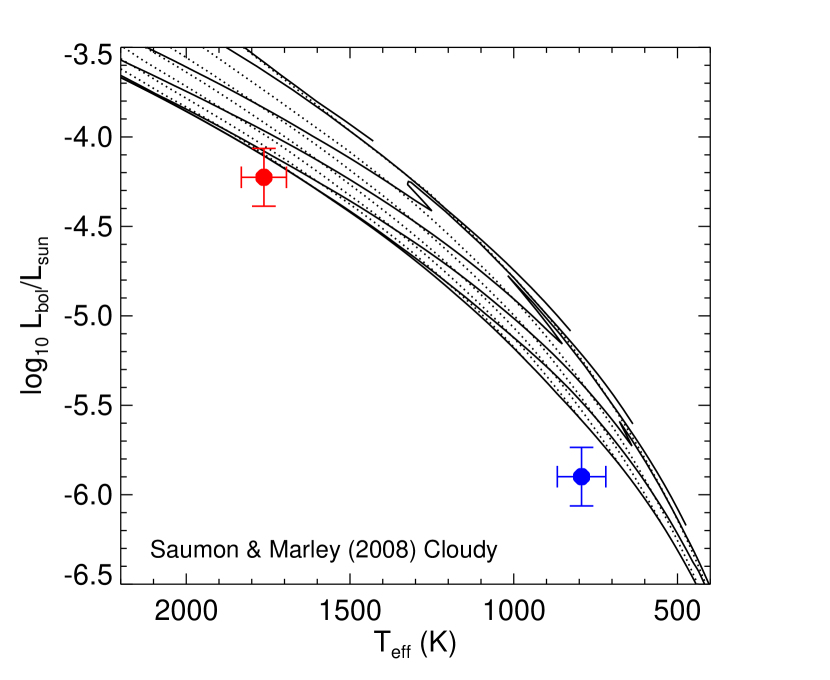
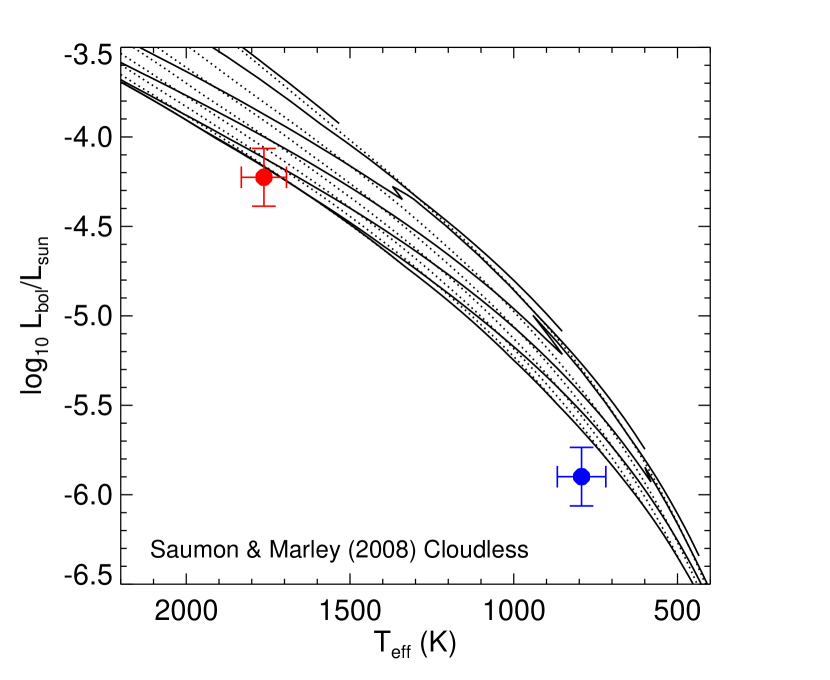
For 2MASS J13152649AB, we find good agreement between atmospheric and evolutionary models for the primary but not for the secondary. Figure 8 compares the Teff and constraints from our spectral models fits to those from the evolutionary model comparisons. The atmospheric Teff and constraints for the primary overlap reasonably well for all four evolutionary model sets, although there is less agreement for the cloudy models of Saumon & Marley (2008). Moreover, these values are consistent with the 0.8-1.0 Gyr minimum age of the system based on the absence of Li I in the optical spectrum. For the secondary, overlap in Teff and regions is not as good, with essentially no overlap for the Saumon & Marley (2008) cloudy models. This discrepancy can also be seen in Figure 10, which compares the HR diagrams for all four evolutionary models to the luminosities and spectral model fit Teffs for the 2MASS J13152649 components. Both sit at the lower envelope of the evolutionary tracks, consistent with older ages; however, 2MASS J13152649B falls off the Saumon & Marley (2008) cloudy tracks entirely.
The sense of the deviations between the model comparisons of 2MASS J13152649B is that the spectral model fit Teffs are systematically higher than the evolutionary model Teffs. As we do not have any other independent constraints on the system (e.g., age, metallicity or component masses), we cannot a priori determine whether this mismatch is specifically attributable to errors in the spectral or evolutionary models. However, based on the fits shown in Figure 9, we suspect the former given the poor match between the BT-Settl models and spectral data around the 1.6 CH4 band. This feature causes persistent problems in spectral model ftis due to incomplete CH4 opacities at T dwarf temperatures (Saumon et al., 2006; Freedman et al., 2008). A decrease of just 100–200 K in the derived secondary Teff would bring both components in precise alignment with evolutionary models in both Teff/ and HR diagrams, a shift previously suggested in prior low-mass binary analyses (although not necessarily in the same direction; Konopacky et al. 2010; Liu et al. 2010). It is also notable that spectral model fits for 2MASS J13152649A are even worse than those for 2MASS J13152649B. It may be that the alignment of evolutionary and spectral model parameters for this component is merely an example of “chance agreement”. In any case, without more accurate fitting of L and T dwarf spectral data, such coevality tests are fundamentally inconclusive about the underlying accuracies of model-derived parameters.
We emphasize that the discrepancies noted here are only at the 1 level, and should be verified through more precise constraints on the component luminosities and Teffs. These can best be accomplished through a parallax distance measurement of the system, as the distance uncertainty dominates the luminosity uncertainty. In addition, resolved spectroscopy spanning the near-infrared (and possibly optical) range would provide a more robust test of the atmosphere models, and allow us to test different sets of models. Unfortunately, mass measurements for this widely-separated system are probably not feasible in the near future. A probability analysis of the possible orbits for this system999Period distributions were computed by Monte Carlo simulation, using a method similar to that described in Dupuy & Liu (2007). Assuming uniform distributions of orbital inclination, ascending node and eccentricity, and using the observed separation as a constraint, we determined probability distributions in eccentric anomaly, semimajor axis and orbit period for various system ages using the masses listed in Table 4. predicts likely periods of 45–60 yr (15-95 yr at 90% confidence). This rules out a “fast” astrometric orbit determination, and the relative orbital radial velocities (0.5 km s-1) are comparable to current systematic uncertainties for isolated late-type dwarfs (e.g., Blake et al. 2010). Despite these challenges, the 2MASS J13152649 system is an important benchmark for empirical tests of atmospheric and evolutionary models given its proximity, well-separated components, component types and relatively old age.
5. Why is 2MASS J13152649 so Active?
While the presence of a faint, substellar companion provides useful constraints on the physical properties of the 2MASS J13152649 system, it also suggests that a binary interaction could be responsible for the unusual strength and persistence of its nonthermal emission. In a study of the comparably active T6.5e dwarf 2MASS J1237+6526, Burgasser et al. (2000) proposed that accretion of material from a binary companion via Roche Lobe overflow could be a mechanism for sustained emission, as the inverted mass/radius relationship for brown dwarfs allows for sustained mass loss for , precisely the mass limit we find for 2MASS J13152649AB. However, the maximum separation for Roche lobe overflow is only a few Jupiter radii, well below the 15,000 RJup projected separation for this pair. Moreover, the ballistic velocity of material impacting the surface of the primary, km s-1 500 km s-1 (where MJ and RJ are the mass and radius of the primary in Jupiter units) would have been readily detectable from line broadening over a broad range of viewing geometries. Combined with the absence of infrared excess associated with a circumstellar disk, we rule out accretion from the observed binary companion as the source of line emission.
The most likely explanation is that 2MASS J13152649A possesses an unusually active chromosphere for its spectral type, perhaps reflecting an unusually strong magnetic field. Gizis et al. (2000) postulated an inverse relationship between age and activity among late-type M and L dwarfs, finding that stellar-mass (and hence older) L dwarfs were more likely to exhibit H emission than younger L dwarfs in their sample (note that Schmidt et al. 2007 find marginal evidence for the opposite trend). Christensen et al. (2009) and Reiners & Christensen (2010) infer a similar mass-dependence in the strength and persistence of magnetic fields on brown dwarfs based on the total energy flux available for field generation. In their model, objects above the hydrogen burning mass limit retain kilogauss fields for up to 10 Gyr. If strong fields correlate with strong chromospheres in L dwarfs (as they do for late-type M dwarfs; Reiners & Basri 2010), then the presence of nonthermal emission may align with kinematic, spectroscopic and binary mass ratio evidence that 2MASS J13152649 is an old system, and 2MASS J13152649A a relatively massive brown dwarf or low-mass star with a strong magnetic field. A direct measurement of this component’s magnetic field could be obtained through Zeeman line broadening measurements in the 0.99 FeH Wing-Ford band (Reiners & Basri, 2007, 2010; Shulyak et al., 2010; Wende et al., 2010). However, the high spectral resolution required for such a measurement ( 30,000) makes it a challenge for this faint system; indeed, no Zeeman broadening measurements have been reported for an L dwarf to date. An independent issue is how such a field could generate a persistent chromosphere in the presence of a highly neutral photosphere. Variability in the strength of H emission from 2MASS J13152649 over the past decade may indicate microflaring as a viable source of heating, and a possible indicator of vigorous turbulent field generation (Durney et al., 1993; Dobler et al., 2006; Browning, 2008). Alternately, Helling et al. (2011) have hypothesized that dust grain ionization and electron avalanche (i.e., lightning) could locally increase the photospheric ionization fraction and magnetic field coupling in dusty L dwarfs, although early models appear to favor this mechanism in younger, lower-mass brown dwarfs and exoplanets. A connection between magnetic activity and “cloudiness” has yet to be explored.
For completeness, we note that because of its relatively wide separation, magnetic interaction between 2MASS J13152649A and B is an unlikely source of emission in this system. Magnetospheric interactions over scales of up to 50 R∗ have been implicated in outbursts from solar-mass T Tauri binaries (Massi et al., 2006, 2008). However, the estimated 30 R∗ size of a typical L dwarf magnetic field (Schrijver, 2009)101010The field size is take to be the Chapman-Ferraro radius, where the magnetic field pressure balances ram pressure from the interstellar medium. This size scales as a weak function of the magnetic field strength, with RCF/R∗ B1/3. is still several orders of magnitude smaller than the projected separation of the 2MASS J13152649 binary. In addition, the possibility that the observed nonthermal emission arises from the secondary, rather than the primary, is unlikely. This scenario would imply a relative emission luminosity of 2.5 for the secondary, an amplitude seen only during exceptionally large flare bursts from M and L dwarfs (e.g., Schmidt et al. 2007; Hilton et al. 2010). While other interactions could be postulated (e.g., magnetic wind interactions, Kozai-like perturbations of an unseen third component), these scenarios are far more complex than the simple hypothesis of enhanced chromospheric emission powered by a strong magnetic field around a relatively old and massive cool dwarf. In other words, while the presence of a low-mass T dwarf secondary in this system is certainly intriguing, it appears to play no role in the observed nonthermal emission.
6. Summary
We have identified a T7 brown dwarf companion to the unusually active L5e dwarf 2MASS J13152649, a source that continues to exhibit strong H I and alkali line emission despite its late spectral type. Resolved imaging and spectroscopy confirm the pair to be co-moving and co-spatial, and evolutionary models indicate an unusually low mass ratio as compared to other low-mass field binaries. The spectral and kinematic properties of both components confirm prior indications that this system is relatively old ( 0.8–1.0 Gyr), and likely a member of the old Galactic disk population. Joint comparison to atmospheric and evolutionary models (a coevality test) also supports an older age for this system, but reveals discrepancies in the case of the secondary; we suspect these are due to continued shortcomings in the modeling cool brown dwarf spectra. The age and separation of the system, coupled with the narrow emission lines and absence of mid-infrared excess, rule out accretion from or magnetic interaction with the T dwarf secondary as the emission source. Rather, we attribute it to an unusually strong magnetic field as predicted by energy flux scaling arguments for relatively old and massive low-mass dwarfs. A direct test of this hypothesis can be achieved through Zeeman line broadening measurements, although the source of chromospheric heating remains a separate issue. Whether the larger sample of hyperactive cool dwarfs are also old, relatively massive, and possess strong magnetic fields remains to be determined, but they hint at a remarkable inversion of the standard age-activity relationship for low-mass stars.
References
- Allard et al. (2003) Allard, F., Guillot, T., Ludwig, H.-G., Hauschildt, P. H., Schweitzer, A., Alexander, D. R., & Ferguson, J. W. 2003, in IAU Symposium, Vol. 211, Brown Dwarfs, ed. E. Martín, 325–+
- Allard et al. (2010) Allard, F., Homeier, D., & Freytag, B. 2010, ArXiv e-prints
- Allen (2007) Allen, P. R. 2007, ApJ, 668, 492
- Allers et al. (2007) Allers, K. N., Jaffe, D. T., Luhman, K. L., Liu, M. C., Wilson, J. C., Skrutskie, M. F., Nelson, M., Peterson, D. E., Smith, J. D., & Cushing, M. C. 2007, ApJ, 657, 511
- Antonova et al. (2008) Antonova, A., Doyle, J. G., Hallinan, G., Bourke, S., & Golden, A. 2008, A&A, 487, 317
- Asplund et al. (2009) Asplund, M., Grevesse, N., Sauval, A. J., & Scott, P. 2009, ARA&A, 47, 481
- Baraffe et al. (2003) Baraffe, I., Chabrier, G., Barman, T. S., Allard, F., & Hauschildt, P. H. 2003, A&A, 402, 701
- Barrado Y Navascués (2006) Barrado Y Navascués, D. 2006, A&A, 459, 511
- Berger (2002) Berger, E. 2002, ApJ, 572, 503
- Berger (2006) —. 2006, ApJ, 648, 629
- Blake et al. (2010) Blake, C. H., Charbonneau, D., & White, R. J. 2010, ApJ, 723, 684
- Bochanski et al. (2009) Bochanski, J. J., Hennawi, J. F., Simcoe, R. A., Prochaska, J. X., West, A. A., Burgasser, A. J., Burles, S. M., Bernstein, R. A., Williams, C. L., & Murphy, M. T. 2009, PASP, 121, 1409
- Bowler et al. (2009) Bowler, B. P., Liu, M. C., & Cushing, M. C. 2009, ApJ, 706, 1114
- Browning (2008) Browning, M. K. 2008, ApJ, 676, 1262
- Burgasser (2007a) Burgasser, A. J. 2007a, ApJ, 659, 655
- Burgasser (2007b) —. 2007b, AJ, 134, 1330
- Burgasser et al. (2010a) Burgasser, A. J., Cruz, K. L., Cushing, M., Gelino, C. R., Looper, D. L., Faherty, J. K., Kirkpatrick, J. D., & Reid, I. N. 2010a, ApJ, 710, 1142
- Burgasser et al. (2002a) Burgasser, A. J., Kirkpatrick, J. D., Brown, M. E., Reid, I. N., Burrows, A., Liebert, J., Matthews, K., Gizis, J. E., Dahn, C. C., Monet, D. G., Cutri, R. M., & Skrutskie, M. F. 2002a, ApJ, 564, 421
- Burgasser et al. (2000) Burgasser, A. J., Kirkpatrick, J. D., Reid, I. N., Liebert, J., Gizis, J. E., & Brown, M. E. 2000, AJ, 120, 473
- Burgasser et al. (2002b) Burgasser, A. J., Liebert, J., Kirkpatrick, J. D., & Gizis, J. E. 2002b, AJ, 123, 2744
- Burgasser et al. (2008a) Burgasser, A. J., Liu, M. C., Ireland, M. J., Cruz, K. L., & Dupuy, T. J. 2008a, ApJ, 681, 579
- Burgasser et al. (2010b) Burgasser, A. J., Looper, D., & Rayner, J. T. 2010b, AJ, 139, 2448
- Burgasser et al. (2008b) Burgasser, A. J., Looper, D. L., Kirkpatrick, J. D., Cruz, K. L., & Swift, B. J. 2008b, ApJ, 674, 451
- Burgasser & McElwain (2006) Burgasser, A. J., & McElwain, M. W. 2006, AJ, 131, 1007
- Burgasser & Putman (2005) Burgasser, A. J., & Putman, M. E. 2005, ApJ, 626, 486
- Burgasser et al. (2007) Burgasser, A. J., Reid, I. N., Siegler, N., Close, L., Allen, P., Lowrance, P., & Gizis, J. 2007, Protostars and Planets V, 427
- Burgasser et al. (2010c) Burgasser, A. J., Simcoe, R. A., Bochanski, J. J., Saumon, D., Mamajek, E. E., Cushing, M. C., Marley, M. S., McMurtry, C., Pipher, J. L., & Forrest, W. J. 2010c, ApJ, 725, 1405
- Burningham et al. (2010) Burningham, B., Leggett, S. K., Lucas, P. W., Pinfield, D. J., Smart, R. L., Day-Jones, A. C., Jones, H. R. A., Murray, D., Nickson, E., Tamura, M., Zhang, Z., Lodieu, N., Tinney, C. G., & Zapatero Osorio, M. R. 2010, MNRAS, 404, 1952
- Burrows et al. (1997) Burrows, A., Marley, M., Hubbard, W. B., Lunine, J. I., Guillot, T., Saumon, D., Freedman, R., Sudarsky, D., & Sharp, C. 1997, ApJ, 491, 856
- Chabrier & Baraffe (2000) Chabrier, G., & Baraffe, I. 2000, ARA&A, 38, 337
- Chabrier et al. (1996) Chabrier, G., Baraffe, I., & Plez, B. 1996, ApJ, 459, L91+
- Chauvin et al. (2004) Chauvin, G., Lagrange, A.-M., Dumas, C., Zuckerman, B., Mouillet, D., Song, I., Beuzit, J.-L., & Lowrance, P. 2004, A&A, 425, L29
- Chauvin et al. (2005) —. 2005, A&A, 438, L25
- Christensen et al. (2009) Christensen, U. R., Holzwarth, V., & Reiners, A. 2009, Nature, 457, 167
- Cruz et al. (2009) Cruz, K. L., Kirkpatrick, J. D., & Burgasser, A. J. 2009, AJ, 137, 3345
- Cushing et al. (2008) Cushing, M. C., Marley, M. S., Saumon, D., Kelly, B. C., Vacca, W. D., Rayner, J. T., Freedman, R. S., Lodders, K., & Roellig, T. L. 2008, ApJ, 678, 1372
- Cushing et al. (2005) Cushing, M. C., Rayner, J. T., & Vacca, W. D. 2005, ApJ, 623, 1115
- Cushing et al. (2004) Cushing, M. C., Vacca, W. D., & Rayner, J. T. 2004, PASP, 116, 362
- Dehnen & Binney (1998) Dehnen, W., & Binney, J. J. 1998, MNRAS, 298, 387
- Dobler et al. (2006) Dobler, W., Stix, M., & Brandenburg, A. 2006, ApJ, 638, 336
- Dupuy & Liu (2007) Dupuy, T. J., & Liu, M. C. 2007, in Bulletin of the American Astronomical Society, Vol. 38, American Astronomical Society Meeting Abstracts, 103.26–+
- Dupuy et al. (2009a) Dupuy, T. J., Liu, M. C., & Ireland, M. J. 2009a, ApJ, 692, 729
- Dupuy et al. (2009b) —. 2009b, ApJ, 699, 168
- Durney et al. (1993) Durney, B. R., De Young, D. S., & Roxburgh, I. W. 1993, Sol. Phys., 145, 207
- Faherty et al. (2009) Faherty, J. K., Burgasser, A. J., Cruz, K. L., Shara, M. M., Walter, F. M., & Gelino, C. R. 2009, AJ, 137, 1
- Freedman et al. (2008) Freedman, R. S., Marley, M. S., & Lodders, K. 2008, ApJS, 174, 504
- Freytag et al. (2010) Freytag, B., Allard, F., Ludwig, H., Homeier, D., & Steffen, M. 2010, A&A, 513, A19+
- Fuhrmeister et al. (2005) Fuhrmeister, B., Schmitt, J. H. M. M., & Hauschildt, P. H. 2005, A&A, 439, 1137
- Geißler et al. (2011) Geißler, K., Metchev, S., Kirkpatrick, J. D., Berriman, G. B., & Looper, D. 2011, ArXiv e-prints
- Gelino & Burgasser (2010) Gelino, C. R., & Burgasser, A. J. 2010, AJ, 140, 110
- Gelino et al. (2002) Gelino, C. R., Marley, M. S., Holtzman, J. A., Ackerman, A. S., & Lodders, K. 2002, ApJ, 577, 433
- Gizis (2002) Gizis, J. E. 2002, ApJ, 575, 484
- Gizis et al. (2000) Gizis, J. E., Monet, D. G., Reid, I. N., Kirkpatrick, J. D., Liebert, J., & Williams, R. J. 2000, AJ, 120, 1085
- Gizis et al. (2002) Gizis, J. E., Reid, I. N., & Hawley, S. L. 2002, AJ, 123, 3356
- Golimowski et al. (2004) Golimowski, D. A., et al. 2004, AJ, 127, 3516
- Hall (2002a) Hall, P. B. 2002a, ApJ, 580, L77
- Hall (2002b) —. 2002b, ApJ, 564, L89
- Hallinan et al. (2008) Hallinan, G., Antonova, A., Doyle, J. G., Bourke, S., Lane, C., & Golden, A. 2008, ApJ, 684, 644
- Hamuy et al. (1994) Hamuy, M., Suntzeff, N. B., Heathcote, S. R., Walker, A. R., Gigoux, P., & Phillips, M. M. 1994, PASP, 106, 566
- Hauschildt et al. (1999) Hauschildt, P. H., Allard, F., Ferguson, J., Baron, E., & Alexander, D. R. 1999, ApJ, 525, 871
- Helling et al. (2011) Helling, C., Jardine, M., Witte, S., & Diver, D. A. 2011, ApJ, 727, 4
- Hilton et al. (2010) Hilton, E. J., West, A. A., Hawley, S. L., & Kowalski, A. F. 2010, AJ, 140, 1402
- Kasper et al. (2009) Kasper, M., Burrows, A., & Brandner, W. 2009, ApJ, 695, 788
- King et al. (2010) King, R. R., McCaughrean, M. J., Homeier, D., Allard, F., Scholz, R., & Lodieu, N. 2010, A&A, 510, A99+
- Kirkpatrick et al. (2006) Kirkpatrick, J. D., Barman, T. S., Burgasser, A. J., McGovern, M. R., McLean, I. S., Tinney, C. G., & Lowrance, P. J. 2006, ApJ, 639, 1120
- Kirkpatrick et al. (2010) Kirkpatrick, J. D., Looper, D. L., Burgasser, A. J., Schurr, S. D., Cutri, R. M., Cushing, M. C., Cruz, K. L., Sweet, A. C., Knapp, G. R., Barman, T. S., Bochanski, J. J., Roellig, T. L., McLean, I. S., McGovern, M. R., & Rice, E. L. 2010, ApJS, 190, 100
- Kirkpatrick et al. (2000) Kirkpatrick, J. D., Reid, I. N., Liebert, J., Gizis, J. E., Burgasser, A. J., Monet, D. G., Dahn, C. C., Nelson, B., & Williams, R. J. 2000, AJ, 120, 447
- Kirkpatrick et al. (2008) Kirkpatrick, J. D., et al. 2008, ApJ, 689, 1295
- Konopacky et al. (2010) Konopacky, Q. M., Ghez, A. M., Barman, T. S., Rice, E. L., Bailey, J. I., White, R. J., McLean, I. S., & Duchêne, G. 2010, ApJ, 711, 1087
- Krabbe et al. (2004) Krabbe, A., Gasaway, T., Song, I., Iserlohe, C., Weiss, J., Larkin, J. E., Barczys, M., & Lafreniere, D. 2004, in Presented at the Society of Photo-Optical Instrumentation Engineers (SPIE) Conference, Vol. 5492, Society of Photo-Optical Instrumentation Engineers (SPIE) Conference Series, ed. A. F. M. Moorwood & M. Iye, 1403–1410
- Larkin et al. (2006) Larkin, J., Barczys, M., Krabbe, A., Adkins, S., Aliado, T., Amico, P., Brims, G., Campbell, R., Canfield, J., Gasaway, T., Honey, A., Iserlohe, C., Johnson, C., Kress, E., LaFreniere, D., Lyke, J., Magnone, K., Magnone, N., McElwain, M., Moon, J., Quirrenbach, A., Skulason, G., Song, I., Spencer, M., Weiss, J., & Wright, S. 2006, in Presented at the Society of Photo-Optical Instrumentation Engineers (SPIE) Conference, Vol. 6269, Society of Photo-Optical Instrumentation Engineers (SPIE) Conference Series
- Leggett et al. (2010) Leggett, S. K., Burningham, B., Saumon, D., Marley, M. S., Warren, S. J., Smart, R. L., Jones, H. R. A., Lucas, P. W., Pinfield, D. J., & Tamura, M. 2010, ApJ, 710, 1627
- Liebert & Burgasser (2007) Liebert, J., & Burgasser, A. J. 2007, ApJ, 655, 522
- Liebert et al. (2003) Liebert, J., Kirkpatrick, J. D., Cruz, K. L., Reid, I. N., Burgasser, A., Tinney, C. G., & Gizis, J. E. 2003, AJ, 125, 343
- Liu et al. (2008) Liu, M. C., Dupuy, T. J., & Ireland, M. J. 2008, ApJ, 689, 436
- Liu et al. (2010) Liu, M. C., Dupuy, T. J., & Leggett, S. K. 2010, ApJ, 722, 311
- Liu et al. (2006) Liu, M. C., Leggett, S. K., Golimowski, D. A., Chiu, K., Fan, X., Geballe, T. R., Schneider, D. P., & Brinkmann, J. 2006, ApJ, 647, 1393
- Looper et al. (2008a) Looper, D. L., Gelino, C. R., Burgasser, A. J., & Kirkpatrick, J. D. 2008a, ApJ, 685, 1183
- Looper et al. (2008b) Looper, D. L., Kirkpatrick, J. D., Cutri, R. M., Barman, T., Burgasser, A. J., Cushing, M. C., Roellig, T., McGovern, M. R., McLean, I. S., Rice, E., Swift, B. J., & Schurr, S. D. 2008b, ApJ, 686, 528
- Marshall et al. (2008) Marshall, J. L., Burles, S., Thompson, I. B., Shectman, S. A., Bigelow, B. C., Burley, G., Birk, C., Estrada, J., Jones, P., Smith, M., Kowal, V., Castillo, J., Storts, R., & Ortiz, G. 2008, in Society of Photo-Optical Instrumentation Engineers (SPIE) Conference Series, Vol. 7014, Society of Photo-Optical Instrumentation Engineers (SPIE) Conference Series
- Massi et al. (2006) Massi, M., Forbrich, J., Menten, K. M., Torricelli-Ciamponi, G., Neidhöfer, J., Leurini, S., & Bertoldi, F. 2006, A&A, 453, 959
- Massi et al. (2008) Massi, M., Ros, E., Menten, K. M., Kaufman Bernadó, M., Torricelli-Ciamponi, G., Neidhöfer, J., Boden, A., Boboltz, D., Sargent, A., & Torres, G. 2008, A&A, 480, 489
- McGovern et al. (2004) McGovern, M. R., Kirkpatrick, J. D., McLean, I. S., Burgasser, A. J., Prato, L., & Lowrance, P. J. 2004, ApJ, 600, 1020
- Meyer & Meyer-Hofmeister (1999) Meyer, F., & Meyer-Hofmeister, E. 1999, A&A, 341, L23
- Mohanty & Basri (2003) Mohanty, S., & Basri, G. 2003, ApJ, 583, 451
- Mohanty et al. (2002) Mohanty, S., Basri, G., Shu, F., Allard, F., & Chabrier, G. 2002, ApJ, 571, 469
- Mohanty et al. (2007) Mohanty, S., Jayawardhana, R., Huélamo, N., & Mamajek, E. 2007, ApJ, 657, 1064
- Monet et al. (2003) Monet, D. G., Levine, S. E., Canzian, B., Ables, H. D., Bird, A. R., Dahn, C. C., Guetter, H. H., Harris, H. C., Henden, A. A., Leggett, S. K., Levison, H. F., Luginbuhl, C. B., Martini, J., Monet, A. K. B., Munn, J. A., Pier, J. R., Rhodes, A. R., Riepe, B., Sell, S., Stone, R. C., Vrba, F. J., Walker, R. L., Westerhout, G., Brucato, R. J., Reid, I. N., Schoening, W., Hartley, M., Read, M. A., & Tritton, S. B. 2003, AJ, 125, 984
- Pravdo et al. (2006) Pravdo, S. H., Shaklan, S. B., Wiktorowicz, S. J., Kulkarni, S., Lloyd, J. P., Martinache, F., Tuthill, P. G., & Ireland, M. J. 2006, ApJ, 649, 389
- Rayner et al. (2003) Rayner, J. T., Toomey, D. W., Onaka, P. M., Denault, A. J., Stahlberger, W. E., Vacca, W. D., Cushing, M. C., & Wang, S. 2003, PASP, 115, 362
- Rebolo et al. (1992) Rebolo, R., Martin, E. L., & Magazzu, A. 1992, ApJ, 389, L83
- Reid et al. (2008) Reid, I. N., Cruz, K. L., Kirkpatrick, J. D., Allen, P. R., Mungall, F., Liebert, J., Lowrance, P., & Sweet, A. 2008, AJ, 136, 1290
- Reid et al. (2000) Reid, I. N., Kirkpatrick, J. D., Gizis, J. E., Dahn, C. C., Monet, D. G., Williams, R. J., Liebert, J., & Burgasser, A. J. 2000, AJ, 119, 369
- Reid et al. (1999) Reid, I. N., Kirkpatrick, J. D., Gizis, J. E., & Liebert, J. 1999, ApJ, 527, L105
- Reiners & Basri (2007) Reiners, A., & Basri, G. 2007, ApJ, 656, 1121
- Reiners & Basri (2008) —. 2008, ApJ, 684, 1390
- Reiners & Basri (2010) —. 2010, ApJ, 710, 924
- Reiners & Christensen (2010) Reiners, A., & Christensen, U. R. 2010, A&A, 522, A13+
- Riaz & Gizis (2007) Riaz, B., & Gizis, J. E. 2007, ApJ, 659, 675
- Saumon & Marley (2008) Saumon, D., & Marley, M. S. 2008, ApJ, 689, 1327
- Saumon et al. (2006) Saumon, D., Marley, M. S., Cushing, M. C., Leggett, S. K., Roellig, T. L., Lodders, K., & Freedman, R. S. 2006, ApJ, 647, 552
- Schmidt et al. (2007) Schmidt, S. J., Cruz, K. L., Bongiorno, B. J., Liebert, J., & Reid, I. N. 2007, AJ, 133, 2258
- Schmidt et al. (2010) Schmidt, S. J., West, A. A., Hawley, S. L., & Pineda, J. S. 2010, AJ, 139, 1808
- Scholz (2010) Scholz, R. 2010, A&A, 510, L8+
- Schrijver (2009) Schrijver, C. J. 2009, ApJ, 699, L148
- Shulyak et al. (2010) Shulyak, D., Reiners, A., Wende, S., Kochukhov, O., Piskunov, N., & Seifahrt, A. 2010, A&A, 523, A37+
- Simons & Tokunaga (2002) Simons, D. A., & Tokunaga, A. 2002, PASP, 114, 169
- Skrutskie et al. (2006) Skrutskie, M. F., et al. 2006, AJ, 131, 1163
- Soubiran et al. (2003) Soubiran, C., Bienaymé, O., & Siebert, A. 2003, A&A, 398, 141
- Spiegel et al. (2011) Spiegel, D. S., Burrows, A., & Milsom, J. A. 2011, ApJ, 727, 57
- Tokunaga et al. (2002) Tokunaga, A. T., Simons, D. A., & Vacca, W. D. 2002, PASP, 114, 180
- Vacca et al. (2003) Vacca, W. D., Cushing, M. C., & Rayner, J. T. 2003, PASP, 115, 389
- van Dam et al. (2006) van Dam, M. A., et al. 2006, PASP, 118, 310
- Vrba et al. (2004) Vrba, F. J., Henden, A. A., Luginbuhl, C. B., Guetter, H. H., Munn, J. A., Canzian, B., Burgasser, A. J., Kirkpatrick, J. D., Fan, X., Geballe, T. R., Golimowski, D. A., Knapp, G. R., Leggett, S. K., Schneider, D. P., & Brinkmann, J. 2004, AJ, 127, 2948
- Wende et al. (2010) Wende, S., Reiners, A., Seifahrt, A., & Bernath, P. F. 2010, A&A, 523, A58+
- West et al. (2006) West, A. A., Bochanski, J. J., Hawley, S. L., Cruz, K. L., Covey, K. R., Silvestri, N. M., Reid, I. N., & Liebert, J. 2006, AJ, 132, 2507
- West et al. (2008) West, A. A., Hawley, S. L., Bochanski, J. J., Covey, K. R., Reid, I. N., Dhital, S., Hilton, E. J., & Masuda, M. 2008, AJ, 135, 785
- West et al. (2004) West, A. A., Hawley, S. L., Walkowicz, L. M., Covey, K. R., Silvestri, N. M., Raymond, S. N., Harris, H. C., Munn, J. A., McGehee, P. M., Ivezić, Ž., & Brinkmann, J. 2004, AJ, 128, 426
- West et al. (2011) West, A. A., Morgan, D. P., Bochanski, J. J., Andersen, J. M., Bell, K. J., Kowalski, A. F., Davenport, J. R. A., Hawley, S. L., Schmidt, S. J., Bernat, D., Hilton, E. J., Muirhead, P., Covey, K. R., Rojas-Ayala, B., Schlawin, E., Gooding, M., Schluns, K., Dhital, S., Pineda, J. S., & Jones, D. O. 2011, AJ, 141, 97
- Wizinowich et al. (2006) Wizinowich, P. L., et al. 2006, PASP, 118, 297
- Zapatero Osorio et al. (2006) Zapatero Osorio, M. R., Martín, E. L., Bouy, H., Tata, R., Deshpande, R., & Wainscoat, R. J. 2006, ApJ, 647, 1405