Shallow pockets and very strong coupling superconductivity in FeSexTe1-x
Abstract
We measured the electronic-structure of FeSexTe1-x above and below Tc. In the normal state we find multiple bands with remarkably small values for the Fermi energy . Yet,below Tc we find a superconducting gap that is comparable in size to , leading to a ratio that is much larger than found in any previously studied superconductor. We also observe an anomalous dispersion of the coherence peak which is very similar to the dispersion found in cold Fermi-gas experiments and which is consistent with the predictions of the BCS-BEC crossover theory.
The celebrated BCS theory, one of the greatest achievements in physics, is capable of explaining the behavior of metallic superconductors, but many believe that it is not adequate to deal with the newer high-temperature superconductors, the cuprates and the iron-based superconductors.
A possible extension of the BCS theory is provided by the BCS-BEC theory, which is based on the observation that the BCS wave-function can describe both a system of weakly interacting pairs and a BEC system of molecules of strongly-bounded fermions, as long as the chemical potential of the fermions is allowed to change sign as the interaction strength is increased. The behavior of the interacting fermionic system is governed by the interplay between the paring interaction represented by , the energy-gap, and the kinetic energy represented by the Fermi energy .
Cold fermi gasses present the best way to see directly the BCS-BEC crossover – the Feshbach resonance offers a way to continuously change the interaction between the atomsJin_crossover ; Ketterle . As the interaction strength is increased it is possible to observe the change in the chemical potential, . It was shown using a novel RF-spectroscopy technique Jin_ARPES that the momentum-distribution of the fermions changes in the way predicted by the BCS-BEC theoryEagles ; Leggett ; Mohit_review .
Up to now, a similar change in the momentum distribution has never been found in a solid material. The underdoped cuprates were considered the best candidates, since they have large gaps, of the order of 50 meV, and low carrier concentration, resulting in . It was suggested that many of the unconventional properties of the underdoped cuprates could be explained by the BCS-BEC crossover physicsLevin_HighTc ; Perali_BCS_BEC ; Ranninger , but spectroscopic evidence of a change in was never found.
In this paper we show that the iron-chalcogenides are closer to the BCS-BEC crossover than the cuprates in terms of and that indeed below the electronic dispersion is consistent with the prediction of the BCS-BEC theory. In a multi-band material we must introduce a Fermi energy for each band, defined for electron-like (hole-like) bands as the energy of the highest occupied state relative to the bottom (top) of the band. In particular, we find that the ratio is sizeable for all bands. Furthermore, we find significant renormalization of the electronic dispersion below , such that for the hole-like bands becomes small or perhaps even negative, in close analogy to effects seen at the BCS-BEC crossover in cold Fermi gasses.
Superconductivity in the FeSe system (referred to as the “11” system) with a of 8K was discovered in 2008 Wu_PNAS , later on it was shown that by replacing part of the Se with Te can be increased up to 15K Wu_EPL . The iron-chalcogenides seem to be more strongly correlated compared to other iron-based superconductors (SC) Johnston .
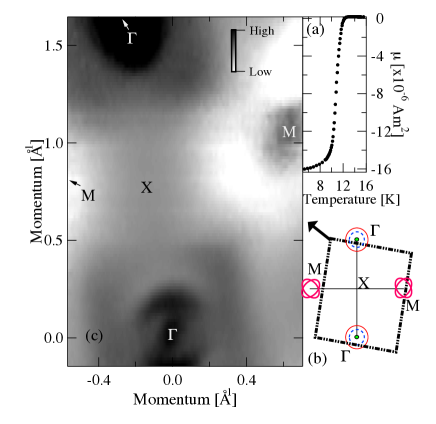
All the iron-based superconductors are multi-band materials, which has a great impact on their transport properties and is believed to play a major role in the mechanism of superconductivity. The band structure of the “11” system is similar to that of other iron-based superconductors. Calculations show hole-like bands at the center of the Brillouin zone ( point), and electron-like bands around the M-point( see Fig. 1b). Combining the multi-band nature of the material and the strong-correlations, FeSexTe1-x is expected to have a rather complicated electronic-structure.
We have performed Angle Resolved Photoemission Electron Spectroscopy (ARPES) measurements in order to map the band structure, both above and below . For the ARPES experiments we have grown high-quality single crystals of FeSexTe1-x using the “self-flux” method self_flux . Energy Dispersive Spectroscopy shows a uniform composition with x=0.35. of these crystals is 12.5K, as found using SQUID magnetometry (see Fig 1a). The transition is sharp ( T 1K) and the magnetic moment size indicates a large superconducting volume fraction. The ARPES measurements were done at the Technion, using a Scienta R4000 and the HeIα line (21.218eV) from an He lamp. Crystals of typical size of mm2 were cleaved in-situ at a pressure lower than torr. The samples were cleaved at 8K, and measured below and above .
We find a band structure similar to the one reported in previous ARPES work Tamai ; Nakayama ; Feng . The symmetry and number of different bands agrees with the calculated band structure but the effective masses are strongly renormalized.
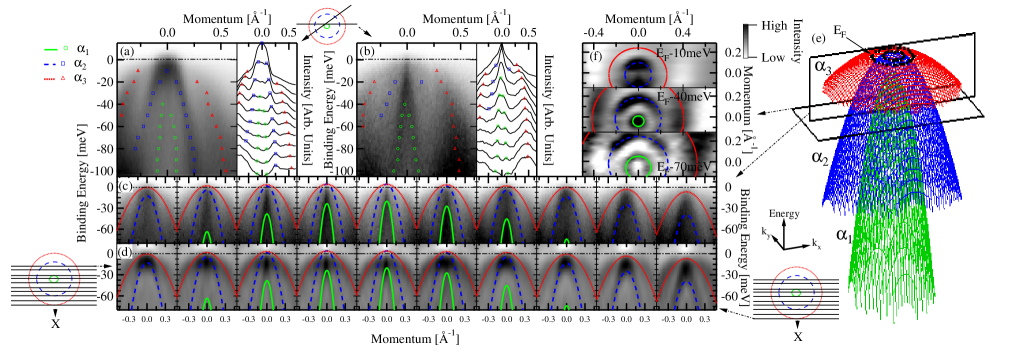
We start with the region around the point. The band structre above , at 15K, can be seen in Fig 2. The different orbital-character of the bands leads to strong polarization and orientation dependence of the intensity Feng . In panels (a) and (b) we show ARPES data and the corresponding Momentum Distribution Curves (MDC) taken with the detector parallel to M and to the X direction, respectively. Three bands can be identified, we use the notation; , and following Ref. Tamai . is more pronounced in panel (b) and in panel (a). is weak but visible in both orientations. In order to extract the masses and the Fermi-crossing points of the different bands we did the following: we measured many cuts covering a rather large region around . Some of these cuts can be seen in panel (c), the second derivative of the same cuts are shown in panel (d). For each cut we used the MDCs to map out the dispersion. We used data from all the cuts to reconstruct the 2D band structure, fitting the data using three circular-paraboloids. The results are shown in panel (e). The fit to the data is excellent, and it allows us to extract with a reasonably small uncertainty the Fermi-crossing points and the value of for the various bands. The solid lines in panels (c) and (d) represents the fit results along different momentum cuts. In panel (f) we show intensity maps as a function of kx and ky at three different binding-energies: 10 meV, 40 meV and 70 meV. The solid lines are again the fit results now shown for the corresponding binding energies.
We find that only and cross the Fermi-energy and create hole-pockets. ends about 25meV below the Fermi-surface. We find the following masses for the different bands: = 1.00.3 , = 3.40.5 and = 14 . These values are in good agreement with previous work Tamai . The two bands that form the Fermi-surface are strongly renormalized in comparison to the calculated band-structure. We find two very shallow pockets; based on the fit we estimate to be 42.5 meV for both pockets. This is a surprising result: a metal with such a small Fermi-energy can’t be considered a degenerate-Fermi gas even at room temperature. This is expected to lead to a non-trivial temperature dependence of various transport properties, as indeed was found for example for the Seebeck coefficient Thermo and Hall resistivity Hall .
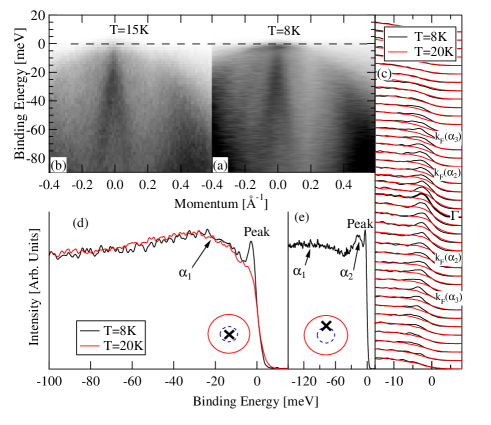
When we lower the temperature below , we find surprising results. In Fig 3a we show the raw ARPES data of a cut going trough the point taken below . In contrast to the data taken above , Fig. 3b, one can clearly see the emergence of a coherence peak below . In panel (c) there is a direct comparison of the Energy Distribution Curves (EDCs) measured at 20K and at 8K, the new peak is very sharp, its width is about 3meV and it is probably resolution limited. The coherence peak can be found over a large portion of the zone centered around the point, it is pronounced at that point although there in no Fermi-crossing point in the near vicinity. In panel (d) we compare the EDC at the point above and below . There is an “hump” peaked around 25meV which its origin is the band, the hump position and shape does not depend on temperature. Below there is in addition a sharp peak. For comparison we show in panel (e) the EDC below at a momentum point which lies between the two Fermi-pockets (see inset), here it is possible to identify both and in addition to the sharp coherence peak. It is possible to follow the coherence peak even beyond kF of the band.
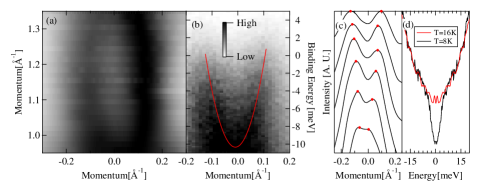
The data for the M-point region is not as clear. Figure 4a shows the intensity map at the Fermi level, consisting of one oval pocket. A second oval pocket, which is predicted by symmetry arguments to be perpendicular to the first, cannot be resolved. A scan through the M point is shown in Fig. 4b, demonstrating a very shallow electron-like pocket (The MDCs are shown in pabel (c)). The bottom of this band is about 10 meV below the Fermi level. We find that band to have a mass of 4 0.5 me, in reasonable agreement with band-structure calculations. Again, we find a very shallow pocket with a similar to the one we find for the hole pockets. In panel (d) we compare the EDC at measured above and below . There is clearly a superconducting gap, but no coherence peaks. So far the size of the SC gap in the electron-pocket was not reported. The absence of peaks and the large intensity tail coming from the hole-like band laying beneath the electron-like one, makes it difficult to measure the gap very precisely, but we estimate it to be of the order of 5meV.
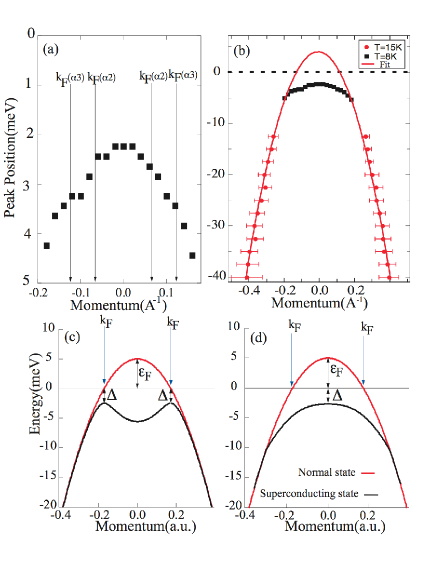
The coherence peak position disperses as one moves from the point, as shown in Fig 5a. In Fig 5b we show the dispersion of the band and of the coherence peak. The dispersion of the band was extracted from the MDC peak positions.
We can follow the band up to 12meV from , the same dispersion is found above and below within the error bars shown in the figure. The signal is very weak when approaching , and it is unlikely that this is attributed to a matrix-element effect since the intensity depends on the binding energy very strongly. This is a pseudogap, which is expected in the normal state when the interaction is strong enough Perali_PG . The strong interactions broaden all the features making it impossible to follow the dispersion in the psedogap state up to .
The dispersion below Tc was extracted by following the peak-position in the EDCs. Remarkably, the minimal gap is found exactly at the point, and not around . In fact, nothing special happens at , as can be seen in panel (a). The coherence-peak dispersion reveals a very flat dispersion below , in order to relate the dispersion of the coherence-peak to that of we must conclude that the effective mass is strongly renormalized when the sample becomes superconducting.
The gap size at the point is meV; the zero temperature gap should be somewhat larger. Comparing that to , we get . This is a large number, suggesting strong-coupling superconductivity in FeSexTe1-x. For comparison in optimally doped Bi2212. Before moving-on, let us summarize our findings: we find in the normal state that both the electron- and hole-like bands in Fe FeSexTe1-x form very shallow pockets, on the order of few meV, we anticipate that this might lead to an unusual electronic-structure below and indeed we find a coherence peak with a minimal gap at the point and not at .
In the BCS theory, below the quasiparticle dispersion is given by:
| (1) |
where is the gap function and is the band dispersion measured relative to a band-dependent shift . Here, , and the sign of depends on whether the band is electron-like or hole-like. For a single band, it is conventional to replace by the chemical potential within the crossover mean field theory. In the current context, however, we prefer to use , since each band has its own Fermi energy, and in order to allow for the independent renormalization of the bands’ Fermi energy, e.g. due to self-energy effects below CarlsonReddy .
To find and one needs to solve the BCS gap and number equations self-consistently Schriefer . In the weak coupling limit to an excellent approximation and we get the Bogolyubov dispersion with the characteristic back-bending of the occupied branch. The dispersion is given by , where the energy is measured relative to . The weak-coupling situation for a hole-like band is shown in Fig 5c. In this case the minimum of the energy-gap occurs at and its value is . At k=0 the quasiparticle energy is . This characteristic dispersion was measured using ARPES in the cuprates JC back bending and in the pnictides Hong peak .
On the other hand, when the interaction is strong enough, there will be a significant shift in . As becomes smaller, the position where the gap-minimum is found shifts away from the normal state kF towards k=0. In the extreme case where reaches zero (or changes sign) the minimum of the gap moves to the point and its value becomes Mohit_review . This quasiparticle dispersion as predicted by the model in the case where is exactly 0 is shown in Fig. 5d. The similarity to our data, shown in Fig. 5b, is striking.
We find . This estimate is based on the assumption that is close to zero. Although we cannot determine and independently, our data is not consistent with a very negative , as that would lead to a much larger binding-energy at the point than the normal-state . On the other hand, if the change in were small, the minimum of the binding-energy below would be at instead of at the point. This indicates that our sample does not lie deep in either the BCS or BEC regimes but lies instead in the crossover regime.
Note that in cold fermion gasses, the number of particles is kept constant and the BEC-BCS crossover is reached by tuning the interaction strength by going through a Feshbach resonance. By comparison, in ARPES experiments, the chemical potential is tethered to the reference sample, gold in our case. Although we are not free to change the chemical potential, we find that below there is substantial renormalization of the electronic dispersion, forcing one of the hole bands to move across the chemical potential.
In its simplest form, the BCS-BEC crossover theory is in good qualitative agreement with our data, although it doesn’t give a full quantitative description. In particular, the mean-field theory predicts that for a 2D system the gap must be twice as large as in order for to change sign upon crossing 2D_BCS_BEC . To get quantitative agreement one may need to include multiple bands, momentum-dependent interactions, and self-energy corrections, which play an important role in renormalizing the band structure.
There may be alternative ways to interpret our ARPES data. The line-shape with the sharp peak at the gap edge below and the broader hump at lower energies (see Fig 3d) is very similar to the ARPES line shape found in the underdoped cuprates. In the cuprates the line shape and the anomalous dispersion were explained as a result of the appearance of a resonance-mode seen in neutron data Norman . In Bi2212 the peak is found even as one moves away from , which is consistent with our finding. Recently a resonance-mode was found in FeSexTe1-x with an energy of 6.5meV Qiu_res_mode , this energy seems to be a bit too large since the resonance-mode model requires . It is difficult to see a reason for the resonance-mode interaction with the electrons to shift the minimum of the excaitation-gap from kF to zero, but we can’t rule out the possibility that the resonance-mode plays a role in shaping the electronic dispersion below .
To summarize, we measured in detail the band structure of FeSexTe1-x, we find both the electron and the hole-pockets to be very shallow with of the order of few meV. Below we find a SC gap which its size is a substantial fraction of , suggesting that FeSexTe1-x is on the verge of the BCS-BEC crossover limit. The anomalous dispersion of the coherence peak is in agreement with such a suggestion.
We acknowledge useful discussions with Mohit Randeria. This research was supported by the Israeli Science Foundation and by the E. and J. Bishop research fund.
References
- (1) C. A. Regal, M. Greiner and D. S. Jin, Phys. Rev. Lett. 92, 040403 (2004).
- (2) M. W. Zwierlein, C. A. Stan, C. H. Schunck, S. M. F. Raupach, A. J. Kerman, and W. Ketterle, Phys. Rev. Lett. 92, 120403 (2004).
- (3) J. T. Stewart, J. P. Gaebler, and D. S. Jin, Nature 454, 744 (2008).
- (4) D. M. Eagles, Phys. Rev. 186, 456 (1969).
- (5) A. J. Leggett, in Modern Trends in the Theory of Condensed Matter (Springer-Verlag), pp. 13–27 (1980).
- (6) M. Randeria, in Bose-Einstein Condensation ed. A. Griffin, D. Snoke and S. Stringari (Cambridge University Press), 355 (1995).
- (7) Q. Chen, J. Stajic, and K. Levin, Low Temp. Phys. 32, 406 (2006).
- (8) Perali, A., Pieri, P., Strinati, G.C. & Castellani C., Phys. Rev. B66, 024510 (2002).
- (9) Ranninger, J. & Robin, J.M., Phys. Rev. B53, R11961 (1996).
- (10) Fong-Chi Hsu et al., PNAS 105, 14262 (2008).
- (11) Kuo-Wei Yeh et al., EPL 84, 37002 (2008).
- (12) David Johnston, Advances in Physics 59, 803 (2010).
- (13) Y. Liu and C.T. Lin, J. Supercond. Nov. Magn. DOI 10.1007/s10948-010-0916-4
- (14) A. Tamai et al., Phys. Rev. Lett. 104, 097002 (2010).
- (15) K. Nakayama et al., Phys. Rev. Lett. 105, 197001 (2010).
- (16) Fei Chen et al., Phys. Rev. B 81, 014526 (2010).
- (17) I. Pallecchi et al., Phys. Rev. B80, 314511 (2009)
- (18) Y. Liu, R.K. Kremer and C.T. Lin, Supercond. Sci. Technol. 24 (2011).
- (19) Perali, A. et al., Phys. Rev. Lett. 106, 060402 (2011).
- (20) J. Carlson and S. Reddy, Phys. Rev. Lett. 100, 150403 (2008).
- (21) J.R. Schriefer, Theory of Superconductivity, ABC Westview press (1999).
- (22) J.C. Campuzano et al.Phys Rev B 53, R14737 (1996).
- (23) Z.-H. Liu et al., arXiv:1008.3265 (2010).
- (24) Randeria, M., Duan, J. & Shieh, L., Phys. Rev. Lett. 62, 981 (1989).
- (25) M. R. Norman et al., Phys. Rev. Lett. 79, 3506 (1997).
- (26) Y. Qiu et al., Phys. Rev. Lett. 103, 067008 (2009).