Quasi periodic oscillations of solar active regions in connection with their flare activity – NoRH observations
Abstract
The sunspot-associated sources at the frequency of 17 GHz give information on plasma parameters in the regions of magnetic field about G at the level of the chromosphere-corona transition region. The observations of short period (from 1 to 10 minutes) oscillations in sunspots reflect propagation of magnetohydrodynamic (MHD) waves in the magnetic flux tubes of the sunspots. We investigate the oscillation parameters in active regions in connection with their flare activity. We confirm the existence of a link between the oscillation spectrum and flare activity. We find differences in the oscillations between pre-flare and post-flare phases. In particular, we demonstrate a case of powerful three-minute oscillations that start just before the burst. This event is similar to the cases of the precursors investigated by Sych, R. et al. (Astron. Astrophys. 505, 791, 2009). We also found well-defined eight-minute oscillations of microwave emission from sunspot. We interpret our observations in terms of a relationship between MHD waves propagating from sunspot and flare processes.
keywords:
Oscillations, Solar; Radio Emission, Active Regions; Corona, Radio Emission; Radio Bursts, Association with Flares1 Introduction
S-Introduction
Quasi-periodic oscillations (QPO) are registered practically in all wavelength ranges and in all structures of the solar atmosphere (Lites et al., 1998; Bogdan, 2000; Fludra, 2001; Bogdan and Judge, 2006; Kosovichev, 2009). The periods of oscillations typically range from seconds to hours and perhaps days. The dominant periods of the oscillations are three and five minutes. Most of these oscillations are of intermittent nature: both their amplitude and frequency vary with time. The oscillations are often visible as trains of a few periods. The oscillations with different periods have different physical nature. The short-period oscillations are caused by running waves. Their intermittency is probably caused by instability of physical conditions in the regions of generation and propagation.
Studying oscillations can help us to understand such fundamental astrophysical problems as accumulation and release of energy, physics of the coronal heating and the origin of flares. The investigation of oscillation processes in the solar corona is a powerful tool for coronal plasma diagnostics (Nakariakov and Erdelyi, 2009).
Observations of QPOs of the solar radio emission have been carried out for more than 40 years [Durasova, Kobrin, and Yudin (1971)]. The first observations showed that oscillations are mostly produced in solar active regions and their parameters reflect the development of flare activity [Kobrin et al. (1973), Aleshin, Kobrin, and Korshunov (1973)]. However, in these studies the spatial and time resolution of radio telescopes was not adequate.
Significant progress in this field was achieved with the help of large modern radio telescopes. Especially rich information was gained from the Nobeyama Radioheliograph (NoRH) [Nakajima et al. (1994)]. The NoRH has been observing the Sun since 1992. The observations are carried out every day (7 – 8 hours daily) with spatial resolution of 10 – 20 arcsec and cadence of 1 sec.
The most sensitive analysis of the radio oscillations reflecting the plasma resonance phenomena for MHD oscillations was found for the sunspot associated sources (Gelfreikh et al., 1999; Shibasaki, 2001; Nindos et al., 2002; Gelfreikh et al., 2006). Such oscillations reflect the oscillations of the plasma parameters (temperature and magnetic field) at the level of the chromosphere-corona transition region (CCTR), where the strength of the magnetic field is about G. The analysis has shown the presence of regular oscillations of the radio brightness (registered both in and Stokes parameters). The periods of oscillations vary from fractions of a minute to several hours. In reality they have a different nature. The nature of oscillations is still in the stage of discussion. However, some mechanisms have been identified. The three- and five-minute oscillations in sunspots are well known from optical observations [Uchida and Sakurai (1975), Horn, Staude, and Landgraf (1997)] and also analyzed in space-borne data of EUV lines (Brynildsen et al., 1999a; Brynildsen et al., 1999b; De Moortel et al., 2002; Brynildsen et al., 2003; King et al., 2003). It was shown that they usually reflect propagation of MHD waves from the chromosphere towards corona. In some cases the waves propagate along coronal loops rooted in sunspots [De Moortel et al. (2002)].
Recently \inlineciteSych09 established the relationship between three-minute oscillations of the microwave emission and quasi-periodic pulsations (QPP) in flares. They found two cases of increase in the power of the three-minute oscillations just before the flares. The oscillations are interpreted as slow magnetoacoustic waves which can cause the QPP.
In many sunspot-associated sources longer periods of QPO (dozens of minutes) are also found. These periods are typical for the coronal loops oscillations [Gelfreikh et al. (2006), Bakunina et al. (2009), Chorley et al. (2010)]. Some of these may begin in a sunspot region reflecting possibly acoustic oscillations in coronal loops (see also \openciteNakariakov04). Much longer periods, up to several hours, are also observed for most of the discussed radio sources. Similar long periods were found from the optical observations of sunspots (Efremov, Parfinenko, and Solov’ev, 2010). Global oscillations of the Sun may also be reflected in some cases of sunspot radio emission.
In summary, study of QPO observations of sunspot-associated sources may lead to significant progress in understanding of physical processes in solar plasma. Such observations also contain information on MHD wave propagation in the solar atmosphere. Although so far we have not reached satisfactory interpretation of the physical nature of all observed types of the discussed QPO, there is no doubt that the detailed analysis of their parameters brings new insight concerning the plasma structures in the studied active regions.
The main aim of this work is to study the difference in oscillations observed in pre-flare and post-flare phases and to investigate the reconstruction of the magnetic structure of ARs.
2 Observations
S-Observations
2.1 Methods
S-Methods
In this study we used the NoRH daily (7 – 8 hours every day) observations at 1.76 cm (17 GHz). The radio maps of the whole solar disk were synthesized with cadence of ten seconds and ten seconds averaging. The spatial resolution of the radio maps is about 10 – 15 arcsec.
NoRH provides intensity and circular polarization (I and V, respectively) solar images. At 17 GHz the total intensity and polarization data usually yield similar results for the sunspot associated-sources and this is also the case for our study. This behavior is due to the cyclotron nature of emission. The polarized emission at 1.76 cm is generated at the third harmonic of electron gyrofrequency in a layer where the magnetic field is about G [Akhmedov et al. (1982), Shibasaki et al. (1994), Nindos et al. (2000)]. The pioneer study of oscillations using NoRH data [Gelfreikh et al. (1999)] was based on polarization data only. \inlineciteShibasaki01 used time series of the peak brightness temperature of the intensity. Additionally, he used correlation plots for the right and the left circular polarization, but he did not use solar images in polarization. Some authors [Gelfreikh et al. (2006), Chorley et al. (2010), Dzhimbeeva (2011)] used total intensity data only. In this study we only present the intensity data.
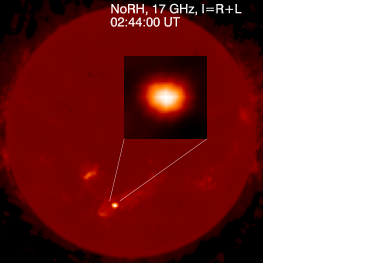
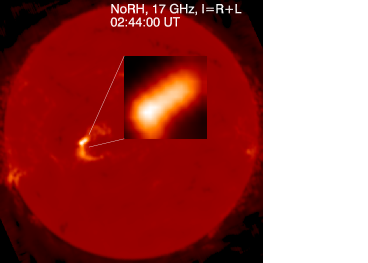
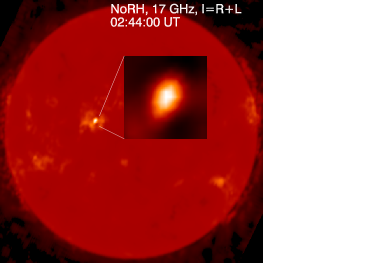
Figures \irefF-2001-09-11b,\irefF-2002-03-14b,\irefF-2002-10-07b show full disk images and magnified images of the investigated sources as well. All radio sources are compact. The structure of the source in the Figure \irefF-2002-03-14b is more complicated. But there is a compact feature in the left bottom part of the magnified image. This feature is brighter. The size of the feature is comparable to the synthesized beam size. So, we can consider all sources as unresolved and use the peak brightness temperature to generate time series.
The basic steps of data processing are:
-
•
interactive extraction of the selected region-of-interest (ROI) from the initial image,
-
•
computation of the new position of the ROI corrected for solar rotation for each image according to the time of the observation,
-
•
extraction of the ROI from all the images,
-
•
computation of the time series of the maximum brightness temperature over each ROI,
-
•
spectral wavelet analysis of the time profiles.
For the analysis of the time profiles we used wavelet spectra with Morlet functions of the sixth order as a base function [Torrence and Compo (1998)].
2.2 The Active Region 9608 on 11 September 2001
S-AR9608
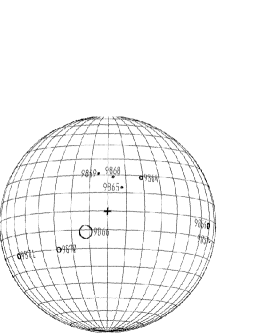
Figure \irefF-2001-09-11a shows the position of the AR 9608. It was situated at the central meridian but shifted by half a solar radius toward the south pole. The NoRH radio map is presented in Figure \irefF-2001-09-11b. It is clearly visible that the analyzed AR has the largest sunspot and the brightest radio source on the solar disk. The parameters of the source are in good agreement with a gyro-resonance radio source at the level of the low solar corona with the field G. Two large bursts have been registered during the four-hour interval of analysis (Figure \irefF-2001-09-11c). So, for analysis of the variations of the spectra in quiet state we should analyze three intervals. These are rather short, and analysis of long periods (tens of minutes e.g.) is not possible.
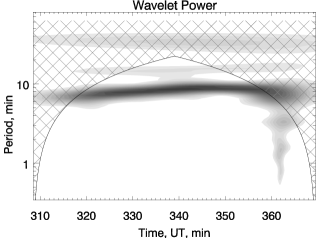
Figure \irefF-AR9608 depicts the time intervals of the trend-subtracted time series (a, c, and e) and corresponding wavelet spectra (b, d, and f). To summarize information on oscillations we have made time-period charts based on the wavelet spectra. Figure \irefF-2001-09-11d shows the time-period chart for AR 9608. We register short wave-train of weak three-minute oscillations during the first time interval (Figures \irefF-2001-09-11d and \irefF-AR9608b). Probably five-minute oscillations are present. We can clearly see the oscillations with period of nearly eight minutes during the whole interval. During the time interval between the bursts (Figures \irefF-2001-09-11d and \irefF-AR9608d) the three- and five-minute oscillations are present. The eight-minute oscillations are seen also, but their power is weaker. After the second burst (Figures \irefF-2001-09-11d and \irefF-AR9608f) there are unstable wave-trains of the three- and five-minute oscillations and the eight-minute oscillations are practically absent.
It is known that the three-minute oscillations are a typical feature of the sunspot atmosphere (not at all heights, however). So, the appearance or disappearance of oscillations in radio wavelengths reflect the reconstruction of the structure of magnetic flux tube of the large sunspot at the level of CCTR (or lower corona).
a b


(c) (d)

a b

c d


e f
2.3 The Active Region 9866 on 14 March 2002
S-AR9866
This active region includes a large bipolar sunspot (see Figure \irefF-2002-03-14(a,b)), crossing the central meridian a day before. One large burst was registered at 1:40 UT during 5.3–hour period of the observations (Figure \irefF-2002-03-14c). The flare happened in the west part of the region, which had a bipolar magnetic structure. Generating the time series, we verified the positions of the peak (X,Y-coordinates of the maximum brightness temperature) to make sure that the peak belongs to the same area. Actually, the peak position varied during the flare because the flare had a complicated structure. However, we did not analyze any details of the time series during the flare. We used time series before and after flare, when the source was stable.
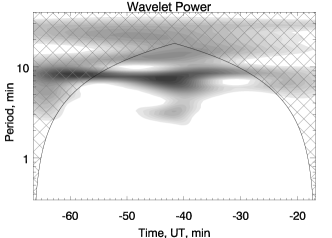
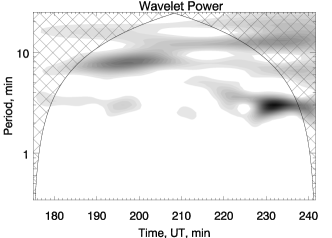
The time-period chart is shown in Figure \irefF-2002-03-14d. One can notice the appearance of powerful eight-minute oscillations after the burst.
It is interesting to note the presence of powerful well-pronounced eight-minute oscillations (Figure \irefF-AR9866). The eight-minute oscillations are less studied than the three- and five-minute oscillations, although they were observed earlier in the radio and optical ranges [Abramov-Maximov et al. (2011)]. Some authors have found periodicity of about eight minutes in the 171 Å and 195 Å bandpasses in the coronal loops (King et al., 2003; Van Doorsselaere, Birtill, and Evans, 2009).
a b


(c) (d)

a b
2.4 The Active Region 10139 on 7 October 2002
S-AR10139
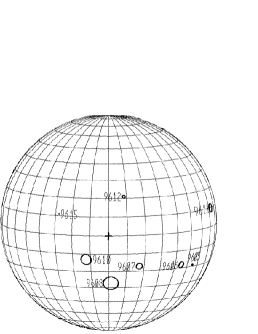
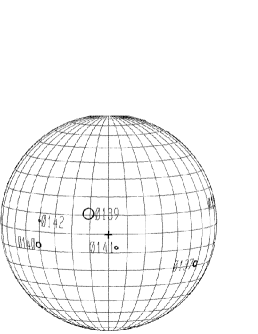
The observations were carried out one day before the central-meridian passage (CMP). Figure \irefF-2002-10-07a shows the position of the AR on the solar disk for the date of the analysis. The overall trend of the emission is caused by daily variations of the synthesized beam.
There were some small bursts during the day. Figure \irefF-2002-10-07c shows the time series of the peak brightness temperature at 17 GHz. For our analysis we used five time intervals from the time series between the bursts. The positions of the intervals are shown in Figure \irefF-2002-10-07c by vertical dashed lines. The time-period chart is depicted in Figure \irefF-2002-10-07d.
We find that the spectra of the oscillations for different time intervals differ significantly. The first time interval is noisy. Practically, there are no oscillations visible. There might be oscillations with periods about ten minutes or more but we do not see the three- and five-minute oscillations.
After the bursts, the oscillations appear. During the second time interval we can see a wave-train of five-minute oscillations with duration about 25 minutes. Ten-minute oscillations are also present during the whole time interval.
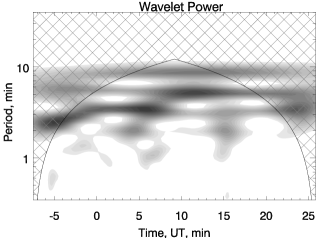
The third time interval shows the presence of a short wave-train of eight-minute oscillations and beginning of three-minute oscillations at the end of interval. It is noteworthy that the well-defined three-minute oscillations begin 15 – 20 minutes before the burst (Figure \irefF-AR10139). Perhaps it is a precursor, similar to the cases investigated by \inlineciteSych09.
In the fourth time interval we can see three-minute oscillations and a long wave-train of powerful ten-minute oscillations. In the fifth interval there is a weak short wave-train of three-minute oscillations and a long wave-train of oscillations with periods of nearly 8 – 10 minutes.
a b


(c) (d)

a b
3 Discussion and Conclusions
S-Discussion
We have presented three cases that confirm the existence of a link between oscillation spectrum and flare activity.
The analysis of the wavelet spectra of sunspot oscillations at the wavelength of 1.76 cm have confirmed the presence of the variations in the spectra connected with the flare activity. Both disappearance and appearance of some periods were found.
The first case (NOAA 9608, 11 September 2001) shows a decrease of power of the eight-minute oscillations after the first burst and their disappearance after the second, more powerful burst. This case also shows an increase of power of the three- and five-minute oscillations between the bursts. The second case (AR 9866, 14 March 2002) shows the appearance of the eight-minute oscillations after the burst. The most impressive feature in the third case (NOAA 10139, 7 October 2002) is the beginning of well-defined three-minute oscillations 15 – 20 minutes before the burst.
Two of the three cases demonstrate an increase of power of the short-term oscillations before and during the bursts. This result is in a good agreement with the results obtained by \inlineciteSych09. They found similar cases of a gradual increase in the power of the three-minute oscillations before flares in sunspot associated sources. They proposed that slow magnetoacoustic waves propagate from a sunspot along coronal loops upwards the flare site and cause the energy release. This interpretation is likely to be valid for our cases, too.
In our previous study [Abramov-Maximov et al. (2011)] we showed observational evidence that waves travelled from the chromosphere towards the corona inside the umbral magnetic flux tube of the sunspot. We found similar wave-trains in the oscillation processes at two different levels of the solar atmosphere and measured time shift between wave-trains. In this study we confirmed the relationship between travelling waves and flare activity. One of the possible interpretation of the presented observational material is that the MHD waves propagating from the sunspot can trigger energy release at the flare site.
The increase of power of the three-minute oscillations before the burst can be used for flare forecasting. Of course, there are some difficulties. First, the detection of the precursor requires a complicated data processing. Second, this effect appears only a few minutes before the flare. So, further studies are needed. Studies of this effect may shed light on the problem of energy release in solar flares. NoRH is a very suitable instrument for such investigations due to its long series of observations (since 1992), high time (1 sec) and spatial (10 arcsec) resolution for the full solar disk, and its long daily observing time (up to 8 hours per day).
Our conclusions are as follows:
1. We have confirmed the existence of a link between the oscillation spectrum and flare activity.
2. We found one case of increase of the power of the short-term oscillations before the burst.
3. We interpret our observations in terms of magnetohydrodynamic waves propagating from sunspots and flare processes.
4. The NoRH is a very suitable instrument for such studies.
Acknowledgements
This work was partially supported by the Presidium of Russian Academy of Sciences under grant OFN-15.
We are grateful to the anonymous referee and Editors for important remarks, which helped us to improve the paper.
Data used here from Mees Solar Observatory, University of Hawaii, are produced with the support of NASA grant NNG06GE13G.
Wavelet software was provided by C. Torrence and G. Compo, and is available at URL: http://paos.colorado.edu/research/wavelets/
References
- Abramov-Maximov et al. (2011) Abramov-Maximov, V.E., Gelfreikh, G.B., Kobanov, N.I., Shibasaki, K., Chupin, S.A.: 2011, Sol. Phys. 270, 175.
- Akhmedov et al. (1982) Akhmedov, Sh.B., Gelfreikh, G.B., Bogod, V.M., Korzhavin, A.N.: 1982, Sol. Phys. 79, 41.
- Aleshin, Kobrin, and Korshunov (1973) Aleshin, V.I., Kobrin, M.M., Korshunov, A.I.: 1973, Radiophysics and Quantum Electronics 16, 571.
- Bakunina et al. (2009) Bakunina, I.A., Abramov-Maximov, V.E., Lesovoy, S.V., Shibasaki, K., Solov’ev, A.A., Tikhomirov, Y.V.: 2009, In: N.Gopalswamy, D.Webb and K.Shibata (eds.), ”Universal Heliophysical Processes”, IAU Symposium 257, 155.
- Bogdan (2000) Bogdan, T.J.: 2000, Sol. Phys. 192, 373.
- Bogdan and Judge (2006) Bogdan, T.J., Judge, P.G.: 2006, Phil. Trans. R. Soc. A. 364, 313.
- Brynildsen et al. (1999a) Brynildsen, N., Kjeldseth-Moe, O., Maltby, P., Wilhelm, K.: 1999a, ApJ 517, L159.
- Brynildsen et al. (1999b) Brynildsen, N., Leifsen, T., Kjeldseth-Moe, O., Maltby, P., Wilhelm, K.: 1999b, ApJ 511, L121.
- Brynildsen et al. (2003) Brynildsen, N., Maltby, P., Kjeldseth-Moe, O., Wilhelm, K.: 2003, A&A 398, L15.
- Chorley et al. (2010) Chorley, N., Hnat, B., Nakariakov, V.M., Inglis, A.R., Bakunina, I.A.: 2010, A&A 513, 27.
- De Moortel et al. (2002) De Moortel, I., Ireland, J., Hood, A.W., Walsh, R.W.: 2002, A&A 387, L13.
- Durasova, Kobrin, and Yudin (1971) Durasova, M.S., Kobrin, M.M., Yudin, O.I.: 1971, Nature 229, 82.
- Dzhimbeeva (2011) Dzhimbeeva, L.N.: 2011, Solar System Research 45, No.1, 84.
- Efremov, Parfinenko, and Solov’ev (2010) Efremov, V.I., Parfinenko, L.D., Solov’ev, A.A.: 2010, Sol. Phys. 267, 279.
- Fludra (2001) Fludra, A.: 2001, A&A 368, 639.
- Gelfreikh et al. (1999) Gelfreikh, G.B., Grechnev, V.V., Kosugi, T., Shibasaki, K.: 1999, Sol. Phys. 185, 177.
- Gelfreikh et al. (2006) Gelfreikh, G.B., Nagovitsyn, Yu.A., Nagovitsyna, E.Yu.: 2006, PASJ 58, 29.
- Horn, Staude, and Landgraf (1997) Horn, T., Staude, J., Landgraf, V.: 1997, Sol. Phys. 172, 69.
- King et al. (2003) King D.B., Nakariakov V.M., Deluca E.E., Golub L., McClements K.G.: 2003, A&A404, L1.
- Kobrin et al. (1973) Kobrin, M.M., Korshunov, A.I., Snegirev, S.D., Timofeyev, B.V.: 1973, Solnechnye Dannye, No.10, 79 (in Russian).
- Kosovichev (2009) Kosovichev, A.G: 2009, AIP Conference Proceedings 1170, 547.
- Lites et al. (1998) Lites, B.W., Thomas, J.H., Bogdan, T.J., Cally, P.S.: 1998, ApJ 497, 464.
- Nakariakov et al. (2004) Nakariakov V.M., Tsiklauri D., Kelly A., Arber T.D., Aschwanden M.J.: 2004, A&A, 414, L25.
- Nakariakov and Erdelyi (2009) Nakariakov, V.M., Erdelyi, R.: 2009, Space Sci. Rev.149, 1.
- Nakajima et al. (1994) Nakajima, H., Nishio, M., Enome, S., Shibasaki, K., Takano, T., Hanaoka, Y., Torii, C., Sekiguchi, H., Bushimata, T., Kawashima, S., Shinohara, N., Irimajiri, Y., Koshiishi, H., Kosugi, T., Shiomi, Y., Sawa, M., Kai, K.: 1994, Proc. IEEE 82, 705.
- Nindos et al. (2000) Nindos, A., Kundu, M.R., White, S.M., Shibasaki, K., Gopalswamy, N.: 2000, Astrophys. J. (Suppl.) 130, 485.
- Nindos et al. (2002) Nindos, A., Alissandrakis, C.E., Gelfreikh, G.B., Bogod, V.M., Gontikakis, C.: 2002, A&A 386, 658.
- Shibasaki et al. (1994) Shibasaki, K., Enome, S., Nakajima, H., Nishio, M., Takano, T., Hanaoka, Y., Torii, C., Sekiguchi, H., Kawashima, S., Bushimata, T., Shinohara, N., Koshiishi, H., Shiomi, Y., Irimajiri, Y., Leka, K.D., Canfield, R.C.: 1994, PASJ 46, L17.
- Shibasaki (2001) Shibasaki, K.: 2001, ApJ 550, 1113.
- Sych et al. (2009) Sych, R., Nakariakov, V.M., Karlicky, M., Anfinogentov, S.: 2009, A&A 505, 791.
- Torrence and Compo (1998) Torrence, C., Compo G.P.: 1998, Bull. Am. Meteo. Soc. 79, 61.
- Uchida and Sakurai (1975) Uchida, Y., Sakurai, T.: 1975, PASJ 27, 259.
- Van Doorsselaere, Birtill, and Evans (2009) Van Doorsselaere, T., Birtill, D.C.C., Evans, G.R.: 2009, A&A 508, 1485.