Measurements of isolated prompt photons in collisions at 7 TeV in ATLAS
Abstract
Two recent measurements of the cross section for the inclusive production of isolated prompt photons in collisions at a center-of-mass energy TeV are presented. The results are based on data collected in 2010 with the ATLAS detector at the Large Hadron Collider. The measurements cover the pseudorapidity ranges and and the transverse energy range GeV. The measured cross sections are compared to predictions from next-to-leading-order perturbative QCD calculations.
Keywords:
prompt photons, isolated, proton collisions, LHC, NLO pQCD:
14.70.Bh,13.85.Qk1 Introduction
Prompt photon production at hadron colliders proceeds mainly through parton hard scattering, thus providing a handle for testing perturbative QCD (pQCD) predictions. The dominant production mechanism at Large Hadron Collider (LHC) energies is , thus its cross section measurement can constrain the gluon density in protons.
Here we present two measurements of the inclusive isolated prompt photon production cross section, as a function of the photon transverse energy, using collision data collected in 2010 with the ATLAS detector at the LHC at a center-of-mass energy of 7 TeV. The former Aad et al. (2011) is based on an integrated luminosity pb-1, and provides a measurement of the cross section for GeV in the photon pseudorapidity intervals , and . The latter ATLAS Collaboration (2011) uses the full 2010 data sample ( pb-1), covers the transverse energy range GeV and explores an additional pseudorapidity interval, .
2 The ATLAS detector
The ATLAS detector Aad et al. (2008, 2009) consists of an inner tracking system surrounded by a thin superconducting solenoid providing a 2 T magnetic field, electromagnetic and hadronic calorimeters, and a muon spectrometer based on large superconducting toroids. For the measurements presented here, the calorimeter and the inner detector are of particular relevance. The former provides a precise measurement of the photon energy and direction, and discrimination between single photons and fake photon candidates. The latter is used to distinguish electrons from photons and to reconstruct conversion vertices. These two systems and the photon trigger algorithms are briefly described in Ref. Aad et al. (2011).
3 Event selection
Events are triggered using a single-photon high-level trigger with a nominal transverse energy threshold of 10 GeV Aad et al. (2011) or 40 GeV ATLAS Collaboration (2011). Using unbiased or lower-threshold triggers, these triggers are found to be fully efficient for prompt photons passing the selection criteria described later. Events in which the calorimeters or the inner detector are not fully operational, or show data quality problems, are discarded. To reduce non-collision backgrounds, events are required to have at least one reconstructed primary vertex, with at least three associated tracks, consistent with the average beam spot.
Photons are reconstructed from electromagnetic clusters and tracking information provided by the inner detector as described in Aad et al. (2011). Photon candidates near regions of the calorimeter affected by read-out or high-voltage failures are not considered. Events with one photon candidate in the nominal acceptance are selected:
Background from non-prompt photons originating from decays of energetic and mesons inside jets are suppressed by means of shower-shape and isolation variables. Photon candidates are required to pass tight identification criteria based on nine discriminating variables computed from the the lateral and longitudinal profiles of the energy deposited in the calorimeters, in particular in the first (finely segmented) and second layers of the electromagnetic calorimeter and in the hadronic calorimeter behind it. The photon transverse isolation energy is computed from the sum of the energies in the electromagnetic calorimeter cells in a cone of radius 0.4 in the plane around the photon axis. The contribution to from the photon itself and from the soft-jet activity from the underlying event are subtracted (for the latter the technique proposed in Cacciari et al. (2010) is adopted). We require GeV. The final sample size is 110 thousand events in Aad et al. (2011) and 174 thousand events in ATLAS Collaboration (2011). About 30% of the photon candidates are reconstructed from conversions.
4 Background subtraction
A non-negligible residual contribution of background candidates is expected in the selected photon sample. The main source is due to misidentified QCD jets, typically containing a neutral meson (, ) that carries most of the jet energy and decays to a collimated photon pair. The background contamination is estimated and then subtracted by means of a data-driven counting technique based on the observed number of events in the control regions (sidebands) of a two-dimensional plane formed by the photon transverse isolation energy and a photon identification variable, exploiting two properties: the negligible correlation between these two variables for background events and the dominance of background over signal in the three background control regions. The number of signal events in the selected sample is given by , where is the total number of events in the selected sample, (for ) are the number of events in the three control regions and are signal leakage fractions, extracted from simulated signal events (their size does not exceed a few %). The procedure is applied separately for each of the pseudorapidity intervals under study and in several bins of photon transverse energy. The (small) background contribution from isolated electrons from and is estimated from simulated events using the fake rate measured in data. The estimated signal purity increases from around 50% at GeV to 90% and above for GeV. It is cross-checked with a template fit to the isolation distribution of the selected photons.
5 Cross section measurement
The -differential cross section for each of the pseudorapidity intervals under study is determined from the estimated signal yield as a function of the photon transverse energy and the photon trigger (), reconstruction () and identification () efficiencies, While the trigger efficiency (consistent with 100%) is measured in data, the other two are estimated from simulated signal samples, after adjusting the shower shape distributions in order to match those in data. A less precise data-driven measurement of using electrons from decays is in agreement with the nominal result. is around 80%111A significant inefficiency was due to dead readout regions and was recovered in winter 2011 shutdown, while increases from around 65% to as a function of . Correction factors (close to 1) take into account migrations between neighbouring bins in due to energy resolution. They are obtained with various unfolding techniques D’Agostini (1995); Hoecker and Kartvelishvili (1996), using the response matrix from simulated true photons.
Several sources of systematic uncertainties are evaluated and their contributions are combined, taking into account their correlations. The uncertainty on the reconstruction efficiency is dominated by the isolation efficiency cut (3-4%), the signal event generator (2%) and the limited knowledge of the detector material (1-2%). The uncertainty on the identification efficiency is dominated by the detector material knowledge (up to 6%) and the data/simulation shower shape agreement (up to 5%). The uncertainty on the background subtraction is dominated by the inputs from the simulation (up to 10%) and the choice of the background control regions (up to 6%). The uncertainty on the photon energy scale (1.5-3%) translates into a global 5-10% uncertainty on the cross section.
6 Results and conclusion
The measured cross sections are shown in Fig. 1 and 2. The red triangles represent the experimental results from Aad et al. (2011), the black dots those from ATLAS Collaboration (2011). The theoretical pQCD cross section, computed with a fixed-order NLO parton-level generator Fontannaz et al. (2001), is overlaid (blue band). The CTEQ 6.6 PDFs are used. The scales are set to . The parton transverse energy in a cone of radius 0.4 around the photon is required to be below 4 GeV: varying the requirement by GeV changes the cross section by . PDF uncertainties lead to a systematic uncertainty decreasing from 4% to 2% with , and varying the scales between 0.5 and 2 leads to an uncertainty decreasing from 20% to 8%.
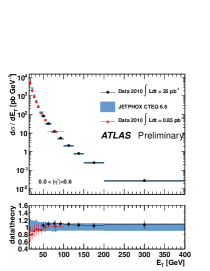
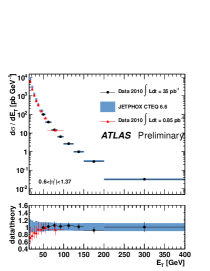
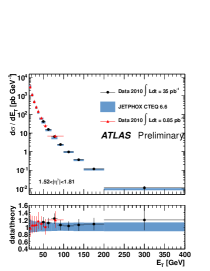
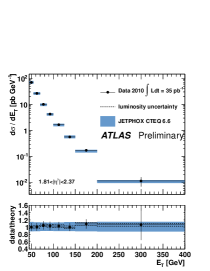
The measured cross sections are in agreement between the two measurements Aad et al. (2011); ATLAS Collaboration (2011) and with the theoretical predictions Fontannaz et al. (2001) for GeV. Below, where the contribution from parton-to-photon fragmentation is larger, the theory tends to overestimate the data, possibly hinting to the need of more accurate (NNLO) predictions.
References
- Aad et al. (2011) G. Aad, et al., Phys. Rev. D 83, 052005 (2011).
- ATLAS Collaboration (2011) ATLAS Collaboration, ATLAS-CONF-2011-058 (2011).
- Aad et al. (2008) G. Aad, et al., JINST 3, S08003 (2008).
- Aad et al. (2009) G. Aad, et al., arXiv:0901.0512 [hep-ex] (2009).
- Cacciari et al. (2010) M. Cacciari, G. P. Salam, and S. Sapeta, JHEP 04, 065 (2010).
- D’Agostini (1995) G. D’Agostini, Nucl. Instrum. Methods A 362, 487 (1995).
- Hoecker and Kartvelishvili (1996) A. Hoecker, and V. Kartvelishvili, Nucl. Instrum. Methods A 372, 469 (1996).
- Fontannaz et al. (2001) M. Fontannaz, J. P. Guillet, and G. Heinrich, Eur. Phys. J. C21, 303–312 (2001).