Feeding and feedback in the active nucleus of Mrk 1157 probed with Gemini NIFS
Abstract
We have mapped the stellar and gaseous kinematics, as well as the emission-line flux distributions and ratios, from the inner 450 pc radius of the Seyfert 2 galaxy Mrk 1157, using two-dimensional (2D) near-IR and band spectra obtained with the Gemini NIFS instrument at a spatial resolution of 35 pc and velocity resolution of 40 .
The stellar velocity field shows a rotation pattern, with a discrete S-shaped zero velocity curve – a signature of a nuclear bar. The presence of a bar is also supported by the residual map between the observed rotation field and a model of circular orbits in a Plummer potential. The stellar velocity dispersion () map presents a partial ring of low- values ( km s-1) at 250 pc from the nucleus surrounded by higher values from the galaxy bulge. We propose that this ring has origin in kinematically colder regions with recent star formation. The velocity dispersion of the bulge (100 ) implies in a black hole mass of M⊙.
Emission-line flux distributions are most extended along PA, reaching at least 450 pc from the nucleus and following the orientation observed in previous optical emission-line [O iii] imaging and radio jet. The molecular H2 gas has an excitation temperature K and its emission is dominated by thermal processes, mainly due to X-ray heating by the active nucleus, with a possible small contribution from shocks produced by the radio jet. The [Fe ii] excitation has a larger contribution from shocks produced by the radio jet, as evidenced by the line-ratio maps and velocity dispersion map, which show spatial correlation with the radio structures. The coronal lines are resolved, extending up to 150 pc and are also slightly more extended along PA.
The gaseous kinematics shows two components, one due to gas located in the galaxy plane, in similar rotation to that of the stars and another in outflow, which is oriented close to the plane of the sky, thus extending to high latitudes, as the galaxy plane is inclined by 45∘ relative to the plane of the sky. The gas rotating in the plane dominates the H2 and Pa emission, while the gas in outflow is observed predominantly in [Fe ii] emission. The [Fe ii] emission is originated in gas being pushed by the radio jet, which destroys dust grains releasing the Fe. From the outflow velocities and implied geometry, we estimate an outflow mass rate of for the ionised gas and a kinetic power for the outflow of erg s.
The distinct flux distributions and kinematics of the H2 and [Fe ii] emitting gas, with the former more restricted to the plane of the galaxy, and the later tracing the outflows related to radio jets is a common characteristic of the 6 Seyfert galaxies (ESO 428-G14, NGC 4051, NGC 7582, NGC 4151, Mrk 1066 and now Mrk 1157) we have studied so far using similar 2D observations, and other 2 (Circinus and NGC 2110) using long-slit observations. We conclude that the H2 emission surrounding the nucleus in the galaxy plane is a tracer of the gas feeding to the active nucleus while the [Fe ii] emission is a tracer of its feedback.
keywords:
galaxies: individual (Mrk 1157) – galaxies: individual (NGC 591) – galaxies: Seyfert – galaxies: ISM – infrared: galaxies – galaxies: kinematics and dynamics1 Introduction
Recent resolved imaging and spectroscopic studies of the central regions of nearby active galaxies have been allowing us to probe the feeding and feedback mechanisms of their central engines. The study of the of the ionized gas of the Narrow-Line Region (NLR) of active galaxies allows to investigate how the radiation and mass outflows from the nucleus interact with the circumnuclear gas, affecting its kinematics and excitation (e.g. Fischer et al., 2011, 2010; Crenshaw et al., 2010b, b, 2009; Crenshaw & Kraemer, 2007; Kraemer et al., 2009; Holt et al., 2006; Veilleux, Cecil & Bland-Hawthorn, 2005; Schmitt & Kinney, 1996; Veilleux, Goodrich & Wilson, 1997; Wilson et. al., 1993). On the other hand, the study of molecular and low ionization gas can tell us about the feeding of the Active Galactic Nucleus (AGN) of these galaxies by the mapping of inflows and estimating mass inflow rates towards the centre (e.g. van de Ven & Fathi, 2010; Sánchez et al., 2009; Storchi-Bergmann et al., 2007; Fathi et al., 2006; Mundell & Shone, 1999). However, most of the above studies are based on optical observations, which are affected by dust obscuration (Ferruit, Wilson & Mulchaey, 2000; Mulchaey, Wilson & Tsvetanov, 1996a, b), a problem that can be alleviated by using infrared lines to map the NLR emission.
Since 2006, we have been observing the inner few hundred parsecs of nearby active galaxies with Integral Field Spectrographs at the Gemini Observatory, with the goal of mapping both inflows and outflows around nearby active galactic nuclei and try to constrain the mass flow rates. In the near-infrared (hereafter near-IR) our main findings have been that the molecular (H2) and ionised gases present distinct flux distributions and kinematics. The H2 emission gas is usually restricted to the plane of the galaxy, while the ionised gas extends also to high latitudes and is associated with the radio emission (Riffel et al., 2006, 2008, 2009; Riffel, Storchi-Bergmann & Nagar, 2010; Riffel & Storchi-Bergmann, 2011; Storchi-Bergmann et al., 2009, 2010). The H2 kinematics is usually dominated by rotation in the plane, including in some cases streaming motions towards the nucleus, while the kinematics of the ionised gas, and in particular of the [Fe ii] emitting gas, shows, in addition, a strong outflowing component associated with radio jets from the Active Galactic Nucleus (AGN). A previous study using long-slit near-IR data (Storchi-Bergmann et al., 1999) of the Seyfert galaxies Circinus and NGC 2110, showing higher velocity dispersion and more disturbed kinematics for the [Fe ii] emission as compared with the H2 emission also supports this scenario. These results so far suggest that the molecular gas can be considered a tracer of the feeding of the AGN and the ionised gas a tracer of its feedback. Nevertheless, our 2D observations – which provide a complete coverage of the kinematics – comprise so far only half a dozen galaxies, and, in order to compensate for uncertain projection and filling factors, more objects need to be studied in detail, in order to allow also the quantification of the mass inflow and outflow rates.
In this work, we present the gaseous flux distribution and kinematics of the inner 450 pc of another active galaxy, the Seyfert 2 galaxy Mrk 1157 (NGC 591), for which we were able to measure also the stellar kinematics, allowing its comparison with the gas kinematics, which can be thus better constrained. This is only the second case in which we could measure the stellar kinematics, the first being Mrk 1066 (Riffel & Storchi-Bergmann, 2011). Mrk 1157 was selected for this study because: (i) it presents strong near-IR emission lines (e.g Nagar et al., 1999; Riffel, Rodríguez-Ardila, & Pastoriza, 2006), allowing the mapping of the gaseous distribution and kinematics; (ii) it has extended radio emission, allowing the investigation of the role of the radio jet; (iii) the K-band CO absorption band heads have been observed in previous near-IR spectra (Riffel, Rodríguez-Ardila, & Pastoriza, 2006) allowing the measurement of the stellar kinematics.
Mrk 1157 is an early-type barred spiral galaxy (SB0/a), located at a distance Mpc, for which 1″ corresponds to 296 pc at the galaxy. Radio-continuum images at 3.6 cm and 6 cm show a radio double with extension of 12 oriented along the position angle PA=153∘ (Nagar et al., 1999; Ulvestad & Wilson, 1989). Optical images show that the [O iii] emission extends up to 4″ following the orientation of the radio jet, while the H emission extends up to 20 ″ along the east-west direction (Mulchaey, Wilson & Tsvetanov, 1996a). The near-IR nuclear spectrum of Mrk 1157 presents strong emission lines of [S iii], He i, H i, [Fe ii] and H2 and the presence of high ionisation species as [Si vi], [S viii] and [Si x] (e.g. Riffel, Rodríguez-Ardila, & Pastoriza, 2006; Veilleux, Goodrich & Wilson, 1997). Optical and near-IR spectra show no evidence of broad components in the profiles of permitted emission lines (e.g. Riffel, Rodríguez-Ardila, & Pastoriza, 2006; Veilleux, Goodrich & Wilson, 1997), but spectropolarimetric observations reveal the presence of this component in H and H (Moran et al., 2000). The near-IR nuclear spectrum of Mrk 1157 also shows absorption lines, with the CO absorptions in the H- and K-bands being the most prominent ones and including the detection of the CN absorption at 1.1m – a signature of the presence of intermediate age stars (Riffel, Rodríguez-Ardila, & Pastoriza, 2006; Riffel et al., 2007).
2 Observations and Data Reduction
Mrk 1157 was observed with Gemini NIFS (McGregor et al., 2003) operating with the Gemini North Adaptive Optics system ALTAIR in September/October 2009 under the programme GN-2009B-Q-27, following the standard Object-Sky-Sky-Object dither sequence, with off-source sky positions since the target is extended, and individual exposure times of 550 s.
Two sets of observations with six on-source individual exposures were obtained at different spectral ranges: the first in the J-band, centred at 1.25 m and covering the spectral region from 1.14 m to 1.36 m, and the second in the Kl-band, centred at 2.3 m covering the spectral range from 2.10m to 2.53m. In the J-band, the J_G5603 grating and ZJ_G0601 filter were used, resulting in a spectral resolution of , as obtained from the measurement of the full width at half maximum (FWHM) of arc lamp lines. The Kl-band observations were obtained using the Kl_G5607 grating and HK_G0603 filter and resulted in a spectral resolution of FWHM. In velocity space, the resolution of the observations is 45 for the Kl-band and 35 for the J-band.
The data reduction was accomplished using tasks contained in the nifs package which is part of Gemini iraf package, as well as generic iraf tasks. The reduction procedure included trimming of the images, flat-fielding, sky subtraction, wavelength and s-distortion calibrations. We have also removed the telluric bands and flux calibrated the frames by interpolating a black body function to the spectrum of the telluric standard star. The final IFU data cube in each band contains spectra, each spectrum corresponding to an angular coverage of 005005, which translates into 1515 pc2 at the galaxy and covering the inner 3″3″(900900 pc2) of the galaxy.
The angular resolution obtained from the FWHM of the spatial profile of the telluric standard star is 011002 for the J-band and 012002 for the Kl-band, corresponding to 32.65.9 and 35.55.9 pc at the galaxy, respectively.
3 Results
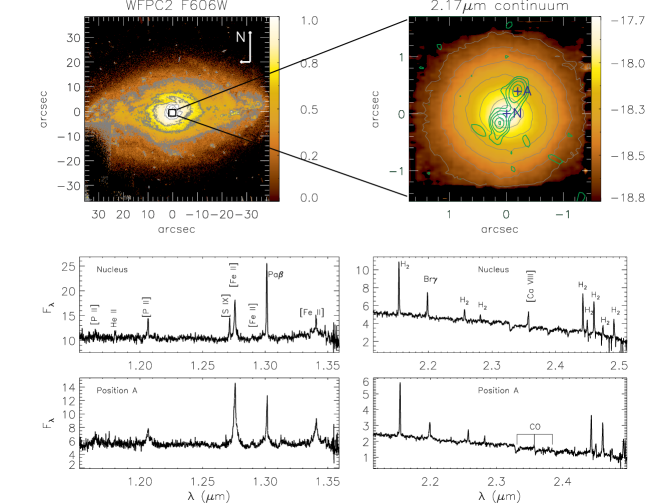
In the top-left panel of Figure 1 we present an optical image of Mrk 1157 obtained with the Hubble Space Telescope (HST) Wide Field Planetary Camera 2 (WFPC2) through the filter F606W – effective wavelength/width 5843 Å/1578.7 Å(Malkan, Gorjian & Tam, 1998). In the top-right panel we present an image obtained from the NIFS data cube for the continuum emission around 2.17m. In the bottom panels we present two characteristic IFU spectra integrated within a 025025 aperture: the nuclear one and a spectrum from 04 north-west of the nucleus (Position A), at the location of the north-west component of the radio double (Nagar et al., 1999; Ulvestad & Wilson, 1989).
3.1 Stellar Kinematics
In order to obtain the stellar line-of-sight velocity distributions (LOSVD) we fitted the 12CO and 13CO stellar absorption band heads around 2.3 m in the -band spectra using the penalised Pixel-Fitting (ppxf) method of Cappellari & Emsellem (2004), as explained in Riffel & Storchi-Bergmann (2011). As stellar template spectra we used those of the Gemini library of late spectral type stars observed with the Gemini Near-Infrared Spectrograph (GNIRS) IFU and NIFS (Winge, Riffel & Storchi-Bergamann, 2009). The resulting maps for the radial velocity (V∗), stellar velocity dispersion (), and higher order Gauss-Hermite moments ( and ) are shown in Figure 2. At locations close to the borders of the field of view, the S/N ratio of the galaxy’s spectra was not high enough to allow reliable measurements, which have thus been masked out.
In order to estimate the uncertainties on the measurements of , , and we performed 500 iterations Monte Carlo simulations of the kinematical extractions with pPXF,using the Gemini library spectra as templates, as described in Cappellari & Emsellem (2004). Our NIFS spectra have S/N ratio in the 2.3m continuum ranging from 15 at the borders of the NIFS field to 90 around the nucleus. We have performed two Monte Carlo simulations, one for to obtain the uncertainties near the borders of the field and another for to represent the uncertainties at regions near the nucleus. The output from the Monte Carlo simulations show that for a the maximum uncertainties are , , and , while for they are , , and .
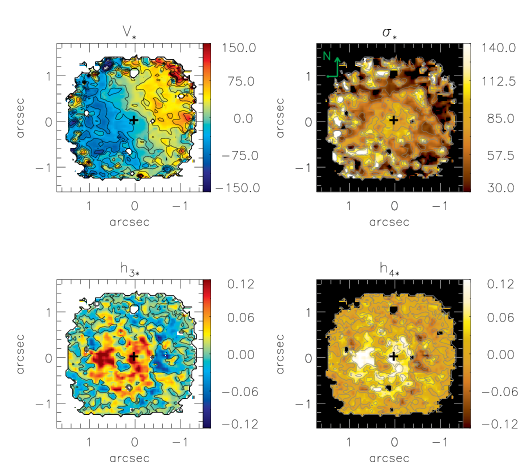
The top left panel of Fig. 2 shows the stellar velocity field, from which we subtracted the heliocentric systemic velocity of , obtained from the modelling of the stellar velocity field (see Sec. 4.1). The velocity field shows a rotation pattern with blueshifts to the south-east and redshifts to the north-west, with a maximum velocity of 130 and kinematical centre coincident with the position of the continuum peak flux, within the uncertainties.
In the top-right panel of Fig. 2 we present the stellar velocity dispersion () map, which presents values ranging from 30 to 150 . A partial ring of low values () is observed surrounding the nucleus at 06 ( 180 pc) from it. The bottom panels show the higher order Gauss-Hermite moments (left) and (right), which measure asymmetric and symmetric deviations, respectively, from a Gaussian velocity distribution. The values and are small, varying from 0.12 to 0.12, and are similar to those observed for other galaxies (Emsellem et al., 2004; Ganda et al., 2006; Riffel et al., 2008, 2009), indicating that there are only small deviations of the stellar LOSVD from a Gaussian velocity distribution. Nevertheless, some systematic deviations are observed in both maps. The seems to be anti-correlated with the stellar velocity field, presenting red wings (positive values) mostly in the blueshifted side of the galaxy, and blue wings (negative values) in the redshifted side. The map has the highest positive values (meaning the the LOSVD is more “pointy” than a Gaussian) where the red wings are observed and the highest negative values (meaning that the LOSVD is less “pointy” than a Gaussian) where the blue wings are observed.
3.2 Emission-Line Flux Distributions and Ratios
We measured the fluxes of 29 emission lines from [P ii], [Fe ii], He i, He ii, H i, H2, [S ix], [Si vii] and [Ca viii], which are listed in Table 1 for the nucleus and position A. The strongest emission lines are identified in the nuclear spectrum of Fig. 1. In the K-band nuclear spectrum we have also identified the CO stellar absorption band heads around 2.3 m.
| ID | Nucleus | Position A | |
|---|---|---|---|
| 1.14713 | [P ii] | 16.39 1.07 | 21.37 7.20 |
| 1.16296 | He ii | 19.84 4.01 | 7.71 0.78 |
| 1.18861 | [P ii] | 38.48 3.49 | 49.68 8.03 |
| 1.19665 | [Fe ii] | 6.00 0.82 | 2.48 0.33 |
| 1.19723 | He i | – | 1.79 0.50 |
| 1.22263 | [Fe ii] | 2.53 0.27 | – |
| 1.23878 | [Fe ii] | 4.64 0.67 | 5.19 0.91 |
| 1.24211 | [Fe ii] | – | 2.13 1.15 |
| 1.25235 | [S ix] | 34.83 1.57 | 4.57 1.17 |
| 1.25702 | [Fe ii] | 101.07 7.65 | 207.82 19.66 |
| 1.27069 | [Fe ii] | – | 18.07 3.23 |
| 1.27912 | [Fe ii] | 7.18 1.31 | – |
| 1.28216 | H i Pa | 123.27 3.05 | 101.69 31.30 |
| 1.28607 | [Fe ii] | – | 1.84 0.29 |
| 1.29462 | [Fe ii] | – | 5.85 0.69 |
| 1.32092 | [Fe ii] | 32.76 3.15 | 67.50 8.36 |
| 1.32814 | [Fe ii] | 13.99 5.80 | 8.77 7.4 |
| 2.12183 | H2 1-0 S(1) | 74.57 9.48 | 50.46 2.43 |
| 2.15420 | H2 1-0 S(2) | 3.48 3.60 | 2.70 0.96 |
| 2.16612 | H i Br | 46.14 6.33 | 19.63 1.53 |
| 2.22344 | H2 1-0 S(0) | 22.32 0.90 | 13.02 1.08 |
| 2.24776 | H2 2-1 S(1) | 8.41 3.43 | 6.27 1.36 |
| 2.32204 | [Ca viii] | 36.83 11.25 | 5.12 0.99 |
| 2.40847 | H2 1-0 Q(1) | 56.59 2.69 | 33.08 0.78 |
| 2.41367 | H2 1-0 Q(2) | 14.46 6.18 | 10.23 1.28 |
| 2.42180 | H2 1-0 Q(3) | 51.63 3.48 | 33.77 2.02 |
| 2.43697 | H2 1-0 Q(4) | 16.21 3.88 | 9.03 1.59 |
| 2.45485 | H2 1-0 Q(5) | 32.20 3.52 | 19.82 4.39 |
| 2.48334 | [Si vii] | 85.95 5.64 | 17.88 1.36 |
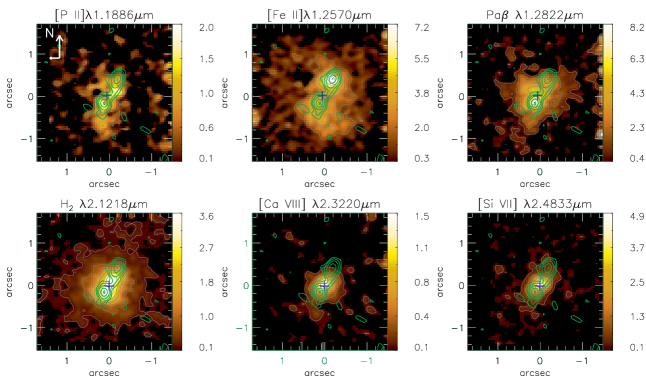
We used our routine profit (Riffel, 2010) to fit the profiles of [P ii] 1.1886 m, [Fe ii] 1.2570 m, Pa, H2.1218m, [Ca viii] 2.3220 m and [Si vii] 2.4833 m emission lines with Gauss-Hermite series. We have integrated the flux under the emission-line profiles after subtracting the underlying continuum (obtained from two spectral windows, one at each side of the profile) in order to map of the flux distributions. These particular lines have been chosen because they have the highest signal-to-noise (S/N) ratios among their species (coronal lines, forbidden and permitted ionised gas lines and molecular lines). As observed in the nuclear spectrum of Fig. 1, the [Ca viii] emission line is partially superimposed on the 12CO 2.322 m band head. In order to correct for the effect of the absorption, we measured the flux of [Ca viii] emission line after the subtraction of the contribution of the underlying stellar population, obtained from the fitting of the stellar kinematics (see Sec. 3.1).
In Figure 3 we present the resulting flux distributions, which have typical uncertainties smaller than 10%. The central cross marks the position of the nucleus, defined as the location of the peak of the continuum emission, and the green contours overlaid on the [Fe ii] and Pa flux maps are from the 3.6 cm radio-continuum image from Nagar et al. (1999). We used the 20 cm radio-continuum image from Nagar et al. (1999) to align the near-IR and radio images, under the assumption that both present their peak emission at the same position – the nucleus. The uncertainty in the alignment is estimated to be smaller than 02.
The flux distributions for the [P ii] and [Fe ii] emission lines are similar. They are well correlated with the 3.6 cm radio-continuum emission, being more extended along the position angle of the radio double PA=153. The peak flux is observed at 04 north-west of the nucleus, approximately coincident with the north-west component of the radio double. A secondary peak is observed at 02 south-east of the nucleus, at the same position of the other component of the radio double (hereafter we will call the radio components NW and SE hot spots).
The Pa emission is also extended along PA=153∘, but shows some emission also to the east of the nucleus, being less collimated than the [P ii] and [Fe ii] flux distributions; its emission peaks at 02 south-east of the nucleus, at the position of the SE hot spot.
The H2 emission is more uniformly distributed, extending up to 08 arcsec along all directions, but the highest intensity levels are also more elongated along the orientation of the radio double.
The coronal-line emission (traced by the [Ca viii] and [Si vii] emission lines) is resolved by our observations (the FWHM of the flux distribution for both emission lines is 04), peaks at the nucleus and extends up to 04 (120 pc) from it. The [Si vii] coronal-line emission in more extended along PA=153∘, as observed for the other emission lines.
3.2.1 Emission-line Ratios
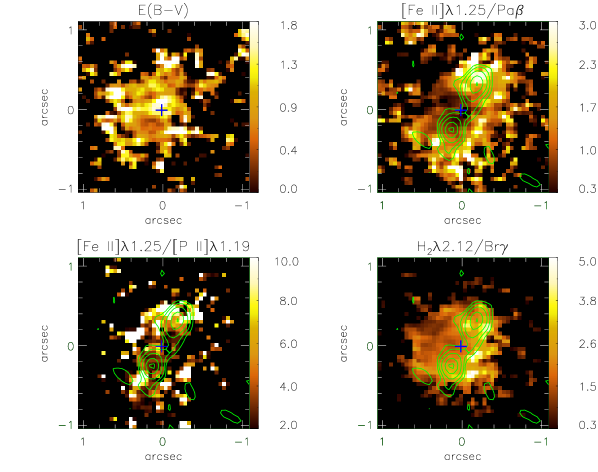
In order to map the Narrow-Line Region (NLR) extinction and excitation mechanisms of the [Fe ii] and H2 emission lines, we constructed the flux ratio maps shown in Figure 4.
The reddening map was obtained from the Pa/Br line ratio as
| (1) |
where and are the fluxes of and emission lines, respectively. We have used the reddening law of Cardelli, Clayton & Mathis (1989) and adopted the intrinsic ratio corresponding to case B recombination (Osterbrock & Ferland, 2006). The resulting map is shown in the top-left panel of Fig. 4, where the highest values – corresponding to the most heavily reddened regions – are those represented by the colours light yellow and white. The highest values, of up to 1.8, are observed at the nucleus and to north-east, while the lowest values, of about 0.4, are observed at the radio hot spots. Typical uncertainties are smaller than 0.2, and the average value is .
In the top-right panel of Fig. 4 we present the [Fe ii]1.2570m/Pa ratio map, which can be used to investigate the excitation mechanism of [Fe ii] (e.g. Rodríguez-Ardila et al., 2004; Rodríguez-Ardila, Riffel & Pastoriza, 2005; Storchi-Bergmann et al., 2009; Riffel et al., 2006; Riffel, Storchi-Bergmann & Nagar, 2010; Storchi-Bergmann et al., 2009). Seyfert galaxies present typical values for this ratio between 0.6 and 2.0, Starbursts have ratios 0.6 and Low-Ionisation Nuclear Emission-line Regions (LINERs) show values higher than 2.0 (e.g. Rodríguez-Ardila et al., 2004; Rodríguez-Ardila, Riffel & Pastoriza, 2005; Storchi-Bergmann et al., 2009; Riffel et al., 2006; Riffel, Storchi-Bergmann & Nagar, 2010; Storchi-Bergmann et al., 2009). The lowest values for Mrk 1157 () are observed near the nucleus (closer than 04 or 120 pc from the nucleus), while the highest values, of up to 3, are observed at 04 north-west of the nucleus, at the position of the NW radio hot spot.
Another line ratio that can be used to investigate the [Fe ii] excitation mechanism is [Fe ii]1.2570m/[P ii]1.8861m. Values larger than 2 indicate that shocks have passed through the gas destroying the dust grains, releasing the Fe and enhancing its abundance and thus emission (e.g. Oliva et al., 2001; Storchi-Bergmann et al., 2009; Riffel, Storchi-Bergmann & Nagar, 2010). We present this ratio map in the bottom-left panel of Fig. 4. The lowest values of are observed at the nucleus, while the highest values of up to 10 are seen at 04 north-west, at the location of the NW hot spot.
In the bottom-right panel of Fig. 4 we present the H2.1218m/Br ratio map, which is useful to investigate the excitation of the H2 molecule (e.g. Rodríguez-Ardila et al., 2004; Rodríguez-Ardila, Riffel & Pastoriza, 2005; Storchi-Bergmann et al., 2009; Riffel et al., 2006, 2008, 2009; Riffel, Storchi-Bergmann & Nagar, 2010). This ratio presents values ranging from 0.6 to 2 for Seyfert galaxies (e.g. Rodríguez-Ardila et al., 2004; Rodríguez-Ardila, Riffel & Pastoriza, 2005; Storchi-Bergmann et al., 2009; Riffel et al., 2006, 2008, 2009; Riffel, Storchi-Bergmann & Nagar, 2010). The lowest values, down to 0.3 are observed to the north-east of the nucleus and the highest values of up to 5 are observed mostly along a strip running from south-west to north-west of the nucleus.
3.3 Gas kinematics
The profit routine (Riffel, 2010), which we have used to fit the emission line profiles, also outputs the centroid velocity (), velocity dispersion () and higher order Gauss-Hermite moments ( and ), which have been used to map the gas kinematics.
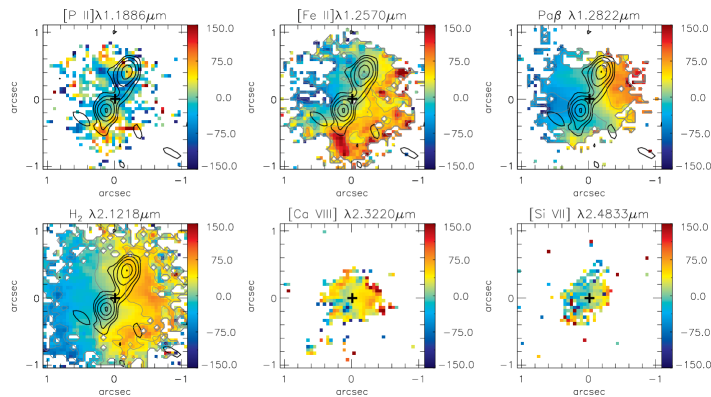
In Figure 5 we present the velocity fields obtained from the centroid wavelength of each emission line, with typical mean uncertainty of 8 . White regions in this figure represent locations where the S/N was not high enough to allow the fitting of the line profiles. Most velocity fields show mostly blueshifts to the east (left in the figures) and redshifts to the west, with the line of zero velocity running approximately vertically (north-south) for Pa and H2 and from the north-west to the south-east for [Fe ii]. The gas velocity fields differ from the stellar one, for which the line of zero velocity runs from the north-east to the south-west. The [Fe ii] emitting gas presents higher redshifts than the other emission lines, of up to 150 , observed to south-east of the nucleus, near to the edge of the radio structure. Similar redshifts are also observed in the [P ii] velocity field, which presents additionally some high blueshifts. As observed in the bottom-central and bottom-right panels, the coronal emitting gas, although just barely extended, seems to show similar kinematics to that observed for the rest of the ionized emitting gas.
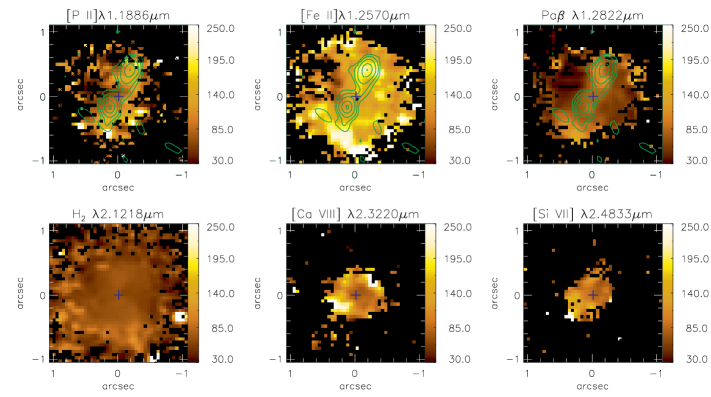
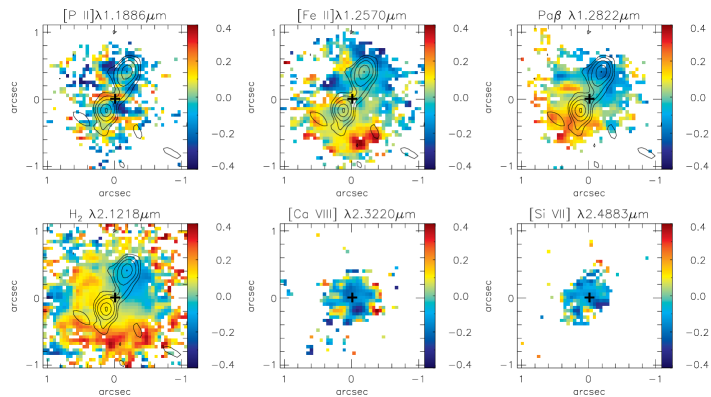
Figure 6 shows the velocity dispersion maps, which have typical mean uncertainties of 10 . The green contours overlaid to the [Fe ii] map are from the 3.6 cm radio continuum image. The [Fe ii] map shows the highest values of up to 250 in regions at and around the radio hot spots, while the lowest values ( ) are observed predominantly to north-east of the nucleus, away from the radio structure. The [P ii] map is similar to the [Fe ii] map, although with 30% lower values. The same is observed in the Pa map but with even lower values (50% lower), ranging from 50 (observed to north-east of the nucleus) to 130 , observed along PA=153 in association with the radio structure. The H2 emitting gas presents the lowest values, which are smaller than 60 at most locations. The coronal lines have similar values to those observed for the [P ii], with median values of 110 , being smaller than those seen in the [Fe ii].
In Figure 7 we present the maps, which show values ranging from to for most emission lines. The mean uncertainties in are smaller than 0.03 for all emission lines. The maps for the [P ii], [Fe ii], Pa and H2 emission lines show negative values – meaning blue wings – in the profiles to the north-west and positive values – meaning red wings – to the south-east, with the highest absolute values observed near the borders of the radio structure. The coronal lines of [Ca viii] and [Si vii] present mostly negative values, indicating the dominance of blue wings in their profiles.
The maps show values close to zero at most locations and are thus not shown. The mean uncertainties are smaller than 0.05 for all emission lines. The [Fe ii] and [P ii] show a few high values, of up to 0.4, to north-east and to south-west – away from the radio structure, meaning that the profiles are more peaked than gaussians at these locations.
3.4 Channel Maps
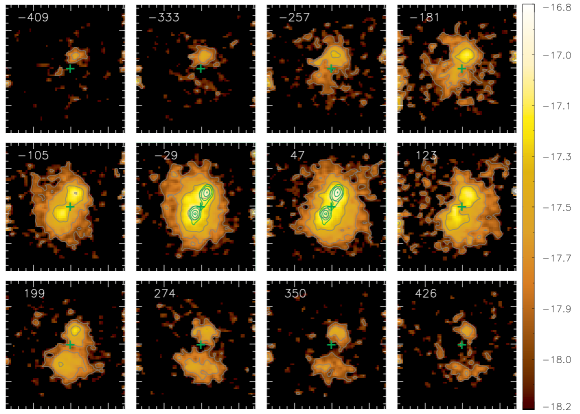
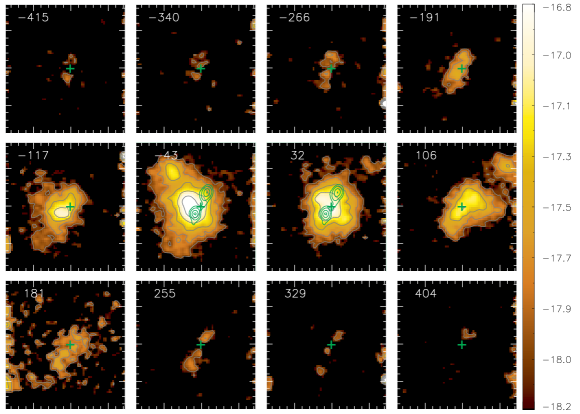
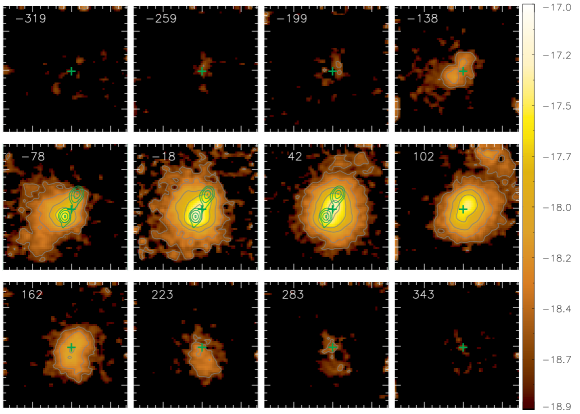
Channel maps along the emission line profiles are shown in Figures 8, 9 and 10 for the [Fe ii], Pa, and H2 emitting gas. Each panel presents the flux distribution in logarithmic units integrated within the velocity bin centred at the velocity shown in the top-left corner (relative to the systemic velocity of the galaxy). The central cross marks the position of the nucleus and the green contours overlaid to some panels are from the 3.6 cm radio image of Nagar et al. (1999). We do not show channel maps for [P ii] because they are similar and noisier than the [Fe ii] channel maps. We also do not show channel maps for the coronal lines because they do not bring additional information to that already contained in the velocity fields shown in Figs. 5 and 6.
In Figure 8, the channel maps along the [Fe ii] emission-line profile show the flux distributions integrated within velocity bins of 76 (corresponding to three spectral pixels). The highest blueshifts, which reach 400 , are observed at 04 north-west of the nucleus, approximately coincident with the radio hot spot, while the highest redshifts with similar velocities (400 ) are observed to both sides of the nucleus (at 04 north-west and 06 south-east) along the orientation of the radio structure. A good correlation between the radio image and the [Fe ii] flux distribution is observed at velocities close to zero, where the [Fe ii] emission shows two peaks, at 04 north-west and 02 south-east of the nucleus, at the location of the two radio hot spots.
Figure 9 shows the channel maps for the Pa emitting gas for the same velocity bin as for [Fe ii]. The highest blueshifts and redshifts, reaching 300 , are observed to both sides of the nucleus along the orientation of the radio jet (to north-west and south-east of the nucleus). The correlation between the radio and line emission observed for the [Fe ii] emitting gas for low velocities is not present in the Pa channel maps, as the emission at low velocities (between and 100 ) moves from the south-east (left and bellow the nucleus) to the north-west (right and above the nucleus), approximately following the stellar rotation pattern (blueshifts at the south-east to redshifts to the north-west of the nucleus). At the panel centred at 43 there is also a structure at 16 north-east of the nucleus, still observed at the panel centred at 32 although closer to the nucleus, and at the panel centred at 106 there is another structure at 18 north-west of the nucleus.
The channel maps along the H2 emission-line profile are shown in Figure 10 for a velocity bin of 60 (corresponding to two spectral pixels). These maps have some similarities to those of Pa, in the sense that at low velocities, the blueshifts are mostly observed to the east and south-east and redshifts mostly to the west and north-west, indicating rotation. But they reach lower velocities than Pa, are more uniformly distributed around the nucleus and are less correlated to the radio structure.
4 Discussion
4.1 Stellar kinematics
The stellar velocity field of the central region of Mrk 1157 (top-left panel of Fig. 2), suggests rotation. In order to obtain the systemic velocity, orientation of the line of nodes, the location of the kinematical centre and an estimate for the bulge mass, we have fitted the stellar velocities with a model of circular orbits in a plane subject to a Plummer gravitational potential, in which the velocity is given by (Barbosa et al., 2006; Riffel et al., 2008; Riffel & Storchi-Bergmann, 2011):
| (2) |
where is the projected distance from the nucleus in the plane of the sky, is the corresponding position angle, is the mass inside , is the Newton’s gravitational constant, is the systemic velocity, is the inclination of the disc ( for a face on disc), is the position angle of the line of nodes and is a scale length projected in the plane of the sky.
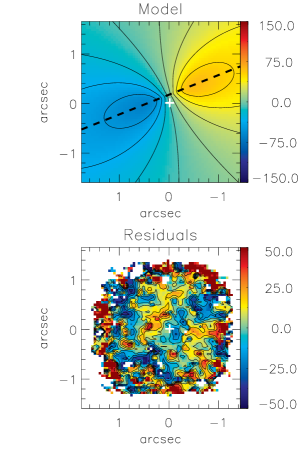
The equation above contains six free parameters [including the location of the kinematical centre ], which can be determined by fitting the model to the observations. This was done using a Levenberg-Marquardt least-squares fitting algorithm, in which initial guesses are given for the free parameters. In figure 11 we show the model which gave the best fit (top panel) and the corresponding residual map, obtained from the subtraction of the modelled from the observed velocities. The residuals are smaller than 30 at most locations, indicating a good reproduction of the velocity field, but the residual map shows some systematics. In particular, the “blueshifted strip” crossing the middle of the residual map and the partial “redshifted strip” to the left of it, resemble the residuals we have observed in the stellar velocity field of Mrk 1066, which we have attributed to the presence of an oval distortion or bar (Riffel & Storchi-Bergmann, 2011). This may also be the case of Mrk 1157, since it seems to have also a nuclear bar, as found by Malkan, Gorjian & Tam (1998) using HST broad band images. The stellar velocity field (Fig. 2) also suggests the presence of a small S-distortion in the “zero-velocity curve”, a signature of the presence of an asymmetry in the gravitational potential (Combes et al., 1995; Emsellem et al., 2006; Riffel & Storchi-Bergmann, 2011).
The parameters derived from the fit are: the systemic velocity corrected to the heliocentric reference frame 4473 8 km s-1, 112∘ 5∘, 5.40.5 108 M⊙, , and 119 18 pc. The derived kinematical centre is 1.513 pc and =6913 pc measured relative to the position of the peak of the continuum emission. The systemic velocity is about 25 smaller than the one quoted in Véron-Cetty & Veron (2001) and 75 smaller then that of Springob et al. (2005). We attribute these differences to our smaller field of view than those of the previous works, which have used the H i 21 cm line integrated within large apertures (3′) to derive . The inclination of the disc is in good agreement with the one obtained via the expression valid for a thin disk: , where and are the major and minor axes of the galaxy, respectively, as quoted in NASA/IPAC Extragalactic Database111http://nedwww.ipac.caltech.edu. The scale length and the bulge mass are similar to those obtained for the central region of other Seyfert galaxies using similar modelling (e.g. Barbosa et al., 2006; Riffel & Storchi-Bergmann, 2011).
The stellar velocity dispersion map (top-right panel of Fig. 2) shows a partial ring of low values () at 06–8 from the nucleus ( 230 pc) immersed in a background of of the bulge stars. The presence of the partial ring is evidenced by an increase in of about 40 , from locations at 06 to 1′′ from the nucleus, while the largest uncertainties are smaller than 20 . Similar low- structures have been observed around the nuclei of other Seyfert galaxies and attributed to colder regions with more recent star formation than the underlying bulge (Barbosa et al., 2006; Riffel et al., 2008, 2009; Riffel & Storchi-Bergmann, 2011). In particular, a recent study of the stellar population in the central region of Mrk 1066 (which shows a similar low- ring to that of Mrk 1157) confirms the above interpretation, since the stellar population – as derived from spectral synthesis – in the low- ring of Mrk 1066 is dominated by intermediate age (108 - 109 yr) stars (Riffel et al., 2010). We have also performed stellar population synthesis for Mrk 1157, which indicates a similar result to that obtained for Mrk1066: the stellar population in the low- regions are also dominated by intermediate age stars (Riffel et al., 2011).
The bulge stellar velocity dispersion can be used to estimate the mass of the super-massive black hole in the centre of Mrk 1157:
| (3) |
where , and km s-1 (Tremaine et al., 2002). We adopt km s-1 as representative of the bulge, a value in good agreement with previous optical measurements (Nelson & Whittle, 1995), and obtain M⊙.
4.2 Gaseous Excitation
In order to investigate the gaseous excitation, we constructed a spectral-diagnostic diagram [Fe ii]m/Pa H2m/Br, originally proposed for integrated spectra (Larkin et al., 1998; Rodríguez-Ardila et al., 2004; Rodríguez-Ardila, Riffel & Pastoriza, 2005). This diagram can be used to distinguish ratios of Seyferts, LINERS and Starbursts. In particular, Seyfert nuclei have values in the range 0.6[Fe ii]/Pa2.0 and 0.6H2/Br2.0 (e.g. Rodríguez-Ardila, Riffel & Pastoriza, 2005). Larger values are observed in LINERs and smaller values in Starbursts and H ii regions. The diagram is shown in the top panel of Fig. 12, in which the Seyfert-like values are represented by filled circles and LINER-like values by crosses. In the bottom panel of Fig. 12, we show how these values are distributed spatially in the galaxy. The nucleus has a Seyfert-like value, as well as the emitting gas to the east, in regions away from the radio jet. In regions co-spatial with the radio jet, the line ratios are LINER-like, and can be interpreted as being due to an additional emission of the H2 and [Fe ii] relative to the hydrogen recombination lines due to shocks between the radio jet and the gas. This conclusion is supported by the [Fe ii]/Pa and H2/Br line-ratio maps, as well as by the [P ii]/[Fe ii] map (Fig. 4), which show the highest values in regions co-spatial with the radio structure (see discussion bellow).

4.2.1 The H2 emission
The molecular hydrogen excitation can be investigated using its flux distribution, line ratios and kinematics and has been subject of several recent studies (e.g. Storchi-Bergmann et al., 1999; Reunanen, Kotilainen & Prieto, 2002; Rodríguez-Ardila et al., 2004; Rodríguez-Ardila, Riffel & Pastoriza, 2005; Davies et al., 2005; Riffel et al., 2006, 2008, 2009; Riffel, Storchi-Bergmann & Nagar, 2010; Sánchez et al., 2009; Ramos Almeida, Pérez García & Acosta-Pulido, 2009; Hicks et al., 2009; Storchi-Bergmann et al., 2009, 2010; Guillard et al., 2010). In summary, these studies support that the the H2 emission lines can be excited by two mechanisms: (i) fluorescent excitation through absorption of soft-UV photons (912–1108 Å) in the Lyman and Werner bands (Black & van Dishoeck, 1987) and (ii) collisional excitation due to heating of the gas by shocks, due to interaction of a radio jet with the interstellar medium (Hollenbach & McKee, 1989) or by X-rays from the central AGN (Maloney, Hollenbach & Tielens, 1996). The second mechanism is usually referred to as a thermal process since it involves the local heating of the emitting gas, while the first one is usually called a non-thermal process.
We can use the H22.2477/2.1218 ratio to distinguish between thermal and non-thermal processes for the H2 emission of Mrk 1157. For fluorescent excitation, typical values for this ratio are , while for thermal processes typical values are (e.g. Mouri, 1994; Reunanen, Kotilainen & Prieto, 2002; Rodríguez-Ardila et al., 2004; Storchi-Bergmann et al., 2009). As observed in Tab. 1, H22.2477/2.1218 for the nucleus and H22.2477/2.1218 at 04 north-west from it. Similar values are observed for all locations of the observed field. This result indicates that the H2 emission is due to thermal processes, as observed for other Seyfert galaxies (e.g. Rodríguez-Ardila et al., 2004; Rodríguez-Ardila, Riffel & Pastoriza, 2005; Riffel et al., 2006, 2008; Riffel, Storchi-Bergmann & Nagar, 2010; Storchi-Bergmann et al., 2009).
The thermal excitation temperature of the H2 emission can be obtained from the fluxes of its K-band emission lines, through the following relation (e.g. Wilman, Edge & Juhnstone, 2005; Storchi-Bergmann et al., 2009; Riffel, Storchi-Bergmann & Nagar, 2010):
| (4) |
where is the flux of the H2 line, is its wavelength, is the spontaneous emission coefficient, is the statistical weight of the upper level of the transition, is the energy of the level expressed as a temperature and is the excitation temperature. This relation is valid for thermal excitation, under the assumption of an ortho:para abundance ratio of 3:1. In Fig. 13 we present the observed values for (plus an arbitrary constant) for the nuclear spectrum and for the spectrum at position A in Fig. 1 (04 north-west from the nucleus). The fit of the above relation is shown in Fig. 13 as lines and resulted in an excitation temperature of K for the nucleus and K for the position A. As the observed fluxes are well reproduced by the fit of the above equation, it can be concluded that the H2 emitting gas is in thermal equilibrium at and that the ortho to para ratio is indeed 3, as assumed.

The result above thus supports thermal excitation for H2. The heating can be provided by nuclear X-rays and/or by shocks due to the interaction of the radio jet with the interstellar medium. How can we distinguish between these two mechanisms? Using the spatial information and its correlation with the radio: the highest intensity levels of the H2 emission are elongated following the orientation of the radio structure (bottom-left panel of Fig. 3), what is also observed in some of the H2 channel maps of Fig. 10. Additionally, the diagnostic diagram (Fig. 12) and the H2/Br line-ratio map (bottom-right panel of Fig. 4), show that the highest values for H2/Br of up to , are seen in regions which are co-spatial with the radio emission, suggesting that the radio jet plays a role in the H2 excitation.
The role of radio jets and X-rays in the emission of active galaxies was investigated by Quillen et al. (1999) using HST H2 images of a sample of 10 Seyfert galaxies, as well as their radio 6 cm and hard X-ray fluxes. They found no correlation with X-rays and a weak correlation with radio 6-cm, suggesting that no single mechanism is likely to be responsible for the H2 excitation in Seyfert galaxies. This seems to be the case also for Mrk 1157. Although we found some spatial correlation between the H2 flux and line ratios involving the H2 lines and the radio map, we cannot exclude X-ray heating because the H2 emission is less spatially correlated with the radio jet than both the [Fe ii] and Pa emitting gas. It has also smaller values (bottom-left panel of Fig. 6) than the other emission lines, being similar to the stellar values, suggesting that the H2 emitting gas is mainly located at the plane of the galaxy and is less affected by the radio jet than the other emission lines.
4.2.2 The [Fe ii] emission
The excitation mechanisms of the [Fe ii] emission can be investigated using the [Fe ii]m/Pa and [Fe ii]1.2570m/[P ii]1.8861m line-ratio maps shown in Fig. 4. The first ratio is controlled by the ratio between the volumes of partially to fully ionised regions, as the [Fe ii] emission is excited in partially ionised gas regions. In AGNs, such regions can be created by X-ray (e.g. Simpson et al., 1996) and/or shock (e.g. Forbes & Ward, 1993) heating of the gas.
For Starburst galaxies, [Fe ii]/Pa and for supernovae for which shocks are the main excitation mechanism, this ratio is larger than 2 (Rodríguez-Ardila et al., 2004; Rodríguez-Ardila, Riffel & Pastoriza, 2005). As observed in Figs. 4 and 12, for Mrk 1157 [Fe ii]/Pa ranges from 0.6 to 6, with the highest values observed at the borders of the radio structure, indicating that the excitation by radio shocks is important at these locations. The stronger correlation between the radio emission and the [Fe ii] flux map than with the other emission lines (see Fig. 3), as well as the higher increase in at the edge of the radio jet, support a higher contribution of the radio jet for the excitation of [Fe ii] than for H2. This result is in good agreement with our previous studies of the central region of Seyfert galaxies, which indicate that the radio shocks may be the main excitation mechanism of the [Fe ii] near-IR emission lines (Storchi-Bergmann et al., 1999; Riffel et al., 2006; Riffel, Storchi-Bergmann & Nagar, 2010; Storchi-Bergmann et al., 2009).
The above conclusion is also supported by the [Fe ii]1.2570m/[P ii]1.8861m line-ratio map (bottom-left panel of Fig. 4). These two lines have similar excitation temperatures, and their parent ions have similar ionisation potentials and radiative recombination coefficients. Values larger than 2 indicate that shocks have passed through the gas destroying the dust grains, releasing the Fe and thus enhancing its abundance and thus emission (Oliva et al., 2001; Storchi-Bergmann et al., 2009; Riffel, Storchi-Bergmann & Nagar, 2010). For supernova remnants, where shocks are the dominant excitation mechanism [Fe ii]/[P ii] is typically higher than 20 (Oliva et al., 2001). In locations near the tips of the radio jet, Mrk 1157 presents [Fe ii]/[P ii] values of up to 10, indicating that shocks are important at these locations in agreement with the highest values obtained for the [Fe ii]/Pa at the same locations. In other regions, typical values are [Fe ii]/[P ii], indicating a lower contribution from the radio jet and higher contribution from X-ray heating.
4.2.3 The coronal-line emission
Coronal lines are forbidden transitions from highly ionised species whose emission extends from the unresolved nucleus up to distances between a few tens to a few hundreds of parsecs, with the emission-line profiles usually presenting blue wings and being broader than low ionisation lines (e.g. Rodríguez-Ardila et al., 2006; Storchi-Bergmann et al., 2009; Mazzalay, Rodríguez-Ardila & Komossa, 2010).
In the case of Mrk 1157, the coronal-line emission of [Ca viii] m and [Si vii] m are spatially resolved by NIFS observations, as their flux distributions (bottom-middle and bottom-right panels of Fig. 3) present spatial profiles with FWHM04, which is about 3 times larger than that of the standard star. Although the extent of the coronal-line emission region of Mrk 1157 is much smaller than the extent of the low-ionisation region, its flux distributions are more extended along the radio jet, following the same orientation of the low-ionisation region, suggesting the same origin. This result supports an origin for the coronal lines in the inner part of the NLR, as suggested by previous authors (Rodríguez-Ardila et al., 2006). This interpretation is also supported by the kinematics of the coronal gas, which present similar centroid velocities (Fig. 5) and velocity dispersions (Fig. 6) to that of the low-ionisation lines. In addition, the maps for both coronal lines show high negative values of up to , indicating the presence of blue wings, in good agreement with previous studies of other Seyfert galaxies (e.g. Rodríguez-Ardila et al., 2006).
4.3 Gaseous Kinematics
As observed in Fig. 5 the gaseous velocity field presents blueshifts to the east and redshifts to the west, suggestive of rotation, although with the orientation of the rotation axis somewhat tilted relative to that of the stellar rotation (top-left panel of Fig. 2). There are also differences between the kinematics of the molecular and ionised gas, and between that of the ionised H and [Fe ii] emitting gas. The difference relative to the stellar kinematics is largest for [Fe ii], as the orientation of the apparent rotation axis differs from the stellar one by more than 45∘.
The gas kinematics and the differences in the velocity fields of the different gas species can be better understood by inspection of the channel maps of Figs. 8, 9 and 10. Fig. 8 shows that the [Fe ii] emission presents the highest blueshifts to the north-west and not to south-east, as expected for the rotation pattern followed by the stars (Fig. 2). This indicates that these highest velocities are not due to rotation. The highest blueshifts, of up to are observed at the location of the 04 NW radio hot spot. At lower blueshifts, there is [Fe ii] emission also to the south-east, which could thus be attributed to rotation in the galaxy plane. At velocities close to zero the emission is somewhat more uniformly distributed around the nucleus, although it seems to still keep some spatial correlation with the radio map. At low redshifts the most extended emission drifts to the west, consistent with the rotation contribution, while the remaining redshifts to the south-east are observed at the location of the SE hot spot, although being spread also to the west of this hot spot. At the highest redshifts, there is still emission from the structures to the south and from the region of the hot spot at the north-west.
The [Fe ii] kinematics can be understood as due to the combination of the contribution from gas in rotation in the galaxy plane and outflows associated with the radio jet, which has the north-west part somewhat tilted towards us (in order to produce blueshifts to the north-west). At low velocities, the [Fe ii] kinematics has an important contribution from rotation, as evidenced by the emission structure moving from south-east at negative velocities to north-west of the nucleus at positive velocities, approximately following the orientation of the line of nodes of the stellar velocity field. At high velocities the outflows dominate, pushed by the radio jet. Nevertheless, the spatial correlation with the radio jet seems to be present also in the lower velocity channels, suggesting that there is contribution from the radio jet in driving lower velocity kinematics as well. This is also supported by the high velocity dispersion observed over the whole region covered by the [Fe ii] emission (Fig. 6).
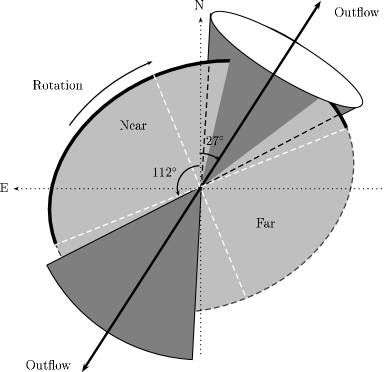
What is the orientation of the outflow relative to the galaxy plane? Inspection of the HST image of Mrk 1157 in combination with the observed kinematics, indicates that, if the spiral arms are trailing, the near side of the galaxy is the north–north-east (line of nodes at PA=112∘) and the far side is the south–south-west. The near (blueshifted) side of the outflow can thus have three orientations relative to the plane: (i) be along the plane, (ii) in front of it or (iii) behind it. If it is not along the plane, in order to appear extended in the sky, and to show blueshifts to the north-west, it should make an angle smaller than 45∘ with the plane, as this is the inclination of the galaxy plane (relative to the plane of the sky), as obtained from the fitting of the stellar velocity field. Inspection of the [Fe ii] emission distribution at the highest redshifts ( in the channel maps) reveals also some emission to the north-west at the location of the NW hot spot. This suggests that the outflows (and the radio jet), although having the north-west side somewhat tilted towards us, is launched close to the plane of the sky, so that, if the outflow opens in a cone, the blueshifts would come from the front wall of the cone and the redshifts from its back wall. If this is the case, the cone axis would be behind the plane to the north-west, with part of the wall of the cone in front of the plane depending on the launching angle and the cone opening angle. In Fig. 15 we present a sketch diagram for the geometry of the outflow relative to the plane of the galaxy and plane of the sky. To the south-east, the cone axis outflow would be in front of the plane. One difficulty with this scenario is the lack of emission to the south-east at the highest blueshifts, but this could be due to an asymmetry in the gas distribution along the path of the outflow. The hypothesis that the radio jet and associated outflow is oriented close to the plane of the sky is supported by the Pa channel maps (Fig. 9), which shows, at the highest blueshifts and redshifts, extended emission to both sides of the nucleus following the orientation of the radio jet. At lower velocities, the main contribution is from gas rotating in the plane, from blueshifts to the south-east to redshifts to the north-west.
The H2 channel maps (Fig. 10) reach smaller blueshifts but are similar to those of Pa for velocities between and 100 , consistent with rotation in the galaxy plane. At the highest redshifts there is some emission to the south–south-west, at the same location where there is some emission also from [Fe ii] at similar redshifts. There is less correlation with the radio structure than for Pa.
Distinct kinematics between the H2 and [Fe ii] kinematics seem to be a common characteristic of active galaxies, having been observed in many other Seyfert galaxies (Storchi-Bergmann et al., 1999; Rodríguez-Ardila et al., 2004; Rodríguez-Ardila, Riffel & Pastoriza, 2005; Riffel et al., 2006, 2008, 2009; Storchi-Bergmann et al., 2010; Riffel & Storchi-Bergmann, 2011).
4.3.1 Comparison between the stellar and gaseous kinematics
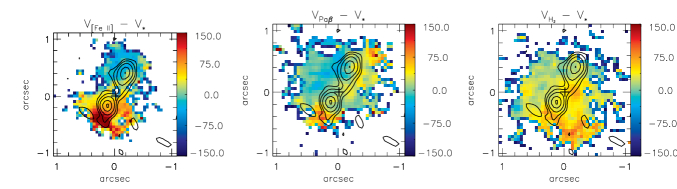
In order to map differences between the stellar and gaseous kinematics, we have constructed the residual maps of Fig. 14, obtained from the difference between the centroid [Fe ii], Pa and H2 velocities and the stellar velocity field.
The largest and clearest differences are observed in the [Fe ii] residuals, which show redshifts of up to 130 to the south-east and blueshifts of up to 80 to the north-west of the nucleus in clear association with the radio jet.
The Pa residuals are smaller than those of [Fe ii] but there are some blueshifts (30 ) to the north-east – thus not associated with the radio jet – which appear also in the channel map at (Fig. 9). The gas excitation is higher at this location (see Fig. 4) while the velocity dispersion is lower (Fig. 6). This could be a mild outflow, not shocked by the radio jet and ionised by the AGN. There are also some small redshifts (30 ) to the west–south-west, which could be a counterpart of the mild blueshifted outflow and some redshifts at the tip of the SE radio hot spot, where there is also an enhancement in the gas velocity dispersion, which could be part of the the outflow to the SE pushed by the radio jet.
The H2 residual maps show small redshifts mostly to the south–south-west (40 ), a structure also present in the redshifted H2 channel maps (Fig. 10), which could be part of the mild outflow observed in the Pa kinematics, as described above.
The residual maps support the interpretation discussed above for the channel maps. The negative velocities to north-west and positive velocities to the south-east, clearly observed in the [Fe ii] residual map along the radio jet can be interpreted as due to the emission of outflowing gas pushed by the radio jet. The [Fe ii] emitting gas is the best tracer of interaction between ambient gas and a radio jet, as the jet destroys dust grains on its way out, releasing the Iron which produces enhanced [Fe ii] emission at the shock locations. The presence of shocks explains the high [Fe ii] velocity dispersions. Such enhancements are expected when gas is disturbed by a radio jet (e.g. Dopita & Sutherland, 1995, 1996).
The [Fe ii] residual map also supports that the north-west part of the radio jet is somewhat tilted towards us, in spite of the fact that the channel maps also suggest that the angle between the jet and the plane of the sky is small, so that redshifts can also be observed at the location of the NW hot spot. It can thus be concluded that the farthest [Fe ii] emission originates in gas which extends to high galactic latitudes. This may be the case for some Pa emission at the highest velocities which produces some velocity dispersion enhancement seen in Fig. 6. But most of the Pa emission seems to originate in the galaxy plane, as revealed by the rotation pattern which dominates the emission in the Pa channel maps. Most of the H2 emission also seems to originate in gas rotating in the plane, as supported by the low velocity dispersions (Fig. 6). The fact that the molecular gas is observed mostly in the galaxy plane while the ionised gas is frequently observed to higher galactic latitudes has also been observed by us for other Seyfert galaxies (e.g. Riffel et al., 2006, 2008, 2009; Storchi-Bergmann et al., 2010; Riffel & Storchi-Bergmann, 2011). This can be understood as due to the fact that, in the plane, the molecular gas is more shielded by dust clouds from the ionizing radiation which can destroy the H2 molecule.
The velocity fields and maps for the coronal lines have similar values to those observed for the low ionisation species ([P ii], [Fe ii] and Pa), supporting an origin for these lines in the inner NLR, in good agreement with the results discussed in the previous section.
In Fig. 15 we present a sketch diagram for the physical scenario of the inner 450 pc of Mrk 1157. Two kinematic components are observed for the emitting gas. The first is due to gas located in the plane of the galaxy presenting a similar rotating pattern to that observed for the stars, with a disc inclination of relative to the plane of the sky and line of nodes oriented along PA. The second component is due to emission of the outflowing gas within a bi-cone, with opening angle of , oriented along PA, being oriented approximately perpendicular to the line of sight, making an angle of with the plane of the sky.
4.3.2 Mass outflow rate
In order to quantify the outflows from the nucleus of Mrk 1157, we estimate the ionised-gas mass outflow rate through a circular cross section located at 06 from the nucleus along a bi-cone with the same orientation of the radio jet (PA153∘) and opening angle of 60∘ (estimated from the left panel of Fig. 14). The component of the velocity of the outflowing gas along the bi-cone axis () is related to the observed velocity () by , where is the angle between the bi-cone axis and the plane of the sky, and thus the mass outflow rate can be obtained from
| (5) |
where is the area of the circular cross section, is the mass of a proton, is the filling factor, is the electron density and the factor 2 is included in order to account for the outflows to both sides of the nucleus. The filling factor can be obtained from the relation
| (6) |
where LPaβ is the Pa luminosity of the outflowing gas and is its volume, and the physical quantities are in units. We identify the outflowing gas as that corresponding to the channels at velocities higher than 200 (200 and 200 ), adding the fluxes of the corresponding channel maps plus half of the fluxes in the maps centred at and 181 (the other 50% being attributed to emission from gas in the plane of the galaxy), which is erg s-1 cm-2, resulting in erg s-1. The volume of the outflowing gas was estimated as a cone with height ″= 177.6 pc and opening angle of 60∘, resulting in and .
Assuming , and (from Fig. 14), we obtain .
As discussed above, the radio jet (and thus the bi-cone) is probably oriented close to the plane of the sky in order to account for the highest blueshifts and redshifts observed in the ionised gas emission. If , , which is of the order of the value we have recently obtained for NGC 4151, of (Storchi-Bergmann et al., 2010). This value is also within the range of values reported by Veilleux, Cecil & Bland-Hawthorn (2005) for warm ionised gas outflows from luminous active galaxies of .
In Barbosa et al. (2009) we have reported much smaller values, in the range for a sample of six Seyfert galaxies. But in that work we have adopted an electron density 5 times lower () and could not calculate the filling factor, adopting a value 25 times lower (). If we adopt the electron density and values of the present work, we would increase the values by a factor of 150, and the resulting values would be in the range , more similar to the above.
The same applies to the case of Riffel et al. (2009), for which we used and , and the value found of should be multiplied by 12.5, resulting in . In the case of Riffel et al. (2010), the factor is just 2.5, and the corresponding revised value is .
In the following we compare the mass outflow rate, obtained above, with the accretion rate necessary to power the AGN at the nucleus of Mrk 1157, which can be obtained from
| (7) |
where is the nuclear bolometric luminosity, is the efficiency of conversion of the rest mass energy of the accreted material into radiation and is the light speed. The bolometric luminosity can be approximated by , where is the H nuclear luminosity (e.g. Ho, 1999; Ho et al., 2001). The Br nuclear flux measured for a 025025 nuclear aperture is , as presented in Table 1. As shown in Fig. 4, we obtain a reddening of for the nucleus of Mrk 1157 using the Br/Pa line ratio. Correcting the Br flux for this reddening using the law of Cardelli, Clayton & Mathis (1989), we obtain . Assuming a temperature K and an electron density , the ratio between H and Br is predicted to be (Osterbrock & Ferland, 2006). Thus for a distance to Mrk 1157 of Mpc and the nuclear bolometric luminosity is estimated to be . Assuming , which is a typical value for a “standard” geometrically thin, optically thick accretion disc (e.g. Frank, King & Raine, 2002), we obtain a mass inflow rate of .
The mass outflow rate () in the NLR of Mrk 1157 is about four orders of magnitude larger than , a ratio comparable to those observed for other Seyfert galaxies (using the values presented above), which indicates that most of the outflowing gas observed in the NLR of active galaxies does not originate in the AGN (as the nuclear outflow rate cannot be higher than the accretion rate) but in the interstellar medium surrounding the galaxy nucleus, which is pushed away by the AGN outflow.
Finally, we can use the above mass outflow rate to estimate the kinetic power of the outflow. Following Storchi-Bergmann et al. (2010) the kinetic power can be obtained from
| (8) |
where is the velocity of the outflowing gas and is its velocity dispersion. Using km s-1 ( from Fig. 6) and km s-1 (discussed above) we obtain erg s-1. This kinetic power is in good agreement with those derived for the Seyfert galaxy NGC 4151 (Storchi-Bergmann et al., 2010) and for the warm outflow in compact radio sources (Holt et al., 2011, 2006; Morganti et al., 2005). Comparing the kinetic power with the bolometric luminosity we find that , implying that 15% of the mass accretion rate is transformed in kinetic power in the NLR outflows. This value is about one order of magnitude larger than the AGN feedback derived by Di Matteo, Springel & Hernquist (2005) in simulations for the co-evolution of black holes and galaxies, in order to match the relation and from one to two orders of magnitude higher than those derived for six Seyfert galaxies using integral field optical spectroscopy (after revising the filling factor and gas density values as discussed above) (Barbosa et al., 2009). Nevertheless, it should be noticed that the derived here may have an uncertainty of up to an order of magnitude due to the uncertainty in the geometry of the outflow.
5 Conclusions
We have analysed two-dimensional near-IR and bands spectra from the inner 450 pc radius of the Seyfert 2 galaxy Mrk 1157 obtained with the Gemini NIFS instrument at a spatial resolution of 35 pc (012) and velocity resolution of 3545 . We have mapped the emission-line flux distributions and ratios, as well as the stellar and gaseous kinematics, in the molecular and ionised emitting gas. The main conclusions of this work are:
-
•
The stellar velocity field is well reproduced by a model in which the stars follow circular orbits in a Plummer gravitational potential, with a major axis at PA=112. The near side of the galaxy is the north–north-east;
-
•
The stellar velocity dispersion presents a partial ring (radius 250 pc) of low values (5060 ) surrounded by higher values from the bulge stars. This low- ring is interpreted as being originated in colder regions with more recent star formation which still keep the lower velocity dispersion of the gas from which the stars have formed;
-
•
The stellar velocity dispersion of the bulge ( 100 ) implies a black hole mass of M⊙;
-
•
Emission-line flux distributions of molecular hydrogen and low-ionisation gas are most extended along PA in agreement with previous optical [O iii] imaging and following the radio jet. This emission extends to at least 450 pc (15) from the nucleus. The coronal lines of [Ca viii] and [Si vii] are resolved extending up to 150 pc (05) and are slightly more extended also along PA;
-
•
The reddening map obtained via the Pa/Br line ratio presents typical values of , with the highest values of up to seen at the nucleus;
-
•
The H2 gas is excited by thermal processes and has an excitation temperature K. Its emission is mainly due to X-ray excitation from the central AGN, but a small contribution from shocks produced by the radio jet cannot be discarded;
-
•
The [Fe ii] emission shows flux and velocity dispersion enhancements due to shocks produced by the radio jet which destroys the dust grains in its way out from the AGN, releasing the Fe;
-
•
From the comparison between the stellar and gaseous velocity fields, as well as from channel maps along the emission line profiles, we conclude that the gas has two kinematic components: (i) the first is due to gas located in the galaxy plane, in similar rotation to that characterizing the stellar motion; this component dominates the H2 emission; (ii) the second component is in outflow, which is oriented along the radio jet at PA=153∘ with the near (blueshifted) side to the north-west, but is launched close to the plane of the sky, making an angle less than 30∘ with the galaxy plane; this component extends to high latitudes and dominates the [Fe ii] emission;
-
•
The ionised gas mass outflow rate through a cross section with radius 100 pc located at a distance of 180 pc from the nucleus is ;
-
•
Revised mass outflow rates from our previous studies of 8 other Seyfert galaxies, using the better constrained filling factors and gas densities we have determined in the present study, are in the range 0.13–6.25 Myr-1, thus similar to the case of Mrk 1157. These rates are much larger than the accretion rates to the AGN, implying that most of the NLR outflow mass originates in the interstellar medium of the galaxy, which is pushed by a less massive nuclear outflow.
-
•
The coronal gas, although being less extended, has similar kinematics to that of the low-ionisation gas, suggesting an origin in the inner NLR.
Our final statement, which applies to all Seyfert galaxies we have recently observed with NIFS, is that the H2 and the [Fe ii] emitting gas sample different flux distributions and kinematics, indicating a distinct origin. The molecular gas is in rotation in the plane of the galaxy, where is the source of fuel for the super-massive black hole. The [Fe ii] emission, on the other hand, has higher velocity dispersions and extends to high latitudes, mapping mostly the AGN outflows.
Acknowledgements
We thank the referee, Joanna Holt, for valuable suggestions which helped to improve the present paper. This work is based on observations obtained at the Gemini Observatory, which is operated by the Association of Universities for Research in Astronomy, Inc., under a cooperative agreement with the NSF on behalf of the Gemini partnership: the National Science Foundation (United States), the Science and Technology Facilities Council (United Kingdom), the National Research Council (Canada), CONICYT (Chile), the Australian Research Council (Australia), Ministério da Ciência e Tecnologia (Brazil) and south-eastCYT (Argentina). This research has made use of the NASA/IPAC Extragalactic Database (NED) which is operated by the Jet Propulsion Laboratory, California Institute of Technology, under contract with the National Aeronautics and Space Administration. This work has been partially supported by the Brazilian institution CNPq.
References
- Barbosa et al. (2006) Barbosa, F. K. B., Storchi-Bergmann, T., Cid Fernandes, R., Winge, C., & Schmitt, H. 2006, MNRAS, 371, 170.
- Barbosa et al. (2009) Barbosa, F. K. B., Storchi-Bergmann, T., Cid Fernandes, R., Winge, C., Schmitt, H., 2009, MNRAS, 396, 2.
- Black & van Dishoeck (1987) Black, J. H., & van Dishoeck, E. F. 1987, ApJ, 322, 412.
- Cardelli, Clayton & Mathis (1989) Cardelli,J. A., Clayton, G. C. & Mathis, J. S., 1989, ApJ, 345,245.
- Cappellari & Emsellem (2004) Cappellari, M., Emsellem, E. 2004, PASP, 116, 138.
- Combes et al. (1995) Combes, F., Boissé, P., Mazure, A. & Blanchard, A., 1995, Galaxies and Cosmology, Springer-Verlag, Berlin, Germany.
- Crenshaw & Kraemer (2007) Crenshaw, D. M., & Kraemer, S. B. 2007, ApJ, 659, 250.
- Crenshaw et al. (2009) Crenshaw, D. M., Kraemer, S. B., Schmitt, Kaastra, J. S.; Arav, N., Gabel, J. R. & Korista, K. T. 2009, ApJ, 698, 281.
- Crenshaw et al. (2010b) Crenshaw, D. M., Kraemer, S. B., Schmitt, H. R.; Jaffé, Y. L., Deo, R. P., Collins, N. R. & Fischer, T. C. 2010a, ApJ, 139, 871.
- Crenshaw et al. (2010b) Crenshaw, D. M., Schmitt, H. R., Kraemer, S. B., Mushotzky, R. F. & Dunn, J. P. 2010b, ApJ, 708, 419.
- Davies et al. (2005) Davies, R. I., I., Sternberg, A., Lehnert, M. D., & Tacconi-Garman, L. E., 2005, ApJ, 633, 105.
- Davies et al. (2009) Davies, R. I., Maciejewski, W., Hicks, E. K. S., Tacconi, L. J., Genzel, R., & Engel, H. 2009, ApJ, 702, 114.
- Di Matteo, Springel & Hernquist (2005) Di Matteo, T., Springel, V., Hernquist, L. 2005, Nature, 433, 604.
- Dopita & Sutherland (1995) Dopita, M. A., & Sutherland, R. S. 1995, ApJ, 455, 468.
- Dopita & Sutherland (1996) Dopita, M. A., & Sutherland, R. S. 1996, ApJS, 102, 161.
- Emsellem et al. (2004) Emsellem, E. et al., 2004, MNRAS, 352, 721.
- Emsellem et al. (2006) Emsellem, E., Fathi, K., Wozniak, H., Ferruit, P., Mundell, C. G., Schinnerer, E. 2006, MNRAS, 365, 367.
- Fathi et al. (2006) Fathi, K., Storchi-Bergmann, T., Riffel, R. A., Winge, C., Axon, D. J., Robinson, A., Capetti, A., & Marconi, A., 2006, ApJl, 641, L25.
- Ferruit, Wilson & Mulchaey (2000) Ferruit, P., Wilson, A. S., & Mulchaey, J. 2000, ApJS, 128, 139.
- Fischer et al. (2010) Fischer, T. C., Crenshaw, D. M., Kraemer, S. B., Schmitt, H. R. & Trippe, M. L. 2010, AJ, 140, 577.
- Fischer et al. (2011) Fischer, T. C., Crenshaw, D. M., Kraemer, S. B., Schmitt, H. R. Mushotsky, R. F. & Dunn, J. P. 2011, ApJ, 727, 71.
- Forbes & Ward (1993) Forbes, D. A. & Ward, M. J. 1993, ApJ, 416, 150.
- Frank, King & Raine (2002) Frank, J., King, A. R., & Raine, D. J. 2002, Accretion Power in Astrophysics (3rd ed.; Cambridge: Cambridge Univ. Press)
- Ganda et al. (2006) Ganda, K., Falcón-Barroso, J., Peletier, R. F., Cappellari, M., Emsellem, E., McDermid, R. M., de Zeeuw, P. T., Carollo, C. M., 2006, MNRAS, 367, 46.
- Guillard et al. (2010) Guillard, P., Boulanger, F., Cluver, M. E., Appleton, P. N., Pineau Des Forêts, G., Ogle, P., 2010, A&A, 518, 59.
- Hicks et al. (2009) Hicks, E. K. S., Davies, R. I., Malkan, M. A., Genzel, R., Tacconi, L. J.; Sánchez, F. M., Sternberg, A., 2009, ApJ, 696, 448.
- Ho (1999) Ho, L. C. 1999, ApJ, 516, 672.
- Ho et al. (2001) Ho, L. C., et al. 2001, ApJ, 549, L51
- Hollenbach & McKee (1989) Hollenbach, D., & McKee, C. F., 1989, ApJ, 342, 306.
- Holt et al. (2006) Holt J., Tadhunter C., Morganti R., Bellamy M., González Delgado R. M., Tzioumis A., Inskip K. J., 2006, MNRAS, 370, 1633.
- Holt et al. (2011) Holt, J., Tadhunter, C. N., Morganti, R., Emonts, B. H. 2011, MNRAS, 410, 1527.
- Kraemer et al. (2009) Kraemer, S. B., Trippe, M. L., Crenshaw, D. M., Meléndez, M., Schmitt, H. R. & Fischer, T. C. 2009, ApJ, 698, 106.
- Larkin et al. (1998) Larkin, J. E., Armus, L., Knop, R. A., Soifer, B. T., & Matthews, K., 1998, ApJS, 114, 59.
- Malkan, Gorjian & Tam (1998) Malkan, M. A., Gorjian, V. & Tam, R., 1998, ApJS, 117,25.
- Maloney, Hollenbach & Tielens (1996) Maloney, P. R., Hollenbach, D. J., & Tielens, A. G. G. M., 1996, ApJ, 466, 561.
- Mazzalay, Rodríguez-Ardila & Komossa (2010) Mazzalay, X., Rodríguez-Ardila, A., & Komossa, S., 2010, MNRAS, 405, 1315.
- McGregor et al. (2003) McGregor, P. J. et al., 2003, Proceedings of the SPIE, 4841, 1581.
- Moran et al. (2000) Moran, E. C., Barth, A. J., Kay, L. E., & Filippenko, A. V., 2000, ApJ, 540, L73.
- Morganti et al. (2005) Morganti R., Tadhunter C. N., Oosterloo T. A., 2005, A&A, 444, L9.
- Mouri (1994) Mouri, H. 1994, ApJ, 427, 777.
- Mulchaey, Wilson & Tsvetanov (1996a) Mulchaey, J. S., Wilson, A. S., & Tsvetanov, Z., 1996a, ApJS, 102, 309.
- Mulchaey, Wilson & Tsvetanov (1996b) Mulchaey, J. S., Wilson, A. S., & Tsvetanov, Z. 1996b, ApJ, 467, 197.
- Mundell & Shone (1999) Mundell C. G., Shone D. L., 1999, MNRAS, 304, 475.
- Nagar et al. (1999) Nagar, N. M., Wilson, A. S., Mulchaey, J. S. & Gallimore, J. F., 1999, ApJS, 120, 209.
- Nelson & Whittle (1995) Nelson, C. H., & Whittle, M., 1995, ApJS, 99, 67.
- Osterbrock & Ferland (2006) Osterbrock, D. E. & Ferland, G. J., 2006, Astrophysics of Gaseous Nebulae and Active Galactic Nuclei, Second Edition, University Science Books, Mill Valley, California.
- Oliva et al. (2001) Oliva, E. et al. 2001, A&A, 369, L5.
- Quillen et al. (1999) Quillen, A. C., Alonso-Herrero, A., Rieke, M. J., Rieke, G. H., Ruiz, M., & Kulkarni, V. 1999, ApJ, 527,
- Ramos Almeida, Pérez García & Acosta-Pulido (2009) Ramos Almeida, C., Pérez García, A. M., & Acosta-Pulido, J. A., 2009, ApJ, 694, 1379.
- Reunanen, Kotilainen & Prieto (2002) Reunanen, J., Kotilainen, J. K., & Prieto, M. A., 2002, MNRAS, 331, 154.
- Rodríguez-Ardila et al. (2004) Rodríguez-Ardila, A., Pastoriza, M. G., Viegas, S., Sigut, T. A. A., & Pradhan, A. K., 2004, A&A, 425, 457.
- Rodríguez-Ardila, Riffel & Pastoriza (2005) Rodríguez-Ardila, A., Riffel, R., & Pastoriza, M. G. 2005, MNRAS, 364, 1041.
- Rodríguez-Ardila et al. (2006) Rodríguez-Ardila, A., Prieto, M. A., Viegas, S. & Gruenwald, R. 2006, ApJ, 653, 1098.
- Riffel et al. (2006) Riffel, Rogemar A., Sorchi-Bergmann, T., Winge, C., Barbosa, F. K. B., 2006, MNRAS, 373, 2.
- Riffel et al. (2008) Riffel, Rogemar A., Storchi-Bergmann, T., Winge, C., McGregor, P. J., Beck, T., Schmitt, H. 2008, MNRAS, 385, 1129.
- Riffel et al. (2009) Riffel, Rogemar A., Storchi-Bergmann, T., Dors, O. L., Winge, C., 2009, MNRAS, 393, 783.
- Riffel, Storchi-Bergmann & Nagar (2010) Riffel, Rogemar A., Storchi-Bergmann, T. & Nagar, N. M., 2010, MNRAS, 404, 166.
- Riffel et al. (2010) Riffel, Rogemar A. & Storchi-Bergmann, T., Riffel, R., & Pastoriza, M. G., 2010, ApJ, 713, 469.
- Riffel & Storchi-Bergmann (2011) Riffel, Rogemar A. & Storchi-Bergmann, T., 2011, MNRAS, 411, 469.
- Riffel (2010) Riffel, Rogemar A., 2010, Ap&SS, 327, 239.
- Riffel, Rodríguez-Ardila, & Pastoriza (2006) Riffel, R., Rodríguez-Ardila, A. & Pastoriza, M. G., 2006, A&A, 457, 61.
- Riffel et al. (2007) Riffel, R., Pastoriza, M. G., Rodríguez-Ardila, A., & Maraston, C., 2007, ApJ, 659, 103.
- Riffel et al. (2011) Riffel, R., Riffel, Rogemar A., Ferrari, F., & Storchi-Bergmann, T., 2011, MNRAS, accepted, arXiv1105.2487R.
- Sánchez et al. (2009) Sánchez, F. M., Davies, R. I., Genzel, R., Tacconi, L. J., Eisenhauer, F., Hicks, E. K. S., Friedrich, S., & Sternberg, A., 2009, ApJ, 691, 749.
- Schmitt & Kinney (1996) Schmitt, H. R. & Kinney, A. L. 1996, ApJ, 463, 498.
- Simpson et al. (1996) Simpson, C., Forbes, D. A., Baker, A. C., & Ward, M. J. 1996, MNRAS, 283, 777.
- Springob et al. (2005) Springob, C. M., Haynes, M. P., Giovanelli, R., & Kent, B. R., 2005, ApJS, 160, 149.
- Storchi-Bergmann et al. (1999) Storchi-Bergmann, T., Winge, C., Ward, M. & Wilson, A. S., 1999, MNRAS, 304, 35.
- Storchi-Bergmann et al. (2007) Storchi-Bergmann, T., Dors Jr., O., Riffel, R. A., Fathi, K., Axon, D. J., & Robinson, A., 2007, ApJ, x, x.
- Storchi-Bergmann et al. (2009) Storchi-Bergmann, T., McGregor, P. Riffel, Rogemar A., Simões Lopes, R., Beck, T., Dopita, M., 2009, MNRAS, 394, 1148.
- Storchi-Bergmann et al. (2010) Storchi-Bergmann, T., Simões Lopes, R., McGregor, P. Riffel, Rogemar A., Beck, T., Martini, P., 2010, MNRAS, 402, 819.
- Tremaine et al. (2002) Tremaine, S., Gebhardt, K., Bender, R., Bower, G., Dressler, A., Faber, S. M., Filippenko, A. V., Green, R., Grillmair, C., Ho, L. C., Kormendy, J., Lauer, T. R., Magorrian, J., Pinkney, J., & Richstone, D., 2002, ApJ, 574, 740.
- Ulvestad & Wilson (1989) Ulvestad, J. S., & Wilson, A. S., 1989, ApJ, 343, 659.
- van de Ven & Fathi (2010) van de Ven, G., & Fathi, K., 2010, ApJ, 723.
- Veilleux, Goodrich & Wilson (1997) Veilleux, S. A., Goodrich, R. W., & Hill, G. J. 1997, ApJ, 477, 631.
- Veilleux, Cecil & Bland-Hawthorn (2005) Veilleux, S., Cecil, G., & Bland-Hawthorn, J. 2005, ARA&A, 43, 769.
- Véron-Cetty & Veron (2001) Véron-Cetty, M. P., & Véron, P., 2001, A&A, 374, 92.
- Wilman, Edge & Juhnstone (2005) Wilman, R. J., Edge, A. C., & Juhnstone, R. M., 2005, MNRAS, 359, 755.
- Wilson et. al. (1993) Wilson, A. S., Braatz, J. A., Heckman, T. M., krolic, J. H., & Miley, G. K. 1993, ApJ, 419, L61.
- Winge, Riffel & Storchi-Bergamann (2009) Winge, C., Riffel, Rogemar A., Storchi-Bergmann, T., 2009, ApJS, 185, 186.