A 95 GHz Class I Methanol Maser Survey Toward GLIMPSE Extended Green Objects (EGOs)
Abstract
We report the results of a systematic survey for 95 GHz class I methanol masers towards a new sample of 192 massive young stellar object (MYSO) candidates associated with ongoing outflows (known as extended green objects or EGOs) identified from the Spitzer GLIMPSE survey. The observations were made with the Australia Telescope National Facility (ATNF) Mopra 22-m radio telescope and resulted in the detection of 105 new 95 GHz class I methanol masers. For 92 of the sources our observations provide the first identification of a class I maser transition associated with these objects (i.e. they are new class I methanol maser sources). Our survey proves that there is indeed a high detection rate (55%) of class I methanol masers towards EGOs. Comparison of the GLIMPSE point sources associated with EGOs with and without class I methanol maser detections shows they have similar mid-IR colors, with the majority meeting the color selection criteria -0.6[5.8]-[8.0]1.4 and 0.5[3.6]-[4.5]4.0. Investigations of the IRAC and MIPS 24 m colors and the associated millimeter dust clump properties (mass and density) of the EGOs for the sub-samples based on which class of methanol masers they are associated with suggests that the stellar mass range associated with class I methanol masers extends to lower masses than for class II methanol masers, or alternatively class I methanol masers may be associated with more than one evolutionary phase during the formation of a high-mass star.
1 Introduction
Methanol masers are quite common in massive star forming regions (MSFRs). Historically they have been empirically classified into two categories (class I and class II). The initial classification was based on the sources towards which the different transitions were detected (Batrla et al. 1988; Menten 1991a). Class II methanol masers are often found to be associated with strong centimeter continuum emission within 1′′ (e.g. ultracompact (UC) regions; Walsh et al. 1998), infrared sources and OH masers. The strongest and best known class II transition is the 5 A+ line at 6.7 GHz. Since its discovery (Menten 1991b), this class bright maser has become a reliable tool for detecting and studying regions where massive stars form and are in their very early stages of evolution (e.g. Minier et al 2003; Bourke et al 2005; Ellingsen 2006; Xu et al 2008; Pandian et al 2008). A number of surveys have been conducted for the 6.7 GHz class II methanol maser, resulting in the detection of 900 sources in the Galaxy to date. The surveys include those that are summarized in the compilation of Pestalozzi et al. (2005) and the recent searches of Pandian et al. (2007), Ellingsen (2007), Xu et al. (2008; 2009) and the Parkes Methanol Multibeam (MMB) blind survey ( 300 sources (Green et al. 2009), but so far only part published by Caswell et al. 2010 and Green et al. 2010). In contrast class I methanol masers are usually found offset by 0.1 - 1.0 pc from UC Hii regions, infrared sources and OH masers (e.g. Plambeck & Menten 1990; Kurtz et al. 2004). A number of observations of class I methanol masers showed that they were located at the interface between molecular outflows and the parent cloud (Plambeck & Menten 1990; Johnston et al. 1997; Kurtz et al. 2004; Voronkov et al. 2006). These early results suggested that class I and class II methanol masers favored very different environments. These observational findings were supported by early theoretical models of methanol masers which found that class I masers are collisionally excited, in contrast to class II masers which have a radiative pumping mechanism (Cragg et al. 1992). Observations made since the mid-1990s (e.g. Slysh et al. 1994) have shown that at single dish resolutions class I and class II masers are often associated. Observations at high spatial resolution (e.g. Cyganowski et al. 2009) show that while the two types of masers are typically not co-spatial on arcsecond scales, they are usually driven by the same young stellar object.
Compared to class II masers, class I methanol masers are relatively poorly studied and understood. There have only been a few large surveys for class I masers (mainly at 44 and 95 GHz), primarily undertaken with single-dish telescopes (e.g. Haschick et al. 1990; Slysh et al. 1994; Val’tts et al. 2000; Ellingsen 2005) along with a few smaller scale interferometric searches (e.g. Kurtz et al 2004; Cyganowski et al. 2009). These have resulted in the detection of about 200 class I maser sources in the Galaxy to date (Val’tts et al. 2010).
Observations and theoretical calculations suggest that class I methanol masers can form in the interface region between outflows and the ambient molecular gas. The methanol abundance is significantly increased in the shocked interface regions (e.g. Gibb & Davis 1998) and the gas is heated and compressed providing more frequent collisions, which results in more efficient pumping (Voronkov et al. 2006). Interferometric observations have shown the location of some class I methanol masers correlates closely with the shocked gas in outflows as traced by 2.12 m H2 and SiO (e.g. Plambeck & Menten 1990 ; Voronkov et al. 2006). However, such a close physical association between the shocks driven by outflows and the class I masers has only been firmly established in a small number of sources. One of the problems encountered in studying the relationship between outflows (or shocks) and class I methanol masers has been in finding an appropriate outflow tracer (one which is frequently associated with class I maser emission). Recently Cyganowski et al. (2008) have suggested that the 4.5 m band of the Spitzer Space Telescope’s Infrared Array Camera (IRAC) offers a promising new approach for identifying massive young stellar objects (MYSOs) with outflows. The strong, extended emission in this band is usually thought to be produced by shock-excited molecular H2 and CO in protostellar outflows (e.g. Noriega-Crespo et al. 2004; Reach et al. 2006; Smith et al. 2006; Davis et al. 2007; Ybarra & Lada 2009, 2010). These extended 4.5 m emission features are commonly known as “extended green objects” (EGOs; Cyganowski et al. 2008) or “green fuzzies” (Chambers et al. 2009) due to the common color-coding of the 4.5 m band as green in three-color images. These objects are providing a new and powerful outflow tracer for MSFRs. Cyganowski et al. (2008) have catalogued over 300 EGOs from the Galactic Legacy Infrared Mid-Plane Survey Extraordinaire (GLIMPSE) I survey (Churchwell et al. 2009), and they divided cataloged EGOs into “likely” and “possible” MYSO outflow candidates based primarily on the angular extent and morphology of the 4.5 m. Recent mid-infrared spectroscopic observations of two EGOs identified by Cyganowski et al. showed the presence of strong shocked H2 in the 4-5 m wavelength range from one of the sources, but no evidence for shocked gas in the second (De Buizer & Vacca 2010). They suggest that some EGOs may be due to spatial variations in the mid-infrared extinction and exaggerated color stretches rather than shocked gas, however, the rate of mis-classification of EGOs is at present very poorly determined. Based on the mid-IR colors of EGOs and their correlation with infrared dark clouds (IRDC) and known 6.7 GHz methanol masers, Cyganowski et al. (2008) further suggests that most EGOs trace a population of actively accreting MYSO outflow candidates. Utilizing the published high resolution masers known at the time, Cyganowski et al. found that 6.7 GHz class II methanol masers are associated with 73% (35 detections from 48 EGOs) of “likely” and 27% (11 detections from 67 EGOs) of “possible” MYSO outflow candidate EGOs.
Chen et al. (2009) have analyzed 61 EGOs from the Cyganowski et al. catalog that have been included in class I methanol maser surveys. Four previous class I methanol maser surveys (for the 44 GHz – A+ transition by Slysh et al. (1994) and Kurtz et al. (2004) and for the 95 GHz – A+ transition by Val’tts et al. (2000) and Ellingsen (2005)) were included in their statistical analysis. They found that 41 EGOs are associated with one or both of the 95 and 44 GHz class I methanol masers within 1 arcmin, thus the expected detection rate of class I masers in EGOs is 67% at this resolution. Based on this high predicted detection rate, they suggested that GLIMPSE-identified EGOs might provide one of the best targeted samples for searching for class I methanol masers. However their statistical study is also subject to unknown influences produced by the target selection effects in the four class I maser surveys they have utilised in the study. For example, most of the currently known class I masers are associated with class II masers (72% as reported by Valt́ts & Larinov 2007), for which a good association with EGOs has already been demonstrated by Cyganowski et al. (2008). Table 3 of Chen et al. (2009) shows that most EGOs (57/61) used in their statistical analysis are also associated with 6.7 GHz class II masers. According to Cyganowski et al. (2008), the majority of EGOs (35/48=73% in the likely sample) are associated with 6.7 GHz class II masers, and the sample of known class I masers is largely a subset of the sample of known class II masers, so a high detection rate for class I masers towards these EGOs is not unexpected. Recent 6.7 GHz class II and 44 GHz class I methanol maser surveys toward 20 EGOs in the northern hemisphere with the VLA reported by Cyganowski et al. (2009) also show that 64% and 89% of EGOs are associated with class II and class I methanol masers, respectively. However, their observations only targeted a small number ( 20) of “likely” outflow candidate EGOs. And their 44 GHz survey sample is essentially a 6.7 GHz methanol maser selected sample (19 sources observed at 44 GHz (17/19 with class I masers), of which 18 had associated 6.7 GHz methanol masers (16/18 with class I masers)).
In order to determine whether there is indeed a high association rate of class I methanol masers in EGOs and to investigate the relationship between them, it is necessary to perform a class I maser search towards a full EGO-based target sample. In this paper, we report a 95 GHz class I methanol maser survey towards an EGO-selected sample which has been undertaken with the Australia Telescope National Facility (ATNF) 22-m millimetre antenna at Mopra. In Section 2 we describe the sample and observations, in Section 3 we present the results of the survey, the discussion is given in Section 4, followed by our conclusions in Section 5.
2 Source selection and Observations
2.1 Source selection
The EGO catalog compiled by Cyganowski et al. (2008) lists a total of 302 sources, of which 137 are classified as “likely” and 165 as “possible” outflow sources. All EGOs with declinations in the range from -62∘ to +25∘ are accessible with Mopra. However, there are some sources which have an angular separation of less than 20′′ (corresponding the half beam size of the Mopra antenna; see below), from their nearest EGO. Where this occurred, we observed at the position of those classified as “likely” outflow sources, or when neither fell into this category, at the location with the larger 4.5 m flux density. Chen et al. (2009) reported that 61 EGOs have previously been observed in 44 and 95 GHz class I methanol maser surveys. For these sources we re-observed 10 (of 16) EGOs which had not been observed at 95 GHz in previous searches (see Table 1). Note that we did not make observations of 6 of the sources without 95 GHz information in Chen et al. sample in present survey (see Table 6 for this). After applying these selection criteria we were left with a total of 191 EGOs to be observed. Among these sources, 65, 17 and 3 sources were selected from Tables 1, 2 and 5 of Cyganowski et al. (2008), respectively – thus 85 “likely” outflow candidates; 55 and 51 sources were selected from Tables 3 and 4, respectively – thus 106 “possible” outflow candidates. In addition, a well studied MYSO IRDC 18223-3 which shows distinctly extended 4.5 m emission (Beuther & Steinacker 2007) was also included as a “likely” outflow candidate. In this paper we report the results of our 95 GHz class I methanol maser survey toward these 192 sources.
Table 1 lists the target sample source parameters including the source name (derived from the Galactic coordinates), the equatorial coordinates and whether the EGO is associated with an IRDC, 6.7 GHz class II methanol maser, 1665 or 1667 MHz OH maser, UC Hii region or 1.1 millimeter (mm) continuum source. The positional accuracies of the 6.7 GHz methanol maser catalogs (Cyganowski et al. 2009; Caswell 2009; Xu et al. 2009; Caswell et al. 2010; Green et al. 2010), OH maser catalog (Caswell 1998) and UC Hii region catalogs (Wood & Churchwell 1989; Becker et al. 1994; Kurtz et al. 1994; Walsh et al. 1998; Cyganowski et al. 2009) used in our analysis, are usually better than 1′′. The positional uncertainty of the 1.1 mm continuum sources in the BOLOCAM Galactic Plane Survey (BGPS) is also of the order of several arcseconds (Rosolowsky et al. 2010). The Spitzer GLIMPSE point source catalog has also a high positional accuracy (better than 1″), however, EGOs are extended objects with angular extents between a few and 30′′ (Cyganowski et al. 2008). Thus we have assumed an association between EGOs and other tracers for separations of less than 30′′. For BGPS sources, we used their peak positions (rather than centroid positions) available in the BGPS catalog (Rosolowsky et al. 2010) and did not account for their sizes in the cross-matching. We list the characteristics (including targeted/untargeted, area covered, angular resolution, sensitivity and extent of overlap with the GLIMPSE I survey area from which the EGO targets are drawn) for the maser, UC Hii region and BGPS 1.1 mm datasets used in our analysis in Table 2. To more clearly show the associations among these tracers and EGOs, we have also ploted the positions of the masers, UC Hii regions, and mm sources on the Spitzer 3-color IRAC images for all 192 targeted sources in our Mopra survey in Figure 1. From this figure, it can be seen that most of class II methanol (marked by black crosses) and OH masers (marked by red small circles) are close to the EGO positions (marked by blue pluses) with typical separations between them of less than 5. But for UC Hii regions (marked by blue squares) and mm sources (marked by yellow diamonds), they usually have a slightly larger separation from the targeted EGO position. One possible reason is that the UC Hii regions and mm sources have larger angular sizes, of order a few to a few tens of arcseconds. Even though there are larger separations between EGOs and UC Hii regions and mm sources, we still consider them to be associated in our analysis. However we recognize that in some cases there may be no true physical association between them.
2.2 Observations
The observations were made using the Mopra 22m telescope during 2009 August 9-20. Mopra is located near Coonabarabran, New South Wales, Australia. The telescope is at latitude 31 degrees south and has an elevation of 850 metres above the sea level. A 3 mm Monolithic Microwave Integrated Circuits (MMICs) receiver with a frequency range from 76 to 117 GHz is installed. The UNSW Mopra spectrometer (MOPS) provides four 2.2 GHz bands which overlap slightly to give a total instantaneous bandwidth of 8 GHz. MOPS was used in zoom mode for the observations reported here. In this mode, up to 4 zoom windows can be selected within each 2.2 GHz band thus allowing up to 16 spectral lines to be observed simultaneously at high spectral resolution. Each zoom window provides a bandwidth of 137 MHz with 4096 channels for each polarisation, which leads to a total velocity range of 430 km s-1 and a velocity resolution of 0.11 km s-1 per channel in the 3 mm band. The 8 GHz bandpass was centred at 94.3 GHz to provide a complete coverage over the 90.3–98.3 GHz range. Within this range we configured the individual zoom windows to simultaneously cover the strong lines in the 3 mm band, e.g. HNC (90.6635680 GHz), CH3CN ( 92 GHz), N2H+ ( 93.17 GHz), CS (97.9809533 GHz), C34S (96.4129495 GHz), A+ CH3OH maser (95.1694630 GHz) and a series of lines of CH3OH ( 96.7 GHz). In this paper we will focus on the results of the 95 GHz class I methanol masers band. The results from the other lines will be reported in subsequent publications.
Each source was observed in a position-switching mode with 1 minute spent at the on-source position and 1 minute at a reference position. This procedure was repeated a number of times to yield a total of 11–13 minutes of on-source integration for most sources. Two different reference positions offset by +8 and -8 arcminutes in declination from the targeted EGO sites were used. The antenna pointing was checked at hourly intervals by observing nearby bright 86 GHz SiO masers with known positions. The nominal pointing accuracy is estimated to be better than 5″. The system temperature was typically between 180-250 K depending on weather conditions and telescope elevation, resulting in an rms noise level of 30 mK per channel after averaging the two polarizations and Hanning smoothing. The half-power main-beam size and the main-beam efficiency were 36′′ and 0.5, respectively at 3 mm band (Ladd et al. 2005). The measured antenna temperatures (T) were further calibrated on to a main beam temperature scale (TMB) by dividing by the main beam efficiency. Then a conversion factor of 9.3 Jy K-1 can be estimated from Equ. 8.19 of Rohlfs & Wilson (2004) to convert the main beam temperature to a flux density. Thus a direct conversion factor from T to Jy would be 18.6 Jy K-1. The resulting flux density detection limit was Jy (3 ; the typical rms noise is 0.55 Jy) per channel. The sensitivity of 18.6 Jy K-1 for our 95 GHz class I methanol maser survey is significantly better than that of 40 Jy K-1 in previous similar surveys with Mopra (e.g. Val’tts et al. 2000; Ellingsen 2005), largely because the effective antenna diameter has been increased from 15 to 22 meters in the 3 mm band since 1999.
The spectral line data were reduced and analyzed with the ATNF spectral line reducing software (ASAP) and the GILDAS/CLASS package. During the reduction, quotient spectra were formed for each on/off pair of observations which were then averaged together. A low-order polynomial baseline fitting and subtraction, and Hanning smooth were performed for the averaged spectra. For some sources the resulting spectra still contained baseline ripples due to bad weather and for these cases, we Fourier transformed the spectrum and flagged the data in frequency space to reduce the influence of the baseline ripple. This procedure was also undertaken with ASAP (for more details see the Mopra Website111http://www.narrabri.atnf.csiro.au/mopra/obsinfo.html). Usually the 95 GHz methanol spectra do not have a particularly Gaussian profile, possibly because the spectra are blended with multiple maser features within a similar velocity range. We converted all the data into CLASS format and performed Gaussian fitting of each possible maser feature for each detected source with the CLASS package.
3 Results
3.1 Nature of Detected Emission
95 GHz class I methanol emission was detected towards 105 sites from the 192 searched positions, yielding a detection rate of 55% for this survey. The detected sources are listed, along with the parameters of Gaussian fits to their 95 GHz spectral features in Table 3. The detected emissions range in strength from 0.2 to 108 Jy (corresponding to main beam temperatures TBM 0.02 to 11.6 K), derived from the Gaussian fits. Spectra of each of the detected 95 GHz emission after Hanning smooth are shown in Figure 2. The sources for which no 95 GHz emission was detected are listed in Table 4, along with the 1 noise of the observation (typically less than 0.7 Jy). We consider a source to have been detected if it exhibits emission stronger than 3 . All of the 105 detected 95 GHz methanol sources are new detections in this transition. Among them, only 13 sources have previously been detected in the 44 GHz class I methanol transition in recent VLA surveys (G34.26+0.15 detected by Kurtz et al. 2004; G10.29-0.13, G10.34-0.14, G11.92-0.61, G18.67+0.03, G18.89-0.47, G19.01-0.03, G19.36-0.03, G22.04+0.22, G23.96-0.11, G24.94+0.07, G25.27-0.43 and G39.10+0.49 detected by Cyganowski et al. 2009). Therefore 92 new class I methanol emission sources have been found in this survey. From the spectra of the class I methanol emission sources shown in Figure 2 it can be seen that the class I emission often consists of one or more narrow spectral features which can be treated as maser emission, apparently superimposed on broader emission features. Examination of Table 3 shows that spectral features with widths 1 km s-1 are common in the detected sources. The characteristic of broader emission features in class I transition is very similar to that reported by Ellingsen (2005). From single-dish observations we cannot determine whether these broad features are quasi-maser/quasi-thermal emission, or due to blending of a number of weaker narrow maser features (since the Mopra spectra almost certainly include multiple class I maser spots blended within the beam, multiple weak masers at different velocities could in aggregate produce some of the broad emission features seen). However broad, quasi-thermal like spectral profiles are commonly observed in class I methanol masers (see for example Kurtz et al. 2004, or Voronkov et al. 2006). The majority of the broad emission in these sources when observed interferometrically is observed to be maser emission. Thus, although we cannot conclusively rule out the possibility that some of the sources may have thermal emission contributions, comparison with previous observations makes us very confident that the majority of the broad emission is maser emission. Moreover some of the EGOs with previous 44 GHz maser detections (Kurtz et al. 2004; Cyganowski et al. 2009) also show similar broad emission profiles at 44 GHz (for Cyganowski et al. 2009, the 44 GHz maser spectra were not directly presented, but they can be determined from the fitted intensities of the 44 GHz emission listed in Table 8 of their work). The similar broad emission features from class I methanol masers associated with EGOs are also detected and spatially unresolved in 44 GHz VLA observations (Kurtz et al. 2004; Cyganowski et al. 2009), which suggests that they are generally masers. It has yet to be confirmed through interferometric observations that the broad 95 GHz spectral features are also maser emission, although given the results of numerous past interferometric observations of class I masers this appears likely for the majority.
We also checked the flux densities of 44 GHz maser emission for the 13 EGOs which were observed as 95 GHz masers in our Mopra survey, and found that the peak flux densities of the 44 GHz masers are typically 2-3 times stronger than that of 95 GHz masers, consistent with the statistical result from Val’tts et al. (2000). However the primary beam of the VLA (1 at 44 GHz) is larger than that of Mopra (36 at 95 GHz). Thus the detection of stronger 44 GHz emission may be because for some sources with extended maser emission the VLA can detect additional maser emission which is within the VLA primary beam, but outside the Mopra beam (see Cyganowski et al. 2009). To account for this potential affect, we compared only the 8 sources with all 44 GHz maser emission detected by the VLA locating in a compact region and within Mopra beam. We found that the peak flux densities of 44 GHz emission are still 2-3 times stronger than that of 95 GHz emission for these sources.
In Table 3 we also list the distance and the integrated maser luminosity of each of the 105 detected methanol maser sources. The distance was estimated from the Galactic rotation curve of Reid et al. (2009), with the Galactic constants, R⊙= 8.4 kpc and = 254 km s-1. Class I masers are generally found near the VLSR as measured from the thermal gas (e.g. Cyganowski et al. 2009). We adopted the velocity of the brightest feature in the 95 GHz maser spectrum (listed in column 3 of Table 2) in the distance calculation. The near kinematic distance was adopted for sources with a near/far distance ambiguity. Given that EGOs are by definition extended sources, there will be bias towards nearby sources in their identification and also the nearby sources will be brighter and easier to detect. Another argument for EGOs being more likely at the near kinematic distance is their associations with IRDCs, because the identification of IRDCs is greatly biased toward the near kinematic distance (see Jackson et al. 2008). Thus the near distances adopted for these sources are likely to be more reasonable for most sources. The distances to G49.07-0.33, G309.91+0.32, G310.15+0.76 which could not be derived from the Galactic rotation curve were assumed to be 5 kpc.
3.2 Detection Rates
The results of our single-dish survey prove that there is indeed a high detection rate (55%) of class I methanol masers towards EGOs. It expands the number of published class I methanol masers by about 50% (an additional 92 on top of the 198 listed by Val’tts et al. 2010). However given the large beam size of Mopra and clustered massive star formation, a detection in a pointing towards an EGO does not necessarily mean that the detected class I maser is truly associated with the EGO, though recent VLA observations towards 20 EGOs reported by Cyganowski et al. (2009) revealed that nearly all 44 GHz class I masers trace the diffuse green 4.5 m features of EGOs except for one case (G28.28-0.36). If this is true of the sample as a whole then it suggests that the false association rate between EGOs and detected class I masers is likely to be very low with a range of a few to (at most) 10%. Where there were multiple EGOs included in the large beam of Mopra, we pointed at the position of the EGO classified as a “likely” outflow source, or where there were two such sources, at the position with the largest 4.5 m flux density (see Section 2.1). It is not clear which of the EGOs (all, or only one) included in such observations are associated with the detected maser emission. Thus it requires further high resolution observations toward the detected class I masers to determine whether they are truly physical associations with EGOs or which EGOs are associated with them. In subsequent analysis, we have assumed that the detected maser emission is associated with the EGOs used as the targeted point.
The detection rate of 55% achieved in this survey is slightly lower than the predicted value of 67% from our previous statistical analysis (Chen et al. 2009). One possible reason for this is that our previous analysis combined 44 and 95 GHz class I maser searches, and emission from the 44 GHz transition is generally 3 times stronger than that at 95 GHz (Val’tts et al. 2000). Thus it may be possible to detect a significant number of additional sources if we were to make a search with similar or better sensitivity at 44 GHz. To test this conjecture, we checked all 20 EGOs with detected 44 GHz masers in previous surveys (Kurtz 2004 and Cyganowski et al. 2009), and found that only 13 EGOs have detected 95 GHz emission at our Mopra survey sensitivity of 2 Jy (i.e. the detection rate of 95 GHz methanol masers in these EGOs is 13/2065%). All the remaining 7 EGOs detected at 44 GHz for which we did not detect 95 GHz emission have peak flux densities of less than 6 Jy for the 44 GHz masers. This is consistent with our expectation that these 7 EGOs might not be detected class I masers with the current detection limit (corresponding to 6 Jy at 44 GHz when considering the 44/95 GHz correlation from Val’tts et al. 2000). If we extrapolate this result to our survey it suggests that we have detected around 2/3 of the true number of class I maser sources in our search. If this were correct then our detection rate would be well in excess of the prediction of Chen et al. (2009). This extrapolation naively ignores the likely presence of selection biases in the VLA comparison sample and the effect of the different primary beam of the VLA and Mopra as stated above, but these are not readily assessed. The true rate of association of class I methanol masers with EGOs can perhaps only be accurately determined through targeted sensitive 44 GHz observations towards the non-detected sources from this survey.
3.3 Associations with Class II Methanol Masers
Table 1 gives information on the association between EGOs and class II methanol masers. For those sources in the Galactic longitude range covered by sections of the MMB survey published to date (Caswell et al. 2010; Green et al. 2010), or other similarly sensitive observations (Caswell 2009, Cyganowski et al. 2009, Xu et al. 2009) we have used that data. For the remaining EGOs we have made additional 6.7 GHz observations with the Mt Pleasant 26m telescope. The Mt Pleasant observations will be described in detail in a separate publication, but the basic characteristics are summarised here. At a frequency of 6.7 GHz the Mt Pleasant 26m telescope has a 7 beam FHWM and a system equivalent flux density (SEFD) of around 800 Jy in each of two orthogonal circular polarizations. The correlator was configured with 4 MHz bandwidth and 4096 spectral channels for each circular polarization yielding a velocity range for the observations of approximately 180 km s-1 and a velocity resolution (after Hanning smoothing) of 0.09 km s-1. Observations were made using 10 minute integrations towards each EGO target position observed at 95 GHz and the 3 detection limit of the observations is around 1.5 Jy, comparable to that achieved for the 95 GHz Mopra search. Although it is possible that some of the EGOs not detected in the Mt Pleasant observations may have a weak associated 6.7 GHz maser, this is likely to effect only a small number of sources. From comparison with the MMB observations we estimate this to be less than 10% of non-detections. While the class II methanol maser data used in our comparison with the class I masers are not derived from a homogeneous set of observations, their relative sensitivities differ only by approximately a factor of 2 and are unlikely to introduce significant additional uncertainty into our statistical analysis.
We have compared the cataloged EGOs with the subset of class II methanol masers for which accurate positions have been published (see Section 2.1). Of the 192 cataloged EGOs, 49 are found to be associated with class II masers and 81 were not. The results for the EGOs which are not associated with class II masers were primarily determined from the surveys for 6.7 GHz methanol masers with the Mt Pleasant 26m (see above). The remaining 62 EGOs were detected 6.7 GHz methanol masers by the Mt Pleasant 26m telescope, but lack a high-precision position, thus we consider them as sources for which we have “no” information with respect to the class II masers in our work. Among the 105 EGOs with detected class I methanol masers, we found that 39 EGOs are, and 31 EGOs are not associated with class II methanol masers, respectively. For the other 35 EGOs we have insufficient information on the class II masers due to the lack accurate position observations of the class II masers for these sources. The sources associated with only class I methanol masers, but without class II methanol masers are especially important for our understanding of the properties of class I methanol masers, because most previous class I methanol maser surveys were targeted towards known class II methanol masers. We have undertaken further analysis and discussion of this issue in Section 4.2.
On the basis of one of the earliest class I methanol maser searches to detect a large number of sources, Slysh et al. (1994) suggested that there exists an anti-correlation between the flux densities of class I and class II methanol masers towards the same sources. Ellingsen (2005) further investigated this finding for a sample of class I methanol masers detected towards a statistically complete sample of class II masers and in that case found no evidence for an anticorrelation. We have also compared the peak flux densities of class I and class II methanol masers in 39 sources associated with both class masers. The peak flux densities of the class II masers are from interferometric studies (Cyganowski et al. 2009; Caswell 2009; Xu et al. 2009; Caswell et al. 2010; Green et al. 2010). The logarithms of the peak flux densities of class I masers vs. that of class II masers are shown in Figure 3. From this figure it can be seen that there is no statistically significant correlation (or anticorrelation) between the flux densities of class I and class II methanol masers in our observed EGO sample, consistent with the result of Ellingsen (2005). The flux densities of the class II methanol masers used in our comparison were all obtained from interferometric studies, whereas the previous comparisons of Slysh et al. (1994) and Ellingsen (2005) used single-dish data. However, the class II methanol maser emission is usually distributed over a compact region typical 0.2′′ and are not resolved by connected element interferometry (e.g. the VLA). This means that their flux density is the same in interferometric and single dish studies and hence this difference produces no new or additional biases to our statistical comparison.
3.4 Associations of Class I methanol masers with other star formation tracers
In this section, we compare the detection rates of class I methanol masers in different subsamples, including “likely” and “possible” outflow candidates, IRDC and non-IRDC, those associated with class II methanol masers, OH masers, and UC Hii region subsamples, etc. In order to more clearly compare the various samples we have listed the information relating to the class I methanol maser detections for all 192 sample sources in the last column of Table 1. The detection rates for each of the different categories are summarized in Table 5. It should be remembered that the detection rate in some categories will be affected by the limitations of single dish surveys with a large beam size and the clustering which occurs in high-mass star formation regions (as described in Section 3.1).
A total of fifty three 95 GHz methanol masers were detected towards the 86 likely outflow sources targeted by our observations. The 53 detections include 40, 10 and 2 sources from Tables 1, 2 and 5 of Cyganowski et al. (2008), respectively, and also IRDC 18223-3. This corresponds to a detection rate of 62% for the “likely” outflow sources. The remaining 52 class I masers detections were made towards the 106 “possible” outflow candidate EGOs observed. For the possible outflow sources, 27 and 25 were from Tables 3 and 4 of Cyganowski et al. (2008), respectively. This corresponds to a detection rate of 49%. A z-test finds that the difference in these detection rates is significant at the 90% level (i.e. it is marginally significant). Regardless of this, it is apparent that the detection rate of class I methanol masers in the “likely” outflow subsample is only slightly higher than that in the “possible” outflow subsample. This suggests that the class I methanol maser emission may be not very sensitive to the outflow classifications (i.e. “likely” and “possible”) seen from the IRAC images. Alternatively, if we assume that our finding for “likely” outflow sources is the true rate of association between EGOs and class I methanol masers then this suggests that approximately 49/62=79% of the “possible” outflow candidates are indeed outflow sources.
Dividing our sample of EGOs searched for class I methanol masers on the basis of their association (or otherwise) with IRDCs, we found that 71 of the 128 EGOs associated with an IRDC exhibit class I methanol maser emission (a detection rate of 55%). Whereas, 34 of the 64 EGOs without an IRDC were detected as class I methanol maser sources (a detection rate of 53%). IRDCs are generally thought to host an early stage of the high-mass star formation process, so it is somewhat surprising that our results show no difference between the detection rate of class I methanol maser in those EGOs which are and are not associated with an IRDC. The visibility of an IRDC is dependent on both the strength of the mid-infrared background emission and the amount of foreground emission, particularly at 8 m (Cyganowski et al. 2008; Peretto & Fuller 2009). If there is no, or weak 8 m background emission in a particular region, an IRDC may not be apparent even where dense molecular gas and very young MYSOs are present. Moreover, MYSOs and YSOs of a range of masses and evolutionary states are also found in IRDCs (e.g. Pillai et al. 2006; Ragan et al. 2009; Rathborne et al. 2010). So sources not associated with IRDCs do not necessarily host a later evolutionary stage than those which are.
Our target EGO sample included 49 sources associated with known class II methanol masers for which the position is accurately known and 81 sources which have been searched for class II methanol maser emission with no detection by the Mt Pleasant 26 m telescope (see Table 1 and Section 3.2). We found that 39 of the 49 sources associated with class II methanol masers were detected in the 95 GHz class I methanol transition. Thus there is a very high detection rate ( 80%) of class I methanol masers towards EGOs which are also associated with class II methanol masers, which is somewhat lower than the 89% reported by Cyganowski et al 2009, but likely not significant given the sensitivity differences between the observations. In comparison only 31 of the 81 sources not associated with a class II methanol maser were found to have an associated 95 GHz class I methanol maser (a detection rate of 38%). A more in-depth discussion about the lower detection rate of class I methanol masers towards those EGOs without an associated class II methanol maser and the evolutionary relationship between class I and class II methanol masers is given in Section 4.2.
Comparing the positions of the EGOs we observed with the spatial region of the Parkes/ATCA 1665/1667 MHz OH maser survey (see Table 2) (Caswell 1998), we found that there were 104 targeted EGO sources within the survey area of the Parkes OH maser survey. Amongst these, 14 EGOs were, and 90 EGOs were not associated an OH masers. Nearly all (13 of 14) of the EGOs associated with an OH maser, while approximately one-half (43 of 90) of the sources not associated with an OH maser were found to have a class I methanol maser.
We also note that there is a very high detection rate (11/13=85%) of class I methanol masers towards those EGOs which are associated with an UC Hii region. For most EGOs no deep centimeter continuum data is available. There are two Hii region survey datasets that we have used to compile a category of “without associated UC Hii region” for comparison. The survey of Becker et al. (1994) covered the region of and (see Table 2). The other observations are those by Cyganowski et al. (2009) towards 20 EGOs in the northern hemisphere, who found that no 44 GHz continuum emission was detected toward 95% of their surveyed EGO sample. Using the published data from these two sets of observations, we compiled a sample of 34 EGOs that are not associated with an UC Hii region. From this sample, 21 sources were found to have an associated class I maser. Thus the detection rate of class I masers of 21/34=62% towards EGOs without associated UC Hii regions is lower than that in sources which are associated with UC Hii regions. The size of the subsample associated with UC Hii regions used in our statistical analysis is small, and they may be biased since many of the large-scale UC Hii region surveys cited were targeted based on IRAS colors. In addition, high-mass star formation usually occurs in a cluster environment, so for an EGO associated with an UC HII region, it is not clear a priori whether the 4.5 m outflow is driven by the UC Hii region or by another (potentially lower-mass or less evolved) source in a (proto)cluster. However, given that UC ii regions are relatively rare towards EGOs, the high detection rate of class I methanol masers in those few sources where they have been observed to date is suggestive.
There are 63 EGOs which fall within the 1.1 mm BGPS survey area (Rosolowsky et al. 2010). Fifty four of these are associated with BGPS sources within 30′′, and 9 are not (see Table 2). We find that the detection rate of class I maser in the EGOs with an associated BGPS source (35/54=65%) is higher than that in those without an associated BGPS source (1/9=11%; only one EGO G34.39+0.22 in this category was detected to have class I maser emission). Conversely, all class I maser sources except G34.39+0.22 which fall within the BGPS survey region have an associated 1.1 mm BGPS source.
4 Discussion
4.1 The mid-IR colors of the class I methanol masers
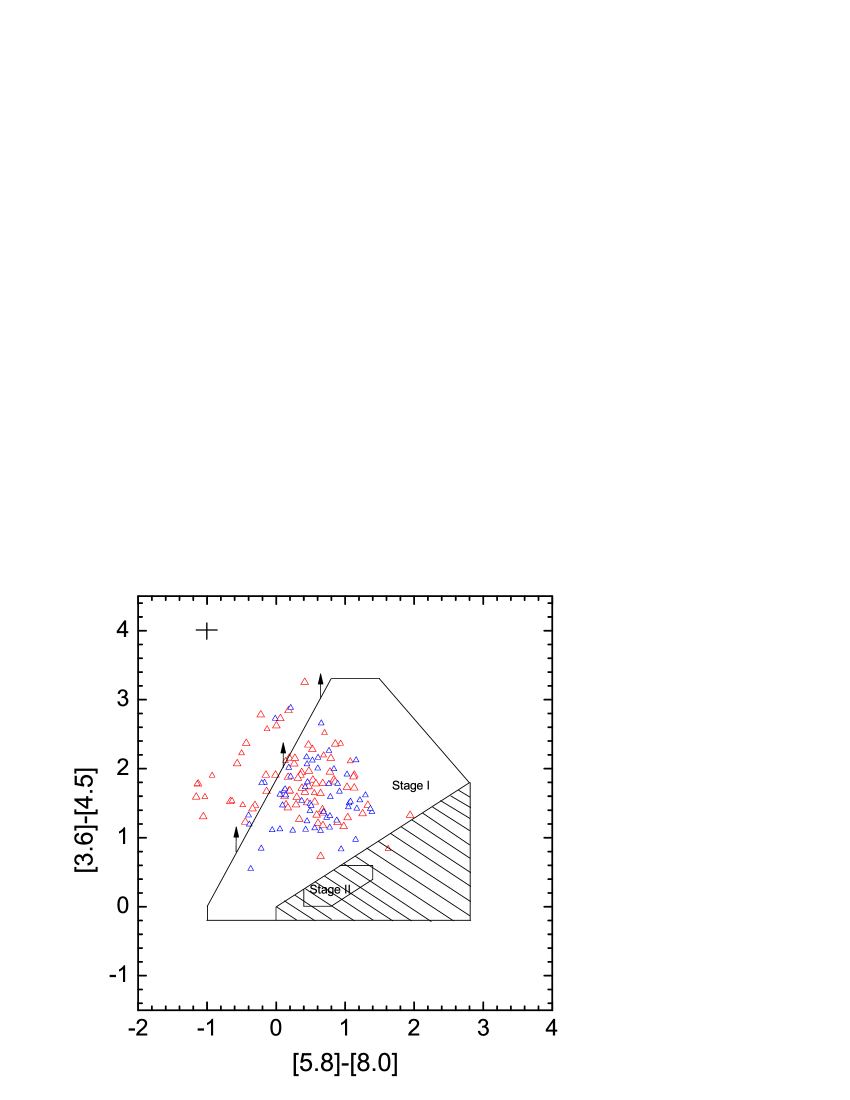
Based on their mid-IR colors ([3.6]-[5.8] versus [8.0]-[24]), Cyganowski et al. (2008) have suggested that most EGOs fall in the region of color-color space occupied by the youngest MYSOs and are surrounded by substantial accreting envelopes (see Figure 13 in their work). We have performed additional color-color analysis for EGOs to further investigate the distinguishing mid-IR properties of EGOs with and without an associated class I methanol masers. Our mid-IR color analysis includes the 192 EGOs targeted for our class I maser observations and an additional 51 EGOs that are listed in our previous work (Chen et al. 2009), but were not observed in our Mopra survey. We list the information (including their associations with class I masers and high-precision position class II masers) of these 51 EGOs in Table 6. There are 6 EGOs without 95 GHz class I maser information listed in this table since they were omitted in our Mopra survey (see also Section 2.1). Adopting the integrated mid-IR flux densities in the four IRAC bands presented in Tables 1 and 3 of Cyganowski et al. (2008), we have plotted a diagram of the [3.6]-[4.5] versus [5.8]-[8.0] colors of these selected EGOs in Figure 4 (note that we do not consider the flux density limitation on each IRAC band denoted by column 12 of Tables 1 and 3 of Cyganowski et al. in our analysis). In total, 81 and 58 EGOs with and without an associated class I methanol maser (see Tables 1 and 6) are shown in this figure represented by red and blue triangles, respectively. The regions of color-color space for sources at different evolutionary Stages I, II and III, derived from the 2D radiative transfer model by Robitaille et al. (2006) are also marked in Figure 4. We found that most EGOs fall in the region occupied by the youngest protostar models (Stage I), consistent with the conclusions from Cyganowski et al. (2008). There is significant overlap in colors between sources with and without class I methanol masers. Figure 4 also shows that many EGOs lie in the upper-left of the color-color diagram, and outside the Stage I evolutionary zone. One possible reason for this is that the colors of these sources are effected by reddening. The reddening vector for Av20 derived from the Indebetouw et al. (2005) extinction law is shown in Figure 4. An A80 can produce reddening of approximately 1.4 mag in the [3.6]-[4.5] color, which would be sufficient to return most of these source to the Stage I region. However, such a large extinction value Av80 is of dubious plausibility, since the path to the Galactic center has a total Av25 (Indebetouw et al. 2005). Another possibility is that because the mid-IR flux density measurements were determined from an extended region (i.e. extended green region), with a typical scale of a few to 30′′, they may include emission from many GLIMPSE point sources which are not physically associated with the EGO, shifting the colors for some sources outside the Stage I region. Moreover the integrated fluxes likely include emission mechanisms (H2 and PAH line emission in particular) which were not included in the Robitaille et al. models. This also may result in some sources with extended 4.5 m and PAH emission lying outside the Stage I region.
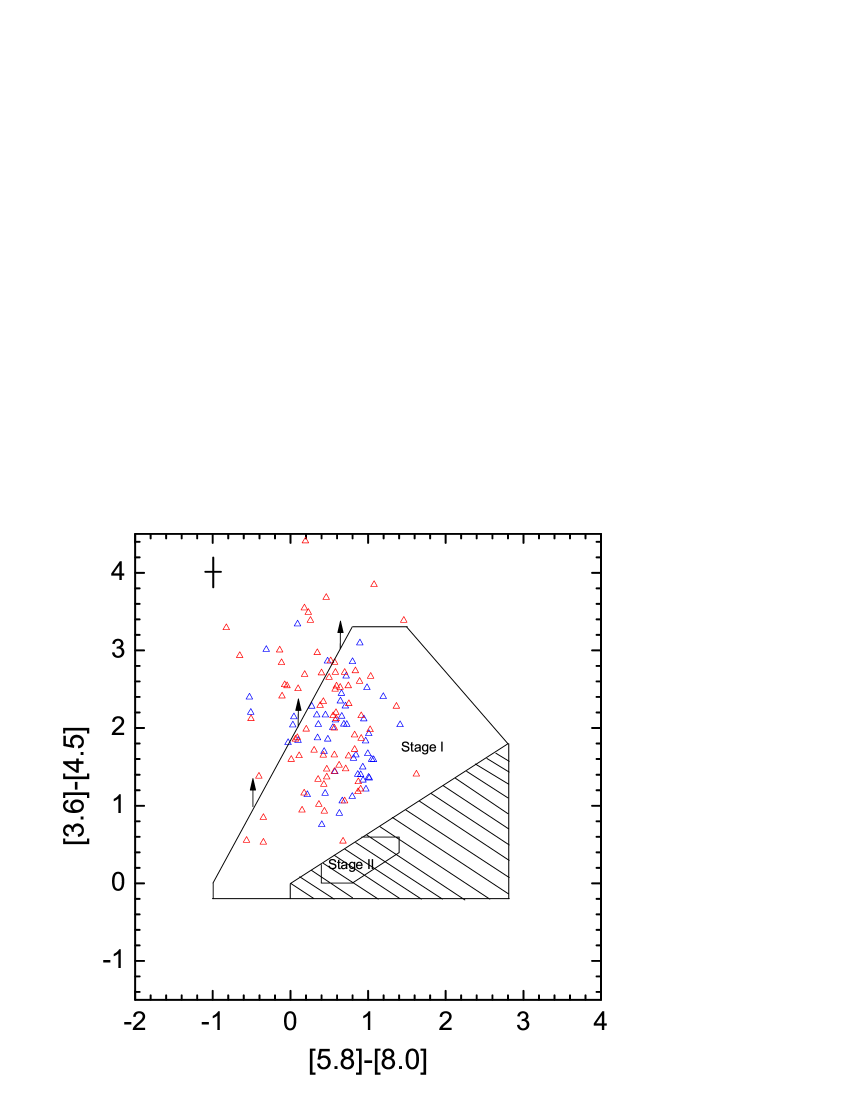
We have also undertaken additional similar color-color analysis using flux measurements for all EGOs extract from the highly reliable GLIMPSE point source catalog (rather than the less reliable GLIMPSE point source archive). This analysis may allow us to determine whether it is possible to refine the criteria for targeting class I methanol masers using mid-IR colors of GLIMPSE point sources, similar to the analysis undertaken by Ellingsen (2006) for class II methanol masers. The sample includes the 192 EGOs in the current Mopra observations and an additional 51 EGOs listed in our previous work (Chen et al. 2009). Although EGOs are by definition extended objects, the GLIMPSE point catalog allows us to study the characteristics of the possible driving source of the EGOs and class I methanol masers. To decrease the contamination of our investigation of the EGO driving sources from chance associations, we assumed that the driving source is the closest point source to the cataloged EGO position (within 5), with flux measurements in all four IRAC bands. Using these criteria we identified the assumed driving GLIMPSE point sources for 126 EGOs (including 74 associated with detected class I methanol masers and 52 without class I methanol masers; see Tables 1 and 6). In Figure 5 we have marked these closest associated GLIMPSE point sources using red and blue triangles for EGOs which are and are not with associated class I methanol masers respectively. Examination of Figure 5 clearly shows that the GLIMPSE point sources which lie closest to the EGOs are predominantly inside the color-color region representative of Robitaille et al. evolutionary Stage I. Qualitatively Figures 4 and 5 show similar color-color distributions, except perhaps for a greater spread in the [3.6]-[4.5] color for the point source data compared to the integrated fluxes. We have used the sample of 126 GLIMPSE point sources identified in the manner outlined above to perform our subsequent color-color analysis for EGOs with/without class I methanol masers. It is almost certain that there are some false associations between the GLIMPSE point sources assumed to be the driving sources and the true driving sources of the EGOs. For example, in some cases the true driving sources for EGOs may not appear in the GLIMPSE point source catalog, either due to saturation, the presence of bright diffuse emission (which limits point source extraction), or inherently extended morphology in the IRAC bands with the IRAC resolution, e.g. due to extended PAH emission or extended H2 emission from outflows (see Robitaille et al. 2008, Povich et al. 2009, and Povich & Whitney 2010). Moreover the EGO position cataloged by Cyganowski et al. (2008) adopted the position of the brightest 4.5 m emission within the extended region of the EGO, but it is not clear that the brightest 4.5 m emission associated with an EGO must necessarily lie close to the driving source. However, given the extended nature of EGOs such identifications will always be somewhat problematic. The presence of false associations will add confusion to attempts to identify any color-color differences between EGOs with and without class I methanol masers; however, provided the mis-identification rate is not too large (it is not possible to make a quantitative estimate for this at present) it is unlikely to mask the difference completely, if it is present.
We find that the color-color regions occupied by GLIMPSE point sources which are and are not associated with class I methanol masers are not significantly different. For both groups they predominantly lie in a box region -0.6[5.8]-[8.0]1.4 and 0.5[3.6]-[4.5]4.0. This color-color region is very similar to that occupied by 6.7 GHz class II methanol masers identified by Ellingsen (2006). But interestingly, we note that the class I methanol masers extend to smaller [3.6]-[4.5] colors than do the class II methanol masers for which the [3.6]-[4.5] color is usually greater than 1.3.
Similar to what is seen in Figure 4, Figure 5 shows that many GLIMPSE point sources which are closest to an EGO lie in the upper-left of the color-color diagram, and outside the Stage I evolutionary zone derived from 2D radiative transfer models (Robitaille et al. 2006). Some of the GLIMPSE point sources have redder [3.6]-[4.5] colors (3), compared to those seen in Figure 4 which typically have [3.6]-[4.5] 3. As discussed above, these sources may be those which suffer larger reddening, however it requires extreme extinction (A) to produce such large color shifts (2) in [3.6]-[4.5]. The typical Av of an IRDC simply estimated from the parameters provide by Peretto & Fuller (2009) is 25 (here we adopted an average optical depth at 8 m of 1.15 for IRDCs, and A8μm/Av=0.045 from that work). Since most EGOs are associated with IRDCs (Cyganowski et al. 2008), this shows that typical Av for IRDCs can not account for the entirety of redder colors of these sources. From our calculations of Av for the 1.1 mm BGPS sources associated with EGOs which have class I maser detections (see Table 7, with more details described in Section 4.3), the estimated Av of the 1.1 mm clumps associated with EGOs outside stage I region ranges from 10 to 40 (with an average of 20), similar to that for sources inside the Stage I region which range from 5 to 50 (with an average of 23). This also suggests that the reddening does not play an important role in explaining the redder colors of these sources. Another possible reason for this is that the GLIMPSE point source photometry (similar to the integrated flux measurements discussed above) may be affected by contributions from extended H2 emission, while the classifications of Stage I-III by Robitaille et al. (2006) did not consider these emission mechanisms. The EGOs associated with GLIMPSE point sources outside Stage I region have a significantly higher detection rate for class I methanol masers (21/28=75%; see Tables 1 and 6) than that observed in the full sample (55%). We have also checked the masses of 1.1 mm BGPS sources associated with EGOs which have class I methanol maser detections (see Table 7, and the additional details described in Section 4.3), and found that the mass range of the BGPS sources associated EGOs outside stage I region (covering the range 1000-6000 M⊙ with an average of 2500 M⊙) is significant higher than those associated with EGOs in Stage I region (73-2000 M⊙, with an average of 1200 M⊙). Thus they may correspond to MYSOs with an extremely high mass envelope which is more deeply embedded causing redder colors. Moreover, the detection rate of class I methanol maser in EGOs tends to be higher (30/40=75%) in the color-color region with [3.6]-[4.5] 2.4. Given that EGOs are identified and defined by their excess 4.5 m emission, the high detection rate of class I masers towards EGOs that fall in the left-upper regions make sense if the excess 4.5 m emission is due to shocked H2 in outflows, and so sources in the left-upper region may have particularly strong/active outflows which can readily produce maser emission. This suggests that GLIMPSE point sources with redder [3.6]-[4.5] color are the best target population for class I methanol maser searches. However, the small number (30) of class I methanol maser and small number (40) of GLIMPSE point sources in this region of color space should be taken into account when drawing any conclusions.
4.2 An evolutionary sequence for class I and II masers
Ellingsen et al. (2007) suggested that the common maser species (class I and II methanol, water, and OH masers) may help identify the evolutionary phase of a high-mass star, and proposed a possible evolutionary sequence for these common maser species. This proposed sequence has recently been refined and quantified by Breen et al. (2010a) in their Figure 6. However, there remains significant uncertainty about where within star formation regions the different maser species arise and the evolutionary phase they are associated with. In this work, we focus on the evolutionary sequence for class I and II methanol masers. In previous work, one of the main difficulties in determining the relative evolutionary sequence for class I and II masers has been the lack of a large sample of sources associated with class I masers but not class II masers. Ellingsen (2006) investigated the mid-IR colors of the associated GLIMPSE point sources for a relatively small sample of class II methanol masers associated with and without class I methanol masers numbering 10 for each group, and found there is a tendency for the sources with an associated class I methanol maser to have redder GLIMPSE colors than those without class I methanol masers. Based on the assumption that the redder colors are associated with more deeply embedded and hence youngest stellar objects, Ellingsen (2006) suggested that some class I methanol masers may precede the earliest class II methanol maser evolutionary stage. However, the absence of a comparison sample of class I methanol masers with no associated class II methanol masers presents a significant limitation to the Ellingsen (2006) work. Our class I methanol maser survey towards EGOs has identified 31 sources which are associated with class I, but not class II, methanol masers.
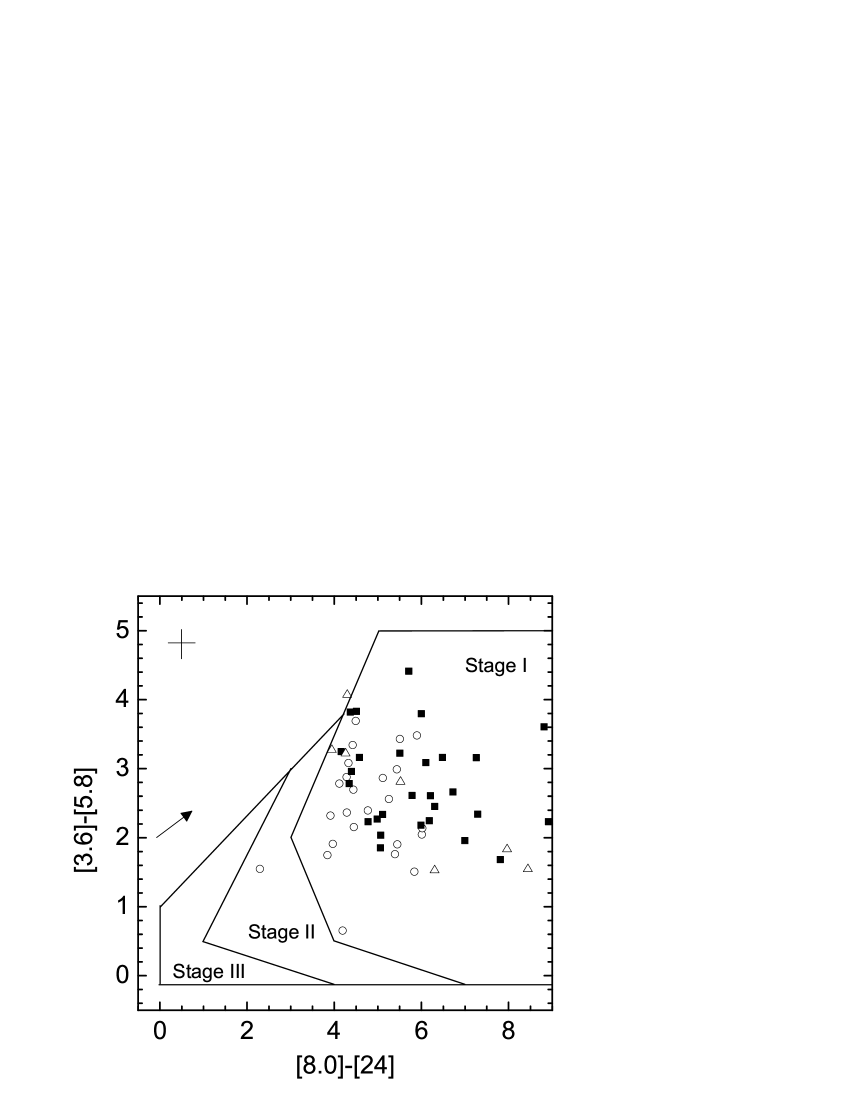
To test the proposed evolutionary scenario for class I and II methanol masers, the EGOs were split into three subsamples on the basis of which class methanol masers they were associated with (see Tables 1 and 6): 1) associated only with class I methanol masers (32 members in total; 31 from our surveyed sample and 1 from Chen et al. 2009 sample); 2) associated only with class II methanol masers (20 members in total; 10 from our surveyed sample and 10 from Chen et al. 2009); 3) associated with both class I and class II methanol masers (72 members in total; 39 from our surveyed sample and 32 from Chen et al. 2009). In compiling the second and third subsamples we only considered sources for which the position of the class II maser emission is known to high accuracy (i.e. the sources with class II methanol maser information marked by “Y” in Tables 1 and 6). IRAC and Multiband Imaging Photometer for Spitzer (MIPS) 24 m colors provide a diagnosis for YSO evolutionary state (Robitaille et al. 2006). We plot [3.6]-[5.8] versus [8.0]-[24] color diagram using the flux measurements from Tables 1 and 3 of Cyganowski et al. (2008) for the above three subsamples (note that we do not consider the flux density limitations on the IRAC and MIPS bands in this plot) in Figure 6 with different symbols. The regions of color-color space for sources at different evolutionary stages I, II and III derived from Robitaille et al. (2006) are also marked in Figure 6. In total, we have 26 EGOs containing both class I and II methanol masers, 7 EGOs associated with only class II methanol masers and 25 EGOs associated with only class I methanol masers in this figure. Comparing the color distributions of these three subsamples with the color-color space occupied by the evolutionary stages derived from Robitaille et al. (2006), we find that all class II maser EGOs (including both class I and II maser subsample and the only class II maser subsample) are located in the region of Stage I, i.e. the easiest evolutionary stage, while all but one class I maser only EGOs are also located in the Stage I region (the exception is G317.88-0.25 which lies in Stage II). However, as seen in Figure 6, despite the significant overlap of the various subsamples, EGOs which are associated with only class I methanol masers extend to less red colors than those associated with only class II methanol masers and both class I and II methanol masers.
Here we propose a number of possible explanations as to why the mid-IR sources associated with only class I methanol masers have less red colors than those associated with class II methanol masers:
1. The EGOs associated with only class I maser are less heavily extincted than those associated with class II masers.
2. The stellar mass range of objects with associated class I methanol masers extends to lower masses than that of objects with class II methanol masers. The lower mass sources may be generally less deeply embedded and hence have a less red colors, than the higher mass objects.
3. There may be two epochs of class I methanol maser emission associated with high-mass star formation. An early epoch which overlaps significantly with the class II methanol maser phase and a second phase which occurs after class II methanol maser emission has ceased.
The first possibility is supported by the evidence that the mid-IR color differences among the three subsamples shown in Figure 6 are mostly along the direction of the reddening vector. But it needs a very large Av to produce the color shifts observed between the EGOs associated with only class I masers and those associated with class II masers (e.g. A80 corresponds to a color shift of 3 in [8.0]-[24]). Even though at present we can not accurately determine Av for our full sample sources, as discussed in Secion 4.1 from estimations of Av for a few sources associated with 1.1 mm BGPS listed in Table 7 and the typical Av for IRDCs which are often associated with EGOs, it appears that reddening alone is unlikely to be responsible for the observed color differences among the three subsamples.
The second possibility is also consistent with other recent observations of class I methanol masers. Class I methanol masers are known to be associated with some regions that are forming only low-mass stars (Kalenskii et al. 2006, 2010). This suggests that class I methanol masers can be associated with lower stellar mass sources than class II methanol masers and hence supports this possibility. To further test this we have compared the detected 95 GHz class I maser luminosity distributions of four subsamples. The subsamples of class I masers are (a) those not associated with class II masers; (b) those associated with class II masers for which an accurate position has been measured; (c) those associated with an UC Hii and (d) those associated with an OH maser. The distribution of the 95 GHz class I maser luminosity for each of these subsamples is shown in Figure 7. This shows that most (25/3180%) of the sources which are not associated with class II methanol masers are located in the lowest luminosity bin (less than 510-6 L⊙); whereas those associated with class II masers, UC Hii regions and OH masers have a relatively small fraction (typically 40%) in this lowest luminosity bin. One explanation for the observed distributions is that class I masers can be associated with lower stellar mass sources than class II masers or the other two tracers (OH and UC Hii), since class I maser excited by outflows from low stars are expected to be less luminous. Recalling Section 3.3, the detection rate of class I methanol masers in the sources without an associated class II maser (37%) is lower than that in the sources with an associated class II maser (80%). This statistical result also seems to support the hypothesis that class I methanol masers can extend lower stellar mass sources since less luminous class I masers excited from lower mass stars are harder to detect with the same sensitivity. This hypothesis is also supported by our further analysis of the relationship between class I methanol masers and 1.1 mm BGPS sources (discussed in Section 4.3).
The last hypothesis is more speculative, as it requires the mechanism through which class I methanol masers are produced to be switched off and then at a later time on again. It is generally considered that sources with associated OH masers and UCHii regions lie towards the later evolutionary phases (Breen et al. 2010a). The very high rate of association we have found for class I methanol masers towards OH masers (93%; see Table 5) demonstrates that some class I methanol masers may be present at these later stages. However the current single dish survey with large beam size is not sufficient to argue that the driving source of OH maser is also responsible for exciting the class I maser emission. Further high-resolution observations are needed to definitively establish whether the class I masers are truly associated with the same MYSO as the OH masers, although the results of Cyganowski et al. (2009) suggests that most of the detected class I masers will be associated with the targeted EGOs. Recently Voronkov et al. (2010) presented new high resolution observations which strengthen the case that some class I methanol masers are produced in shocks driven into molecular clouds from expanding Hii regions. The 9.9 GHz class I methanol masers (detected towards 4 of 48 class I maser sources observed by Voronkov et al.), are all associated with relatively old sources, e.g. Hii regions and OH masers. They also tentatively report a detection rate of greater than 50% for 44 GHz class I methanol masers towards OH masers which are not associated with class II methanol masers. This indicates that the class I masers can extend beyond the time when class II masers are destroyed, and overlap well into the time when OH masers are active. Voronkov et al. suggest that these findings are consistent with the cloud-cloud collision hypothesis for class I methanol masers which has been realized in some sources (Sobolev 1992; Mehringer & Menten 1996; Salii, Sobolev & Kalinina 2002), but are in contrast with the generally held view of class I methanol masers derived from sources such as DR 21(OH) (Plambeck & Menten 1990) and G343.12-0.06 (Voronkov et al. 2006) where they are clearly associated with outflow-molecular cloud interaction regions.
Our findings and those reported by Voronkov et al. (2010) are inconsistent with some aspects of the evolutionary sequence presented by Breen et al. (2010a) which has both the appearance and disappearance of class I methanol masers preceding that of the class II methanol masers. Breen et al. also have no overlap between the class I methanol masers and OH maser stages. In our survey the EGOs which are associated with class I methanol masers, but not class II methanol masers are not found to be associated with any known published Hii regions or OH masers (actually there is absence of any systemic surveys of Hii regions or OH masers towards EGOs at present). This suggests that these class I methanol masers are likely to be excited by shocks driven from outflows, rather than in the shocks driven by expanding Hii regions at later evolutionary stage. However, the true nature of these class I only EGOs can only definitively be resolved by high resolution observations which can determine the location of the maser emission with respect to the EGOs. Because high-mass star formation regions are crowded and frequently contain objects at a range of evolutionary phases, chance associations are possible at low angular resolutions. Examination of the results of Cyganowski et al. (2009) for the source G28.28-0.36 illustrates how this can occur. For the majority of the EGOs imaged by Cyganowski et al. (2009) in the 6.7 GHz class II and 44 GHz class I methanol maser transitions, both types of masers are clearly associated with the targeted EGOs. However, in the case of G28.28-0.36, while the 6.7 GHz class II methanol masers are associated with the EGO, the class I masers are offset and clearly trace the interface between an Hii region and the surrounding molecular gas. With single dish spatial resolution both maser transitions and the EGO would be considered likely to be coincident, although with the benefit of high resolution data this is clearly not the case. This is only one object from 20 observed by Cyganowski et al., so it is not likely that all of the class I only EGO sources we have identified are chance detections unrelated to the EGO, however, it is possible that some may be.
The evolutionary scheme outlined by Ellingsen et al. (2007) and Breen et al. (2010a) assume that each maser species arises only once during the evolution of an individual massive star. However, it appears that this assumption may require revision for class I methanol masers. One possible manifestation of a two evolutionary phase scenario for class I methanol masers (as discussed above) would be that they initially arise at a relatively early phase of the star formation process when powerful outflows interact with surrounding molecular gas and that they are typically accompanied by class II maser emission during this phase (the birthplace (disk or outflow) of class II methanol masers remains uncertain, but at least in some sources 6.7 GHz class II methanol masers can be excited in the inner regions of outflows e.g. De Buizer 2003). As the source evolves and the outflows diminish the class I maser emission fades and ceases, but the class II maser emission continues, before it too fades rapidly soon after the creation of the UC Hii region. As the ionized bubble rapidly expands it creates a second phase of class I maser emission at the interface with the ambient molecular gas. Of course, there is the possibility that the lifetime of class I masers associated with outflows may also continue as far as the stage when Hii regions are detectable. Molecular line observations of several massive star-forming regions show evidence that outflows (and infall) can continue once ionization turns on, and an UC Hii region is formed (e.g. Keto & Klaassen 2008, Chen et al. 2010). However, high-mass star formation occurs in a cluster environment which may include sequential or triggered star formation, allowing a YSO associated with a well developed Hii region and a YSO associated with young outflow may coexist as near neighbours. The extended spatial distribution of class I masers compared to the other common maser species makes it more difficult to determine which object the emission is associated with, outflow or expanding Hii region or both astrophysical phenomena (particularly without high-resolution data). At present we cannot determine whether the class I methanol masers associated with outflows survive through to the stage when Hii region appear, although it appears possible from our results that this is the case.
At present we cannot confidently determine why the MIR colors of class I only sources extends to less red colors than those associated with class II masers. It seems unlikely to be purely the result of less reddening in these sources, but both association with lower mass stars and their being more than one epoch of class I maser emission remain plausible hypotheses. Further observations an millimetre and submillimetre wavelengths, combined with high resolution observations of the class I masers will be required to answer this question.
4.3 The properties of mm dust clumps associated with methanol masers
Table 1 shows that there are 63 EGOs in our observations which are within the 1.1 mm continuum BGPS surveyed area (Rosolowsky et al. 2010). Among them, 54 are associated with a 1.1 mm BGPS sources, while 9 are not (see also Table 2). A 1.1 mm BGPS source was considered to be associated with an EGO if the separation between the peak position of the BGPS source and the EGO position is less than 30′′. We did not take the size of the mm continuum source into account when cross-matching (see Section 2.1).
In the two-evolutionary phase hypothesis for class I methanol masers discussed in Section 4.2, we might expect similar trends to that seen in the Mid-IR colors (e.g. Figure 6) to be present in other physical tracers of the source evolution, such as the density of the associated gas and dust. For example, Breen et al. (2010a; 2010b) suggest that the density of the associated dust and gas decreases as the sources evolve for class II methanol masers and water masers. So in the two-evolutionary phase hypothesis we would predict class I methanol only sources should have a lower gas density than class II methanol maser only sources, which in turn would have a lower density than those sources with both class I and II methanol masers. To test this, we perform an investigation of the properties of 1.1 mm BGPS dust clumps associated with class I methanol masers in our surveyed sample and Chen et al. (2009) sample (37 sources in total). For each of the associated 1.1 mm BGPS source, we have assumed that the 1.1 mm emission detected toward EGOs is from optically thin dust. We can then calculate the gas mass using the equation:
| (1) |
where (int) is the 1.1 mm continuum integrated flux density, is the distance to the source, is the mass absorption coefficient per unit mass of dust, is the Planck function for a blackbody at temperature , and is the dust-to-gas mass ratio. Here we adopt 1 cm2 g-1 (Ossenkopf & Henning 1994) for 1.1 mm emission, and assume a dust-to-gas ratio () of 1:100. was derived for an assumed dust temperature of 20 K. The H2 column and volume densities of each dust clump were then derived from its mass and radius (Robj), assuming a spherical geometry and a mean mass per particle of mH, which takes into account a 10% contribution from helium (Faúndez et al. 2004). We list the parameters of the 1.1 mm continuum integrated flux density, (int) and 1.1 mm source radius, Robj obtained from the BGPS catalog (Rosolowsky et al. 2010) for all the 37 class I maser sources with an associated 1.1 mm BGPS source in Table 7. Dunham et al. (2010) suggested that a correction factor of 1.5 must be applied to the Rosolowsky et al. BGPS catalog flux densities. In this paper, we also apply this flux calibration correction factor to the integrated flux density (int) listed in Table 7. All the associated 1.1 mm BGPS sources are resolved with the BGPS beam, with the exception of G34.28+0.18. For this source we assumed half the beam size (17′′) as an upper limit for the object radius. Thus the derived gas density of this source should be seen as a lower limit. The masses and gas densities for all 1.1 mm dust clumps associated with class I methanol masers determined using the methods outlined above are listed in Table 7.
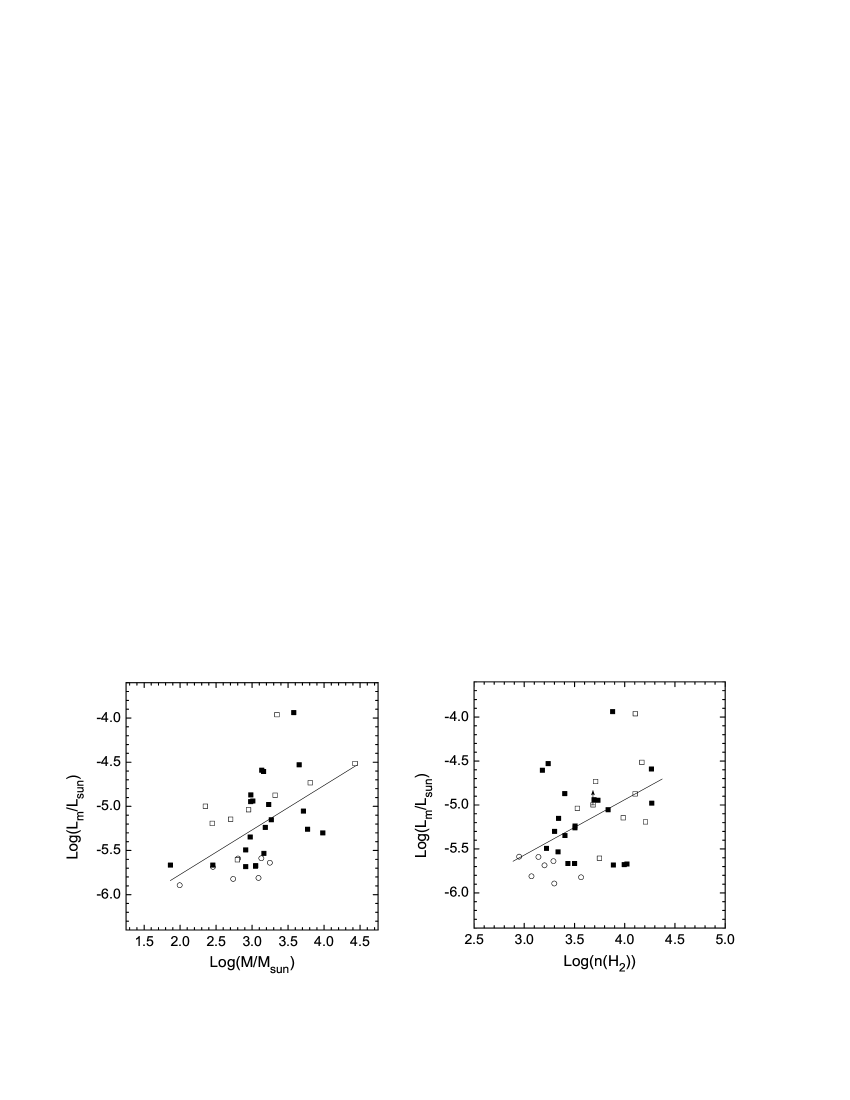
Figure 8 presents a log-log plot of the luminosity of the class I methanol maser emission versus of the gas mass (left panel) and H2 density (right panel) of the associated 1.1 mm dust clump. We have used different symbols in the plot to show whether the class I masers are associated with class II methanol masers or not (21 with associated high-precision position class II masers; 9 without high-precision position class II maser data; 7 without associated class II masers; see Table 7). Figure 8 shows that a weak, but statistically significant positive correlation exists in both cases. We have performed a linear regression analysis for each distribution, and plotted the relevant line of best fit in each panel in Figure 8. The best fit linear equation for each distribution is as follows:
log(Lm/Lsun)0.50[0.14]log(M/Msun)6.34[0.435]
(correlation coefficient of 0.60 and p-value of 8.75e-04) and,
log(Lm/Lsun)0.57[0.21]log(n(H2))7.25[0.75]
(correlation coefficient of 0.44 and p-value of 9e-03). These fits demonstrate that the luminosity of the class I methanol masers depends on the physical properties of the associated clump: the more massive and denser the clump, the stronger the class I methanol emission. We checked for correlations between the mass and density of clump with the distance, but found no significant correlation in either source property (mass or density) with distance. This suggests that the observed dependence between the 1.1 mm source properties and class I maser luminosity is intrinsic and not an observational artefact.
Interestingly, the dependence between the luminosity of class I methanol masers and the gas density of the associated mm dust clump is opposite to the relationship observed between the luminosity of class II methanol masers and the gas density of mm dust clump reported by Breen et al. (2010a). Breen et al. found the more luminous 6.7 GHz class II methanol masers to be associated with mm dust clumps with lower H2 density, i.e. there is a negative correlation between them. Even though their results were derived with the peak luminosity rather than integrated luminosity of class II methanol masers, the peak luminosity and integrated luminosity are positively correlated. The simplest picture which fits the different dependence between the luminosity of class I and class II methanol masers with the gas density of the clump, is if the intensity of class II methanol masers increases as the source evolves/warms, while the class I maser intensity decreases as the outflow broadens. If this is the case then we would expect to see an anti-correlation in the class I/II flux densities. However, comparing the peak flux density of class I and class II methanol masers for our observed EGO sample, we have already shown that there is no statistically significant correlation between them (see Figure 3).
We performed a similar analysis to that undertaken for the class I masers associated with EGOs to check the relationship between the peak luminosity of 6.7 GHz class II methanol maser and the gas mass/density of the associated dust clump for the 21 EGOs associated with both class I and II methanol masers (listed in Table 7). We also found that there is a significant positive correlation between the peak luminosity of the 6.7 GHz class II methanol maser and mass of the associated dust clump (a slope of 1.21 with a standard error of 0.32 and a p-value of 0.001 which allows us to reject the null hypothesis of zero slope). The correlation coefficient between the points was measured to be 0.66 for this linear regression analysis. But there is no statistical correlation between the peak luminosity of 6.7 GHz maser and the gas density (the linear regression analysis shows a slope of -0.38 with a large p-value of 0.57 and a small correlation coefficient of 0.15). The absence of correlation between the peak luminosity of 6.7 GHz masers and gas density measured in our analysis is not consistent with that of the anti-correlation between these quantities found by Breen et al. (2010a). However the sample size for this analysis is small and the class II masers are clustered in a small range of parameter space with lower gas density (log(n(H2))4), whereas the sample shown in Figure 2 of Breen et al. covers a much wider range of gas densities. Thus our class II maser sample is likely not representative of the larger population. The correlation between the class I maser luminosity and gas density is tighter than that measured for the 6.7 class II masers in our analysis. The most likely explanation for this is that the gas density of the clump is measured over a large spatial scale (the angular resolution of the observations was typically 30′′), which can not accurately reflect the properties of the smaller compact regions (of the order of 1′′) associated with class II methanol masers. In contrast the class I methanol maser spots usually have much larger angular and spatial distributions (usually at the order of 10′′) and are associated with shocked regions (e.g. Cyganowski et al. 2009). Thus we might expect that the gas densities derived from dust clumps should correlate more closely with class I methanol maser properties. The dependence of class I maser luminosity on clump properties makes sense if the class I masers are excited at the interface between outflows and surrounding material. Future arcsecond resolution mm continuum imaging of these sources will be necessary to determine if the relationship between the class II maser properties and the associated gas and dust is tighter when the spatial scales are comparable.
It is interesting to note that all of the sources associated with only class I methanol masers are located in the bottom-left corner of the right panel in Figure 8. This location corresponds to sources with a lower maser luminosity and lower density of the dust clump. The left panel of Figure 8 shows that median mass properties are also different between the population associated with only class I masers and that associated with both class I and II masers: the population associated with both class I and II masers can extend to higher clump masses than that associated with only class I masers. The most widely accepted mechanism for massive star formation suggests that high-mass sources are believed to originate from massive clumps in the fragmentation of the giant molecular cloud. The stellar mass of the sources is set by the fragmentation process and the reservoir of material available to accrete is determined by that as well (e.g. Hennebelle & Chabrier 2008). Therefore the measured distribution of 1.1 mm clump mass among different populations indicates that these class II methanol maser EGO sources may be associated with a higher stellar mass range than those where only class I methanol masers are also observed. However, it is also consistent with the predictions of the two-evolutionary phase hypothesis for the class I only sources as the density of the associated gas and dust decreases as the sources evolve (Breen et al. 2010a; 2010b). So in the two-evolutionary phase hypothesis the class I only sources (i.e. the later evolutionary sources) should have a lower density than sources with only class II masers or with both class I and II methanol masers (see the more detailed discussions of this in Section 4.2). The assumed constant dust temperature (Tdust) of 20 K in our calculations will affect the results. However if the sources which are thought to be more evolved (i.e. only class I maser sources) have a higher dust temperature, it would result in a larger , thus a smaller mass and lower density of dust clump associated with only class I masers. So this is also credible in the two-evolutionary phase hypothesis.
However it must be noted that only 7 of the 31 class I maser-only sources have estimates for the mass and density parameters from mm dust continuum observations. The small size of this sample means that it may not be representative of the entire population of class I maser-only EGOs. Moreover some sources associated with both class I and class II methanol masers also extend to the left-bottom corner of each panel in Figure 8. This suggests that a small fractional of the class II methanol maser population can also appear in an environment of comparable mass and dust clump density to that seen in the class I only associated EGOs. However, Figure 8 clearly shows that the class II methanol masers are usually associated with more massive and dense dust clumps than those associated with only class I methanol masers.
5 Conclusions
Using the Mopra telescope, we have performed a systematic search for 95 GHz class I methanol masers toward EGOs. EGOs are new MYSO candidates with ongoing outflows identified from the Spitzer GLIMPSE I survey. We detected 105 new 95 GHz masers from a sample of 192 targets. Of these, 92 have no previously observed class I methanol maser activity, while the remaining 13 sources have been detected in the 44 GHz transition. Thus our single-dish survey proves that there is indeed a high detection rate (55%) of class I methanol masers in EGOs. Our findings increase the number of published class I methanol masers to 290 (an additional 92 on top of the 198 from Val’tts & Larinov 2010). Mid-IR color analysis shows that the color-color region occupied by the GLIMPSE point sources for EGOs which are and are not associated with class I methanol masers are very similar, and mostly located in ranges -0.6[5.8]-[8.0]1.4 and 0.5[3.6]-[4.5]4.0 (see section 4.1 for detailed discussion of the uncertainties involved in this analysis). We find that the detection rate of class I methanol maser is likely to be higher in those sources with redder GLIMPSE point source colors.
Comparison of the [3.6]-[5.8] vs. [8.0]-[24] colors determined with integrated fluxes from Cyganowski et al. (2008) for the subsamples of the EGOs based on which class of methanol masers they are associated with, shows that those which are only associated class I methanol masers extend to less red colors than those associated with both classes of methanol maser. We suggest that the less red colors of class I methanol maser only EGOs is either because the class I only EGOs are associated with lower stellar mass objects, or because class I maser emission arises at more than one evolutionary phase of the high-mass star formation process. On the basis of current observations both scenarios can be plausibly argued and further observations will be required to determine which, if either of these hypotheses is correct. The thermal molecular line observations taken in conjunction with our maser search will be useful for trying to determine which of these scenarios is more likely. It will also be important to undertake high resolution observations of the class I maser emission in EGOs which are only associated with class I methanol masers to determine where the maser emission arises relative to the EGO. These observations are required to rule out the possibility that these sources represent a sample of chance associations between the EGOs and class I masers.
Analysis of the properties of mm dust clumps associated with class I methanol masers (for a subset of the EGOs in the class I maser survey sample which have available millimeter continuum data) shows that the luminosity of the class I methanol masers is correlated with the both the mass and density of the associated dust clump. The more massive and denser the clump, the stronger the class I methanol emission will be. We also find that the EGOs which are only associated with class I methanol masers have a lower maser luminosity and mass/density of dust clump. This finding supports either the hypothesis that the class I maser can trace a population with lower stellar masses, or that class I methanol masers may be associated with more than one evolutionary phase during the formation of a high-mass star.
REFERENCE
Batrla, W., & Menten, K. M. 1988, ApJ, 329, L117
Becker, R. H., White, R. L., Helfand, D. J., & Zoonematkermani, S. 1994, ApJS, 91, 347
Beuther, H., & Steinacker, J. 2007, ApJ, 656, L85
Bohlin, R. C., Savage, B. D., & Drake, J. F. 1978, ApJ, 224, 132
Bourke, T. L., Hyland, A. R., & Robinson, G. 2005, ApJ, 625, 883
Breen, S. L., Ellingsen, S. P., Caswell, J. L., & Lewis, B. E. 2010a, MNRAS, 401, 2219
Breen, S. L., Caswell, J. L., Ellingsen, S. P., & Phillips, C. J. 2010b, MNRAS, 406, 1487
Carey, S. J., et al. 2009, PASP, 121, 76
Caswell, J. L. 1998, MNRAS, 297, 215
Caswell, J. L. 2009, PASA, 26, 454
Caswell, J. L., et al. 2010, MNRAS, 404, 1029
Chambers, E. T., Jackson, J. M., Rathborne, J. M., & Simon, R. 2009, ApJS, 181, 360
Chen, X., Ellingsen, S. P., & Shen, Z. Q. 2009, MNRAS, 396, 1603
Chen, X., Shen, Z. Q., Li, J. J., Xu, Y., & He J. H. 2010, ApJ, 710, 150
Churchwell, E., et al. 2009, PASP, 121, 213
Cragg, D. M., Johns, K. P., Godfrey, P. D., & Brown, R. D. 1992, MNRAS, 259, 203
Cyganowski, C. J., et al. 2008, AJ, 136, 2391
Cyganowski, C. J., Brogan, C. L., Hunter, T. R., & Churchwell, E. 2009, 702, 1615
Davis, C. J., Kumar, M. S. N., Sandell, G., Froebrich, D., Smith, M. D., & Currie, M. J. 2007, MNRAS, 374, 29
De Buizer, J. M., & Vacca, W. D., 2010, AJ, 140, 196
De Buizer, J. M., 2003, MNRAS, 341, 277
Dunham, M. K., et al. 2010, ApJ, 717, 1157
Ellingsen, S. P. 2005, MNRAS, 359, 1498
Ellingsen, S. P. 2006, ApJ, 638, 241
Ellingsen, S. P. 2007, MNRAS, 377, 571
Ellingsen, S. P., Voronkov, M. A., Cragg, D. M., Sobolev, A. M., Breen, S. L., & Godfrey, P. D. 2007, IAU Symp. 242, Astrophysical Masers and their Environments, ed. J. M. Chapman & W. A. Baan (Cambridge: Cambridge Univ. Press), 213
Faúndez, S., Bronfman, L., Garay, G., Chini, R., Nyman, L.-Å., & May, J. 2004, A&A, 426, 97
Fazio, G. G., et al. 2004, ApJS, 154, 10
Forster, J. R., & Caswell, J. L. 2000, ApJ, 530, 371
Green, J. A., et al. 2009, MNRAS, 392, 783
—, 2010, MNRAS, 409, 913
Gibb, A. G., & Davis, C. J. 1998, MNRAS, 298, 644
Haschick, A. D., Menten, K. M., & Baan, W. A. 1990, ApJ, 354, 556
Hennebelle, P., & Chabrier, G. 2008, ApJ, 684, 395
Hill, T., Burton, M. G., Minier, V., Thompson, M. A., Walsh, A. J., Hunt-Cunningham, M., & Garay, G. 2005, MNRAS, 363, 405
Indebetouw, R., et al. 2005, ApJ, 619, 931
Jackson, J. M., Finn, S. C., Rathborne, J. M., Chambers, E. T., Simon, R. 2008, ApJ, 680, 349
Johnston, K. J., Gaume, R. A., Wilson, T. L., Nguyen, H. A., & Nedoluha, G. E. 1997, ApJ, 490, 758
Kalenskii, S. V., Promyslov, V. G., Slysh, V. I., Bergman, P., & Winnberg A. 2006, Astron. Rep., 50, 289
Kalenskii, S. V., Johansson, L. E. B., Bergman, P., Kurtz, S., Hofner, P., Walmsley, C. M., & Slysh, V. I. 2010, MNRAS, 405, 613
Keto, E. & Klaassen, P. 2008, ApJ, 678, L109
Kurtz, S., Churchwell, E., & Wood, D. O. S. 1994, ApJS, 91, 659
Kurtz, S., Hofner, P., & Álvarez, C. V. 2004, ApJS, 155, 149
Ladd, N., Purcell, C.,Wong, T., & Robertson, S. 2005, Publ. Astron. Soc. Aust., 22, 62
Mehringer, D. M., & Menten, K. M. 1996, ApJ, 474, 346 Menten K., M. 1991a, in “Skylines” proceedings of the Third Haystack Observatory Meeting, ed. A. D. Haschick, P. T. P. Ho (San Fransisco: Astronomical Society of the Pacific), 119
Menten, K. M. 1991b, ApJ, 380, L75
Minier, V., Ellingsen, S. P., Norris, R. P., & Booth, R. S. 2003, A&A, 403, 1095
Noriega-Crespo, A., et al. 2004, ApJS, 154, 352
Ossenkopf, V., & Henning, T. 1994, A&A, 291, 943
Pandian, J. D., Goldsmith, P. F., & Deshpande, A. A. 2007, ApJ, 656, 255
Pandian, J. D., Leurini, S., Menten, K. M., Belloche, A., & Goldsmith, P. 2008, A&A, 489, 1175
Peretto, N., & Fuller, G. A. 2009, A&A, 505, 405
Pestalozzi, M. R., Minier, V., & Booth, R. S. 2005, A&A, 432, 737
Pillai, T., Wyrowski, F., Carey, S. J., & Menten, K. M. 2006, A&A, 450, 569
Plambeck, R. L., & Menten, K. M. 1990, ApJ, 364, 555
Povich, M. S., & Whitney, B. A. 2010, ApJ, 714, 285
Povich, M. S., et al. 2009, ApJ, 696, 1278
Ragan, S. E., Bergin, E. A., & Gutermuth, R. A. 2009, ApJ, 698, 324
Rathborne, J. M., Jackson, J. M., Chambers, E. T., Stojimirovic, I., Simon, R., Shipman, R., & Frieswijk, W. 2010, ApJ, 715, 310
Reach, W. T., et al. 2006, AJ, 131, 1479
Reid, M. J., et al. 2009, ApJ, 700, 137
Rohlfs, K., & Wilson, T. L. (ed.) 2004, Tools of Radio Astronomy (4th revised and enlarged edition; Berlin: Springer)
Robitaille, T. P., Whitney, B. A., Indebetouw, R., Wood, K., & Denzmore, P. 2006, ApJS, 167, 256
Robitaille, T. P., et al. 2008, AJ, 136, 2413
Rosolowsky, E., et al. 2010, ApJS, 188, 123
Salii, S. V., Sobolev, A. M., & Kalinina, N. D. 2002, Astron. Rep., 46, 955
Smith, H. A., Hora, J. L., Marengo, M., & Pipher, J. L. 2006, ApJ, 645, 1264
Slysh, V. I., Kalenskii, S. V., Val’tts, I. E., & Otrupcek, R. 1994, MNRAS, 268, 464
Sobolev, A. M. 1992, SvA, 36, 590
Val’tts, I. E., Ellingsen, S. P., Slysh, V. I., Kalenskii, S. V., Otrupcek, R., & Larinov, G. M. 2000, MNRAS, 317, 315
Val’tts I. E., & Larinov G. M., 2007, Astron. Rep., 51, 519
Val’tts, I. E., Larionov, G. M., & Bayandina, O. S. 2010, eprint arXiv:1005.3715
Voronkov, M. A., Brooks, K. J., Sobolev, A. M., Ellingsen, S. P., Ostrovskii, A. B., & Caswell J. L. 2006, MNRAS, 373, 411
Voronkov, M. A., Caswell, J. L., Ellingsen, S. P., & Sobolev, A. M., 2010, MNRAS, 405, 2471
Walsh, A. J., Burton, M. G., Hyland, A. R., & Robinson, G. 1998, MNRAS, 301, 640
Whitney, B. A., et al. 2004, ApJS, 154, 315
Wood, D. O. S., & Churchwell, E. 1989, ApJS, 69, 831
Xu, Y., Li, J. J., Hachisuka, K., Pandian, J. D., Menten, K. M., & Henkel, C. 2008, A&A, 485, 729
Xu, Y., Voronkov, M. A., Pandian, J. D., Li, J. J., Sobolev, A. M., Brunthaler, A., Ritter, B., & Menten, K. M. 2009, A&A, 507, 1117
Ybarra, J. E., Lada, E. A., Balog, Z., Fleming, S. W., & Phelps, R. L. 2010, ApJ, 714, 469
Ybarra, J. E., & Lada, E. A. 2009, ApJ, 695, 120
| Positiona | |||||||||
|---|---|---|---|---|---|---|---|---|---|
| Source | R.A. (2000) | Dec. (2000) | IRDCb | Class IIc | OHd | UC Hiid | mm d | Remarke | class If |
| (h m s) | (° ′ ″) | ||||||||
| G10.290.13l | 18 08 49.3 | 20 05 57 | Y | Y | – | N | Y | 2 | Y |
| G10.340.14l | 18 09 00.0 | 20 03 35 | Y | Y | – | N | Y | 2 | Y |
| G11.110.11 | 18 10 28.3 | 19 22 31 | Y | Y | – | N | Y | 3 | N |
| G11.920.61g | 18 13 58.1 | 18 54 17 | Y | Y | – | – | – | 1 | Y |
| G12.020.21ik | 18 12 40.4 | 18 37 11 | Y | N | – | N | Y | 1 | N |
| G12.200.03jl | 18 12 23.6 | 18 22 54 | N | Y | – | Y | Y | 4 | Y |
| G12.420.50n | 18 10 51.1 | 17 55 50 | N | N | – | – | Y | 4 | Y |
| G12.680.18l | 18 13 54.7 | 18 01 47 | N | Y | Y | N | Y | 4 | Y |
| G12.910.03 | 18 13 48.2 | 17 45 39 | Y | Y | – | N | Y | 1 | Y |
| G12.910.26l | 18 14 39.5 | 17 52 00 | N | Y | Y | N | Y | 5 | Y |
| G14.630.58hjl | 18 19 15.4 | 16 30 07 | Y | Y | – | – | Y | 1 | Y |
| G16.580.08k | 18 21 15.0 | 14 33 02 | Y | N | – | N | Y | 4 | N |
| G17.960.08k | 18 23 21.0 | 13 15 11 | N | N | – | N | Y | 4 | N |
| IRDC182233n | 18 25 08.5 | 12 45 23 | Y | N | – | N | Y | – | Y |
| G18.670.03h | 18 24 53.7 | 12 39 20 | N | Y | – | N | Y | 1 | Y |
| G18.890.47h | 18 27 07.9 | 12 41 36 | Y | Y | – | – | Y | 1 | Y |
| G19.010.03h | 18 25 44.8 | 12 22 46 | Y | Y | – | N | Y | 1 | Y |
| G19.360.03l | 18 26 25.8 | 12 03 57 | Y | Y | – | Y | Y | 2 | Y |
| G19.610.12m | 18 27 13.6 | 11 53 20 | N | Y | – | N | N | 2 | N |
| G19.880.53hj | 18 29 14.7 | 11 50 23 | Y | Y | – | – | Y | 1 | Y |
| G20.240.07gm | 18 27 44.6 | 11 14 54 | N | Y | – | N | Y | 4 | N |
| G21.240.19k | 18 29 10.2 | 10 18 11 | Y | N | – | N | Y | 4 | N |
| G22.040.22 | 18 30 34.7 | 09 34 47 | Y | Y | – | N | Y | 1 | Y |
| G23.820.38 | 18 33 19.5 | 07 55 37 | N | – | – | N | Y | 4 | Y |
| G23.960.11 | 18 35 22.3 | 08 01 28 | N | Y | – | N | Y | 1 | Y |
| G24.000.10 | 18 35 23.5 | 07 59 32 | Y | Y | – | N | Y | 1 | Y |
| G24.110.17n | 18 35 52.6 | 07 55 17 | Y | N | – | N | Y | 4 | Y |
| G24.170.02i | 18 35 25.0 | 07 48 15 | Y | – | – | N | N | 1 | N |
| G24.330.14gl | 18 35 08.1 | 07 35 04 | Y | Y | – | N | Y | 4 | Y |
| G24.630.15j | 18 35 40.1 | 07 18 35 | Y | N | – | N | Y | 3 | Y |
| G24.940.07h | 18 36 31.5 | 07 04 16 | N | Y | – | N | Y | 1 | Y |
| G25.270.43j | 18 38 57.0 | 07 00 48 | Y | Y | – | – | Y | 1 | Y |
| G25.380.15j | 18 38 08.1 | 06 46 53 | Y | – | – | N | Y | 2 | Y |
| G27.970.47h | 18 44 03.6 | 04 38 02 | Y | N | – | – | Y | 1 | Y |
| G28.280.36m | 18 44 13.2 | 04 18 04 | N | Y | – | Y | Y | 2 | N |
| G28.850.23m | 18 44 47.5 | 03 44 15 | N | Y | – | N | N | 4 | N |
| G29.890.77 | 18 48 37.7 | 03 03 44 | Y | N | – | – | N | 4 | N |
| G29.910.81 | 18 48 47.6 | 03 03 31 | N | N | – | – | Y | 4 | N |
| G29.960.79ik | 18 48 50.0 | 03 00 21 | Y | N | – | – | Y | 3 | N |
| G34.260.15g | 18 53 16.4 | 01 15 07 | N | – | – | Y | Y | 5 | Y |
| G34.280.18h | 18 53 15.0 | 01 17 11 | Y | – | – | N | Y | 3 | Y |
| G34.390.22 | 18 53 19.0 | 01 24 08 | Y | – | – | N | N | 2 | Y |
| G34.410.24h | 18 53 17.9 | 01 25 25 | Y | – | – | N | Y | 1 | Y |
| G35.040.47hj | 18 56 58.1 | 01 39 37 | Y | N | – | – | Y | 1 | Y |
| G35.130.74h | 18 58 06.4 | 01 37 01 | N | – | – | – | – | 1 | Y |
| G35.150.80i | 18 52 36.6 | 02 20 26 | N | N | – | – | – | 1 | N |
| G35.200.74h | 18 58 12.9 | 01 40 33 | N | Y | – | – | – | 1 | Y |
| G35.680.18ik | 18 57 05.0 | 02 22 00 | Y | N | – | N | Y | 1 | N |
| G35.790.17hj | 18 57 16.7 | 02 27 56 | Y | – | – | N | Y | 1 | Y |
| G36.010.20 | 18 57 45.9 | 02 39 05 | Y | – | – | N | Y | 1 | N |
| G37.480.10ik | 19 00 07.0 | 03 59 53 | N | Y | – | N | Y | 1 | N |
| G37.550.20 | 18 59 07.5 | 04 12 31 | N | – | – | N | N | 5 | N |
| G39.100.49j | 19 00 58.1 | 05 42 44 | N | Y | – | – | Y | 1 | Y |
| G39.390.14 | 19 03 45.3 | 05 40 43 | N | – | – | Y | Y | 4 | Y |
| G40.280.22hj | 19 05 41.3 | 06 26 13 | Y | – | – | – | Y | 3 | Y |
| G40.280.27ik | 19 05 51.5 | 06 24 39 | Y | N | – | – | Y | 1 | N |
| G40.600.72jn | 19 08 03.3 | 06 29 15 | N | N | – | – | – | 4 | Y |
| G44.010.03ik | 19 11 57.2 | 09 50 05 | N | N | – | – | N | 1 | N |
| G45.470.05gi | 19 14 25.6 | 11 09 28 | Y | – | – | Y | Y | 1 | N |
| G45.500.12k | 19 14 13.0 | 11 13 30 | N | – | – | – | N | 4 | N |
| G45.800.36h | 19 16 31.1 | 11 16 11 | N | – | – | – | Y | 3 | Y |
| G48.660.30 | 19 21 48.0 | 13 49 21 | Y | N | – | – | Y | 2 | N |
| G49.070.33j | 19 22 41.9 | 14 10 12 | Y | N | – | – | Y | 3 | Y |
| G49.420.33m | 19 20 59.1 | 14 46 53 | N | Y | – | – | Y | 2 | N |
| G53.920.07i | 19 31 23.0 | 18 33 00 | N | N | – | – | Y | 3 | N |
| G54.110.04k | 19 31 40.0 | 18 43 53 | N | N | – | – | Y | 4 | N |
| G54.110.08ik | 19 31 48.8 | 18 42 57 | N | N | – | – | Y | 3 | N |
| G54.451.01hj | 19 28 26.4 | 19 32 15 | N | N | – | – | – | 3 | Y |
| G57.610.02 | 19 38 40.8 | 21 49 35 | N | – | – | – | N | 4 | N |
| G59.790.63hj | 19 41 03.1 | 24 01 15 | Y | – | – | – | – | 1 | Y |
| G298.900.36ik | 12 16 43.2 | 62 14 25 | N | N | – | – | – | 1 | N |
| G304.890.64ik | 13 08 12.1 | 62 10 22 | Y | N | – | – | – | 3 | N |
| G305.480.10h | 13 13 45.8 | 62 51 28 | N | – | – | – | – | 1 | Y |
| G305.520.76j | 13 13 29.3 | 61 59 53 | Y | N | – | – | – | 1 | Y |
| G305.570.34i | 13 14 49.1 | 63 05 38 | Y | – | – | – | – | 1 | N |
| G305.620.34i | 13 15 11.5 | 63 05 30 | N | – | – | – | – | 1 | N |
| G305.770.25 | 13 16 30.0 | 62 59 09 | N | N | – | – | – | 4 | N |
| G305.800.24gjl | 13 16 43.4 | 62 58 29 | N | Y | Y | Y | – | 4 | Y |
| G305.820.11hj | 13 16 48.6 | 62 50 35 | Y | – | – | – | – | 1 | Y |
| G305.890.02h | 13 17 15.5 | 62 42 24 | Y | Y | – | – | – | 1 | Y |
| G309.150.35ik | 13 45 51.3 | 62 33 46 | Y | N | – | – | – | 1 | N |
| G309.900.23k | 13 51 00.4 | 61 49 53 | Y | – | – | – | – | 2 | N |
| G309.910.32j | 13 50 53.9 | 61 44 22 | Y | – | – | – | – | 3 | Y |
| G309.970.50k | 13 51 05.2 | 61 33 20 | Y | – | – | – | – | 4 | N |
| G309.970.59ik | 13 50 52.6 | 61 27 46 | Y | – | – | – | – | 3 | N |
| G309.990.51i | 13 51 12.2 | 61 32 09 | Y | – | – | – | – | 1 | N |
| G310.080.23i | 13 53 23.0 | 62 14 13 | Y | N | – | – | – | 1 | N |
| G310.150.76l | 13 51 59.2 | 61 15 37 | N | Y | – | – | – | 4 | Y |
| G310.380.30n | 13 56 01.0 | 62 14 19 | Y | N | – | – | – | 4 | Y |
| G311.040.69n | 13 59 18.1 | 61 06 33 | Y | N | – | – | – | 4 | Y |
| G311.510.45hj | 14 05 46.1 | 62 04 49 | Y | N | – | – | – | 3 | Y |
| G312.110.26ik | 14 08 49.3 | 61 13 25 | Y | Y | N | – | – | 1 | N |
| G313.710.19m | 14 22 37.4 | 61 08 17 | Y | Y | Y | – | – | 4 | N |
| G313.760.86l | 14 25 01.3 | 61 44 57 | Y | Y | Y | Y | – | 4 | Y |
| G317.440.37 | 14 51 03.0 | 59 49 58 | Y | – | N | – | – | 4 | N |
| G317.460.40ik | 14 51 19.6 | 59 50 51 | Y | – | N | – | – | 1 | N |
| G317.870.15hj | 14 53 16.3 | 59 26 36 | Y | N | N | – | – | 1 | Y |
| G317.880.25hj | 14 53 43.5 | 59 31 35 | Y | N | N | – | – | 1 | Y |
| G320.230.28gl | 15 09 52.6 | 58 25 36 | Y | Y | Y | – | – | 2 | Y |
| G321.940.01hj | 15 19 43.3 | 57 18 06 | Y | N | N | – | – | 1 | Y |
| G324.110.44ik | 15 31 05.0 | 55 43 39 | Y | N | N | – | – | 3 | N |
| G324.170.44 | 15 31 24.6 | 55 41 30 | N | N | N | – | – | 2 | N |
| G324.190.41hj | 15 31 38.0 | 55 42 36 | N | N | N | – | – | 1 | Y |
| G325.520.42 | 15 39 10.6 | 54 55 40 | N | N | N | – | – | 4 | N |
| G326.270.49i | 15 47 10.8 | 55 11 12 | Y | N | N | – | – | 1 | N |
| G326.310.90ik | 15 41 35.9 | 54 03 42 | Y | N | N | – | – | 1 | N |
| G326.320.39 | 15 47 04.8 | 55 04 51 | N | – | N | – | – | 2 | Y |
| G326.360.88ik | 15 41 55.4 | 54 02 55 | Y | – | N | – | – | 3 | N |
| G326.370.94 | 15 41 44.1 | 54 00 00 | Y | N | N | – | – | 4 | N |
| G326.410.93hj | 15 41 59.4 | 53 59 03 | Y | – | N | – | – | 3 | Y |
| G326.570.20ik | 15 45 53.4 | 54 27 50 | N | N | N | – | – | 3 | N |
| G326.610.80hj | 15 43 36.2 | 53 57 51 | Y | N | N | – | – | 3 | Y |
| G326.780.24gi | 15 48 55.2 | 54 40 37 | N | N | N | – | – | 1 | N |
| G326.790.38ik | 15 46 20.9 | 54 10 45 | Y | N | N | – | – | 1 | N |
| G326.800.51ik | 15 45 48.6 | 54 04 30 | Y | N | N | – | – | 3 | N |
| G326.920.31hj | 15 49 56.2 | 54 38 29 | Y | N | N | – | – | 3 | Y |
| G326.970.03hj | 15 49 03.2 | 54 23 37 | Y | N | N | – | – | 1 | Y |
| G327.570.85 | 15 55 47.3 | 54 39 09 | Y | – | N | – | – | 4 | Y |
| G327.650.13 | 15 52 00.5 | 53 50 41 | N | N | N | – | – | 4 | N |
| G327.720.38h | 15 54 32.3 | 54 11 55 | N | – | N | – | – | 3 | Y |
| G327.860.19ik | 15 52 49.2 | 53 40 07 | N | N | N | – | – | 3 | N |
| G327.890.15hj | 15 53 10.3 | 53 40 28 | Y | N | N | – | – | 3 | Y |
| G328.160.59jn | 15 52 42.5 | 53 09 51 | N | N | N | – | – | 4 | Y |
| G328.550.27hj | 15 56 01.5 | 53 09 44 | Y | N | N | – | – | 3 | Y |
| G328.600.27k | 15 56 15.8 | 53 07 50 | Y | N | N | – | – | 4 | N |
| G329.160.29hj | 16 01 33.6 | 53 11 15 | Y | – | N | – | – | 3 | Y |
| G329.470.52 | 15 59 36.6 | 52 22 55 | Y | – | N | – | – | 1 | Y |
| G330.880.37gl | 16 10 19.9 | 52 06 13 | Y | Y | Y | Y | – | 2 | Y |
| G331.080.47ik | 16 11 46.9 | 52 02 31 | Y | N | N | – | – | 3 | N |
| G331.120.46k | 16 11 55.3 | 52 00 10 | Y | N | N | – | – | 4 | N |
| G331.370.40hj | 16 12 48.1 | 51 47 30 | Y | – | N | – | – | 3 | Y |
| G331.510.34 | 16 13 11.7 | 51 39 12 | Y | – | N | – | – | 4 | N |
| G331.620.53h | 16 09 56.8 | 50 56 25 | N | N | N | – | – | 3 | Y |
| G331.710.58hj | 16 10 06.3 | 50 50 29 | Y | – | N | – | – | 3 | Y |
| G331.710.60hj | 16 10 01.9 | 50 49 33 | Y | – | N | – | – | 3 | Y |
| G332.120.94 | 16 10 30.4 | 50 18 05 | Y | N | N | – | – | 2 | N |
| G332.280.07ik | 16 15 35.1 | 50 55 36 | Y | – | N | – | – | 3 | N |
| G332.280.55n | 16 17 41.8 | 51 16 04 | Y | N | N | – | – | 4 | Y |
| G332.330.12ik | 16 16 03.3 | 50 55 34 | Y | N | N | – | – | 3 | N |
| G332.350.12h | 16 16 07.0 | 50 54 30 | Y | Y | Y | – | – | 1 | Y |
| G332.360.60hj | 16 13 02.4 | 50 22 39 | Y | N | N | – | – | 3 | Y |
| G332.470.52i | 16 18 26.5 | 51 07 12 | Y | N | N | – | – | 3 | N |
| G332.580.15hj | 16 16 00.6 | 50 33 30 | Y | – | N | – | – | 3 | Y |
| G332.590.04ik | 16 16 30.1 | 50 37 50 | Y | N | N | – | – | 3 | N |
| G332.810.70hj | 16 20 48.1 | 51 00 15 | N | – | N | – | – | 1 | Y |
| G332.910.55j | 16 20 32.6 | 50 49 46 | Y | N | N | – | – | 3 | Y |
| G333.080.56i | 16 21 20.9 | 50 43 05 | Y | – | N | – | – | 3 | N |
| G333.320.10l | 16 19 28.9 | 50 04 40 | Y | Y | Y | – | – | 4 | Y |
| G334.040.35ik | 16 21 36.9 | 49 23 28 | N | N | N | – | – | 3 | N |
| G335.430.24k | 16 30 05.8 | 48 48 44 | Y | – | N | – | – | 3 | N |
| G335.590.30j | 16 31 02.5 | 48 44 07 | Y | – | N | – | – | 4 | Y |
| G336.020.83l | 16 35 09.7 | 48 46 44 | N | Y | Y | Y | – | 4 | Y |
| G336.030.82 | 16 35 09.6 | 48 45 55 | N | – | N | Y | – | 4 | Y |
| G336.870.29ik | 16 33 40.3 | 47 23 32 | Y | N | N | – | – | 3 | N |
| G336.960.98hj | 16 39 37.5 | 48 10 58 | Y | N | N | – | – | 3 | Y |
| G337.160.39i | 16 37 49.6 | 47 38 50 | Y | – | N | – | – | 3 | N |
| G337.300.87 | 16 40 31.3 | 47 51 31 | Y | – | N | – | – | 1 | Y |
| G338.320.41j | 16 42 27.5 | 46 46 57 | Y | – | N | – | – | 3 | Y |
| G338.390.40 | 16 42 41.2 | 46 43 40 | Y | – | N | – | – | 1 | N |
| G338.420.41 | 16 42 50.5 | 46 42 29 | Y | – | N | – | – | 4 | N |
| G339.580.13l | 16 45 59.5 | 45 38 44 | Y | Y | N | – | – | 4 | Y |
| G339.950.54h | 16 49 07.9 | 45 37 59 | N | Y | N | – | – | 1 | Y |
| G340.050.25l | 16 48 14.7 | 45 21 52 | Y | Y | Y | Y | – | 4 | Y |
| G340.070.24 | 16 48 15.1 | 45 20 57 | Y | – | N | – | – | 4 | N |
| G340.100.18 | 16 48 07.0 | 45 17 06 | N | – | N | – | – | 4 | N |
| G340.751.00ik | 16 54 04.0 | 45 18 50 | Y | N | N | – | – | 3 | N |
| G340.770.12ik | 16 50 17.5 | 44 43 54 | Y | – | N | – | – | 3 | N |
| G340.971.02 | 16 54 57.3 | 45 09 04 | Y | – | N | – | – | 1 | Y |
| G341.200.26ik | 16 52 27.8 | 44 29 29 | Y | – | N | – | – | 3 | N |
| G341.220.26 | 16 52 32.2 | 44 28 38 | Y | – | N | – | – | 2 | Y |
| G341.240.27hj | 16 52 37.3 | 44 28 09 | Y | – | N | – | – | 1 | Y |
| G341.990.10 | 16 54 32.8 | 43 46 45 | Y | N | N | – | – | 1 | N |
| G342.040.43 | 16 52 27.8 | 43 24 17 | N | N | N | – | – | 4 | N |
| G342.150.51hj | 16 52 28.3 | 43 16 08 | N | N | N | – | – | 3 | Y |
| G342.480.18l | 16 55 02.6 | 43 13 01 | Y | Y | N | – | – | 2 | Y |
| G343.190.08ik | 16 58 34.9 | 42 49 46 | Y | N | N | – | – | 3 | N |
| G343.400.40ik | 17 00 40.4 | 42 51 33 | Y | N | N | – | – | 3 | N |
| G343.420.37k | 17 00 37.4 | 42 49 40 | Y | N | N | – | – | 4 | N |
| G343.500.03h | 16 59 10.7 | 42 31 07 | Y | N | N | – | – | 3 | Y |
| G343.500.47hj | 17 01 18.4 | 42 49 36 | N | – | N | – | – | 1 | Y |
| G343.530.51j | 17 01 33.5 | 42 49 50 | Y | – | N | – | – | 4 | Y |
| G343.720.18i | 17 00 48.3 | 42 28 25 | Y | – | N | – | – | 1 | N |
| G343.780.24 | 17 01 13.1 | 42 27 48 | Y | N | N | – | – | 3 | N |
| G344.210.62ik | 17 04 17.8 | 42 21 09 | N | N | N | – | – | 3 | N |
| G345.130.17jl | 17 05 23.1 | 41 21 11 | N | Y | N | – | – | 4 | Y |
| G345.720.82ik | 17 03 06.4 | 40 17 09 | Y | N | N | – | – | 1 | N |
| G345.990.02 | 17 07 27.6 | 40 34 45 | N | Y | N | – | – | 1 | Y |
| G346.040.05m | 17 07 19.9 | 40 29 49 | N | Y | N | – | – | 4 | N |
| G348.170.46hj | 17 12 10.9 | 38 31 59 | N | N | N | – | – | 3 | Y |
| G348.550.98h | 17 19 20.9 | 39 03 55 | N | Y | Y | – | – | 1 | Y |
| G348.580.92h | 17 19 10.7 | 39 00 23 | Y | Y | Y | – | – | 1 | Y |
| G348.731.04gl | 17 20 06.5 | 38 57 08 | Y | Y | Y | Y | – | 4 | Y |
| Category | Datasets | (Un)Targeted | Area covered | Angular resolution | Sensitivitya | Commentsb |
|---|---|---|---|---|---|---|
| OH maser | Caswell (1998) | Untargeted | & | 7′′ | 0.12 Jy | 101 EGOs fell within the area |
| 11 detected | ||||||
| Targeted | 7′′ | 0.12 Jy | additional 3 EGOs were detected | |||
| Class II maser | Caswell (2009) | Targeted | 2′′ | … | 60 EGOs were detected | |
| Cyganowski et al. (2009) | Targeted | … | 2′′ | 0.1 Jy | 20 EGOs were detected | |
| Xu et al. (2009) | Targeted | … | a few arcsecs | … | 30 EGOs were detected | |
| Caswell et al. (2010) | Untargeted | & | a few arcsecs | 0.2 Jy | 11 EGOs fell within the area, | |
| 8 were detected | ||||||
| Green et al. (2010) | Unargeted | & | a few arcsecs | 0.2 Jy | 22 EGOs fell within the area, | |
| 16 were detected | ||||||
| Titmarsh et al. (in prep.) | Targeted | … | 7′ | 1.5 Jy | searched 140 EGOs without | |
| observed in previous survey, | ||||||
| 80 were not detected | ||||||
| UC Hii region | Wood & Churchwell (1989) | Targeted | … | 0.4′′ | 1 mJy/beam at 6 cm | 2 EGOs were detected |
| Becker et al. (1994) | Untargeted | & | 4′′ | 7.5 mJy/beam at | 40 EGOs fell within the area, | |
| field center, 5 GHz | but only 4 were detected | |||||
| Kurtz et al. (1994) | Targeted | … | 1′′ | 1.2 mJy/beam at 2 cm | 1 EGO was detected | |
| 0.6 mJy/beam at 3.6 cm | ||||||
| Walsh et al. (1998) | Targeted | … | 1′′ | 3 mJy at 8.64 GHz | 9 EGOs were detected | |
| 30 mJy at 6.67 GHz | ||||||
| Cyganowski et al. (2009) | Targeted | … | 0.5′′ | 3 mJy/beam at 44 GHz | Among 19 surveyed EGOs, | |
| only 1 was detected | ||||||
| 1.1 mm source | Rosolowsky et al. (2010) | Untargeted | 33′′ | 0.1-0.2 Jy | 63 EGOs fell within the area, | |
| 54 were detected |
| Gaussian Fit | ||||||||
|---|---|---|---|---|---|---|---|---|
| Source | VLSR | Sint | D | Lm | ||||
| (Jy km s-1) | (km s-1) | (km s-1) | (Jy) | (Jy) | (Jy km s-1) | (kpc) | (10-6 L⊙) | |
| (1) | (2) | (3) | (4) | (5) | (6) | (7) | (8) | (9) |
| G10.29-0.13 | 10.43(0.92) | 13.96(0.41) | 8.41(0.88) | 0.99 | 0.55 | 12.87 | 2.3 | 2.1 |
| 1.62(0.24) | 14.31(0.03) | 0.46(0.07) | 2.82 | |||||
| 0.82(0.18) | 15.13(0.03) | 0.28(0.07) | 2.30 | |||||
| G10.34-0.14 | 39.05(0.81) | 12.24(0.05) | 5.30(0.12) | 6.92 | 0.62 | 69.21 | 2.3 | 11.5 |
| 30.16(0.26) | 14.74(0.00) | 0.45(0.00) | 63.05 | |||||
| G11.92-0.61 | 22.55(0.33) | 33.94(0.01) | 0.82(0.01) | 25.70 | 0.62 | 69.51 | 3.8 | 31.5 |
| 28.63(0.45) | 35.10(0.00) | 0.52(0.01) | 52.18 | |||||
| 18.34(0.60) | 36.26(0.02) | 1.44(0.06) | 11.95 | |||||
| G12.20-0.03 | 1.93(0.28) | 49.28(0.04) | 0.59(0.11) | 3.05 | 0.63 | 7.08 | 4.5 | 4.5 |
| 0.92(0.23) | 49.96(0.03) | 0.32(0.08) | 2.69 | |||||
| 1.26(0.43) | 51.11(0.04) | 0.47(0.12) | 2.52 | |||||
| 2.97(0.70) | 52.36(0.23) | 2.04(0.55) | 1.37 | |||||
| G12.42+0.50 | 0.58(0.24) | 16.57(0.06) | 0.42(0.16) | 1.28 | 0.49 | 7.08 | 2.4 | 1.3 |
| 5.37(0.61) | 17.98(0.07) | 1.67(0.24) | 3.01 | |||||
| 1.14(0.45) | 19.67(0.15) | 0.99(0.33) | 1.08 | |||||
| G12.68-0.18 | 7.97(0.37) | 55.25(0.06) | 2.64(0.14) | 2.84 | 0.45 | 7.97 | 4.7 | 5.5 |
| G12.91-0.03 | 2.55(0.29) | 55.23(0.03) | 0.77(0.08) | 3.09 | 0.46 | 9.76 | 4.8 | 7.0 |
| 6.50(0.46) | 57.02(0.05) | 1.82(0.17) | 3.34 | |||||
| 0.71(0.20) | 58.47(0.04) | 0.39(0.10) | 1.73 | |||||
| G12.91-0.26 | 15.63(0.76) | 36.99(0.09) | 3.57(0.23) | 4.12 | 0.53 | 19.55 | 3.8 | 8.8 |
| 1.52(0.22) | 36.58(0.02) | 0.35(0.05) | 4.01 | |||||
| 2.40(0.54) | 39.42(0.05) | 0.96(0.16) | 2.34 | |||||
| G14.63-0.58 | 0.54(0.14) | 16.88(0.04) | 0.30(0.09) | 1.68 | 0.46 | 14.04 | 2.2 | 2.1 |
| 8.99(3.27) | 18.46(0.21) | 1.24(0.24) | 6.83 | |||||
| 4.50(0.83) | 18.72(0.01) | 0.37(0.03) | 11.40 | |||||
| IRDC18223-3 | 3.32(0.82) | 45.55(0.70) | 6.25(1.87) | 0.50 | 0.60 | 6.32 | 3.6 | 2.6 |
| 1.36(0.41) | 44.83(0.09) | 0.73(0.23) | 1.75 | |||||
| 1.65(0.33) | 45.65(0.04) | 0.50(0.10) | 3.11 | |||||
| G18.67+0.03 | 3.12(0.28) | 80.08(0.06) | 1.15(0.12) | 2.16 | 0.49 | 3.61 | 5.1 | 2.9 |
| 0.49(0.17) | 82.53(0.09) | 0.43(0.17) | 0.91 | |||||
| G18.89-0.47 | 16.30(0.62) | 64.75(0.01) | 1.02(0.04) | 12.75 | 0.62 | 46.53 | 4.5 | 29.5 |
| 14.64(0.41) | 66.01(0.01) | 0.52(0.01) | 22.57 | |||||
| 2.78(0.34) | 66.85(0.02) | 0.44(0.05) | 5.04 | |||||
| 12.81(1.13) | 66.59(0.30) | 6.34(0.59) | 1.61 | |||||
| G19.01-0.03 | 12.99(0.84) | 59.26(0.14) | 4.70(0.36) | 2.59 | 0.60 | 20.46 | 4.2 | 11.3 |
| 3.42(0.95) | 59.28(0.09) | 0.73(0.17) | 4.42 | |||||
| 3.10(0.86) | 59.88(0.04) | 0.50(0.07) | 5.78 | |||||
| 0.94(0.26) | 61.89(0.05) | 0.46(0.12) | 1.93 | |||||
| G19.36-0.03 | 22.96(1.14) | 26.61(0.05) | 3.83(0.18) | 5.63 | 0.49 | 68.67 | 2.5 | 13.5 |
| 32.40(0.95) | 26.48(0.01) | 1.07(0.02) | 28.41 | |||||
| 13.32(0.45) | 27.59(0.01) | 0.66(0.02) | 18.95 | |||||
| G19.88-0.53 | 8.11(0.80) | 41.49(0.11) | 2.31(0.26) | 3.30 | 0.62 | 70.77 | 3.4 | 25.6 |
| 30.06(3.20) | 43.34(0.03) | 0.91(0.04) | 31.03 | |||||
| 26.75(3.24) | 44.20(0.10) | 1.29(0.14) | 19.40 | |||||
| 1.37(0.47) | 45.45(0.03) | 0.37(0.09) | 3.49 | |||||
| 3.32(0.54) | 46.23(0.08) | 1.03(0.20) | 3.04 | |||||
| 1.16(0.26) | 47.77(0.07) | 0.64(0.17) | 1.71 | |||||
| G22.04+0.22 | 20.41(1.87) | 50.61(0.04) | 1.04(0.06) | 15.63 | 0.75 | 57.90 | 3.7 | 24.8 |
| 13.29(1.60) | 51.57(0.01) | 0.51(0.04) | 20.96 | |||||
| 7.07(1.82) | 52.33(0.04) | 1.29(0.04) | 4.36 | |||||
| 4.10(1.14) | 54.03(0.10) | 0.85(0.17) | 3.86 | |||||
| 13.03(2.12) | 55.63(0.72) | 7.40(0.97) | 1.41 | |||||
| G23.82+0.38 | 7.25(0.70) | 73.35(0.19) | 3.99(0.41) | 1.71 | 0.58 | 9.67 | 4.6 | 6.4 |
| 2.43(0.35) | 75.36(0.03) | 0.67(0.08) | 3.41 | |||||
| G23.96-0.11 | 0.85(0.29) | 70.82(0.13) | 0.79(0.33) | 1.01 | 0.54 | 9.11 | 4.5 | 5.8 |
| 0.73(0.28) | 71.83(0.10) | 0.60(0.27) | 1.14 | |||||
| 5.91(0.47) | 73.05(0.02) | 0.81(0.06) | 6.85 | |||||
| 1.62(0.49) | 74.30(0.17) | 1.21(0.41) | 1.26 | |||||
| G24.00-0.10 | 1.26(0.61) | 69.28(0.18) | 0.99(0.40) | 1.21 | 0.58 | 3.42 | 4.4 | 2.1 |
| 2.16(0.73) | 71.05(0.30) | 1.89(0.76) | 1.07 | |||||
| G24.11-0.17 | 3.43(0.66) | 82.05(0.26) | 2.73(0.60) | 1.18 | 0.64 | 3.43 | 4.9 | 2.6 |
| G24.33+0.14 | 24.13(0.71) | 113.32(0.00) | 0.67(0.01) | 33.67 | 0.66 | 95.70 | 6.2 | 115.3 |
| 63.13(0.89) | 114.04(0.02) | 2.23(0.03) | 26.63 | |||||
| 8.45(0.51) | 116.32(0.03) | 1.06(0.06) | 7.47 | |||||
| G24.63+0.15 | 1.49(0.26) | 50.89(0.05) | 0.60(0.11) | 2.32 | 0.54 | 3.93 | 3.5 | 1.5 |
| 0.69(0.30) | 51.95(0.03) | 0.31(0.11) | 2.05 | |||||
| 1.76(0.58) | 52.75(0.27) | 1.64(0.57) | 1.01 | |||||
| G24.94+0.07 | 1.50(0.64) | 40.55(0.12) | 0.71(0.20) | 2.00 | 0.46 | 7.66 | 3.0 | 2.2 |
| 3.73(0.94) | 41.50(0.06) | 0.96(0.25) | 3.66 | |||||
| 0.52(0.29) | 42.25(0.04) | 0.29(0.12) | 1.67 | |||||
| 1.90(0.52) | 43.18(0.22) | 1.66(0.53) | 1.08 | |||||
| G25.27-0.43 | 0.98(0.32) | 58.85(0.06) | 0.54(0.14) | 1.71 | 0.47 | 6.73 | 3.9 | 3.2 |
| 5.40(0.45) | 59.87(0.03) | 1.09(0.12) | 4.67 | |||||
| 0.35(0.17) | 60.77(0.04) | 0.26(0.11) | 1.29 | |||||
| G25.38-0.15 | 2.74(0.41) | 93.68(0.02) | 0.60(0.07) | 4.27 | 0.48 | 14.64 | 5.4 | 13.4 |
| 6.40(0.99) | 94.67(0.23) | 2.39(0.35) | 2.51 | |||||
| 0.22(0.10) | 95.06(0.06) | 0.24(0.18) | 0.88 | |||||
| 0.45(0.19) | 95.74(0.05) | 0.29(0.16) | 1.47 | |||||
| 0.83(0.45) | 96.22(0.06) | 0.35(0.15) | 2.21 | |||||
| 1.33(0.25) | 96.74(0.06) | 0.47(0.25) | 2.67 | |||||
| 0.80(0.33) | 97.29(0.12) | 0.46(0.23) | 1.65 | |||||
| 1.86(0.41) | 99.01(0.22) | 2.12(0.57) | 0.83 | |||||
| G27.97-0.47 | 5.10(0.44) | 45.14(0.06) | 1.61(0.13) | 2.98 | 0.49 | 6.83 | 3.1 | 2.1 |
| 1.73(0.34) | 45.42(0.02) | 0.42(0.06) | 3.87 | |||||
| G34.26+0.15 | 35.17(1.77) | 58.04(0.06) | 2.52(0.12) | 13.13 | 0.73 | 64.20 | 3.9 | 30.6 |
| 1.25(0.28) | 58.89(0.09) | 0.39(0.18) | 2.99 | |||||
| 4.25(1.90) | 59.40(0.06) | 0.62(0.24) | 6.46 | |||||
| 9.89(1.98) | 60.31(0.03) | 0.80(0.16) | 11.56 | |||||
| 8.27(1.20) | 60.96(0.01) | 0.41(0.03) | 18.84 | |||||
| 2.14(0.66) | 61.61(0.08) | 0.66(0.20) | 3.06 | |||||
| 3.23(0.68) | 63.50(0.23) | 2.29(0.59) | 1.32 | |||||
| G34.28+0.18 | 3.40(0.54) | 54.84(0.09) | 1.21(0.20) | 2.64 | 0.48 | 24.72 | 3.6 | 10.0 |
| 11.43(0.50) | 55.75(0.01) | 0.55(0.02) | 19.50 | |||||
| 8.22(0.27) | 56.48(0.01) | 0.42(0.01) | 18.35 | |||||
| 1.68(0.25) | 57.16(0.04) | 0.60(0.11) | 2.63 | |||||
| G34.39+0.22 | 6.54(2.51) | 57.15(0.33) | 2.26(0.81) | 2.72 | 0.48 | 11.95 | 3.7 | 5.1 |
| 1.87(0.95) | 58.28(0.06) | 0.81(0.28) | 2.15 | |||||
| 3.55(0.73) | 60.00(0.15) | 1.61(0.26) | 2.06 | |||||
| G34.41+0.24 | 3.90(1.18) | 55.89(0.13) | 1.38(0.23) | 2.66 | 0.49 | 43.05 | 3.7 | 18.5 |
| 13.09(1.65) | 57.78(0.06) | 2.03(0.27) | 6.06 | |||||
| 1.85(0.69) | 59.49(0.07) | 0.87(0.20) | 1.99 | |||||
| 24.22(1.26) | 58.18(0.16) | 8.77(0.46) | 2.59 | |||||
| G35.04-0.47 | 0.54(0.18) | 50.81(0.05) | 0.36(0.12) | 1.43 | 0.47 | 4.27 | 3.4 | 1.5 |
| 1.95(0.31) | 51.54(0.04) | 0.64(0.11) | 2.84 | |||||
| 1.13(0.54) | 52.77(0.17) | 1.04(0.60) | 1.02 | |||||
| 0.65(0.38) | 53.74(0.12) | 0.57(0.25) | 1.07 | |||||
| G35.13-0.74 | 19.70(1.22) | 33.81(0.16) | 5.93(0.30) | 3.12 | 0.53 | 38.11 | 2.5 | 7.5 |
| 2.94(0.57) | 33.41(0.04) | 0.57(0.08) | 4.80 | |||||
| 4.25(1.53) | 34.39(0.10) | 0.94(0.35) | 4.25 | |||||
| 1.99(0.71) | 35.00(0.03) | 0.41(0.10) | 4.60 | |||||
| 5.40(0.84) | 35.64(0.03) | 0.77(0.13) | 6.58 | |||||
| 3.83(0.49) | 36.59(0.03) | 0.65(0.07) | 5.55 | |||||
| G35.20-0.74 | 5.18(0.98) | 32.15(0.17) | 1.87(0.35) | 2.60 | 0.58 | 41.65 | 2.5 | 8.2 |
| 11.18(1.93) | 33.90(0.06) | 1.24(0.14) | 8.49 | |||||
| 1.96(0.38) | 34.87(0.01) | 0.30(0.04) | 6.17 | |||||
| 23.33(1.73) | 35.37(0.05) | 1.47(0.08) | 14.90 | |||||
| G35.79-0.17 | 1.43(0.36) | 59.92(0.02) | 0.36(0.07) | 3.73 | 0.66 | 19.21 | 3.9 | 9.2 |
| 1.34(0.79) | 60.87(0.08) | 0.66(0.23) | 1.91 | |||||
| 3.17(1.55) | 62.16(0.09) | 1.18(0.30) | 2.53 | |||||
| 12.48(2.32) | 61.52(0.20) | 4.33(0.70) | 2.71 | |||||
| 0.79(0.41) | 64.65(0.11) | 0.66(0.30) | 1.12 | |||||
| G39.10+0.49 | 1.10(0.24) | 21.59(0.04) | 0.47(0.10) | 2.21 | 0.58 | 17.26 | 2.0 | 2.2 |
| 5.47(0.82) | 23.12(0.37) | 4.67(0.82) | 1.10 | |||||
| 10.69(0.47) | 26.31(0.01) | 1.02(0.04) | 9.80 | |||||
| G39.39-0.14 | 2.15(0.59) | 65.62(0.31) | 2.23(0.56) | 0.91 | 0.57 | 3.90 | 4.5 | 2.5 |
| 0.66(0.46) | 65.97(0.11) | 0.38(0.23) | 1.61 | |||||
| 1.09(0.45) | 66.42(0.06) | 0.38(0.13) | 2.71 | |||||
| G40.28-0.22 | 30.10(0.54) | 72.77(0.00) | 0.53(0.01) | 53.21 | 0.48 | 124.20 | 5.3 | 109.4 |
| 79.45(0.66) | 73.31(0.01) | 1.57(0.01) | 47.61 | |||||
| 14.64(0.29) | 75.27(0.01) | 0.93(0.02) | 14.84 | |||||
| G40.60-0.72 | 1.37(0.43) | 62.98(0.04) | 0.55(0.12) | 2.32 | 0.49 | 20.37 | 4.5 | 12.9 |
| 8.97(1.06) | 64.21(0.02) | 0.97(0.06) | 8.72 | |||||
| 10.03(1.41) | 64.52(0.15) | 2.91(0.23) | 3.24 | |||||
| G45.80-0.36 | 8.22(0.41) | 58.06(0.06) | 2.45(0.15) | 3.15 | 0.48 | 9.89 | 4.8 | 7.1 |
| 0.47(0.17) | 59.96(0.05) | 0.33(0.12) | 1.34 | |||||
| 1.20(0.21) | 60.85(0.05) | 0.67(0.13) | 1.67 | |||||
| G49.07-0.33 | 1.72(0.23) | 61.43(0.06) | 0.86(0.13) | 1.88 | 0.51 | 2.93 | 5.0 | 2.3 |
| 1.21(0.25) | 69.50(0.10) | 1.02(0.24) | 1.12 | |||||
| G54.45+1.01 | 2.04(0.41) | 36.90(0.06) | 0.61(0.13) | 3.13 | 0.64 | 3.20 | 4.0 | 1.6 |
| 1.17(0.37) | 39.13(0.09) | 0.50(0.15) | 2.17 | |||||
| G59.79+0.63 | 1.66(0.31) | 27.62(0.06) | 0.66(0.14) | 2.37 | 0.76 | 29.35 | 4.0 | 14.7 |
| 11.31(0.36) | 30.89(0.01) | 0.55(0.02) | 19.29 | |||||
| 16.38(1.01) | 33.53(0.16) | 5.33(0.37) | 2.89 | |||||
| G305.48-0.10 | 6.28(0.57) | -38.23(0.11) | 2.53(0.27) | 2.33 | 0.72 | 7.05 | 4.6 | 4.7 |
| 0.77(0.20) | -35.86(0.03) | 0.28(0.08) | 2.58 | |||||
| G305.52+0.76 | 1.50(0.46) | -29.91(0.13) | 1.01(0.29) | 1.40 | 0.61 | 6.04 | 2.8 | 1.5 |
| 4.54(0.55) | -28.09(0.10) | 1.79(0.26) | 2.38 | |||||
| G305.80-0.24 | 4.65(1.02) | -34.21(0.21) | 2.00(0.46) | 2.18 | 0.69 | 13.56 | 3.2 | 4.4 |
| 4.40(1.48) | -32.17(0.12) | 1.37(0.44) | 3.02 | |||||
| 1.29(0.90) | -31.01(0.13) | 0.71(0.35) | 1.71 | |||||
| 0.97(0.28) | -30.24(0.04) | 0.34(0.10) | 2.68 | |||||
| 2.25(0.51) | -28.32(0.21) | 1.98(0.53) | 1.07 | |||||
| G305.82-0.11 | 0.62(0.29) | -44.34(0.17) | 0.79(0.40) | 0.74 | 0.62 | 11.17 | 4.4 | 6.8 |
| 7.69(1.09) | -41.12(0.19) | 2.79(0.42) | 2.59 | |||||
| 2.48(0.77) | -39.51(0.05) | 0.84(0.17) | 2.77 | |||||
| 0.38(0.18) | -38.69(0.05) | 0.23(0.11) | 1.52 | |||||
| G305.89+0.02 | 7.56(0.87) | -34.93(0.07) | 1.23(0.13) | 5.78 | 0.59 | 16.89 | 3.4 | 6.1 |
| 7.07(0.93) | -33.70(0.04) | 0.96(0.11) | 6.94 | |||||
| 1.11(0.30) | -32.63(0.06) | 0.52(0.14) | 2.00 | |||||
| 1.14(0.22) | -31.47(0.05) | 0.57(0.13) | 1.90 | |||||
| G309.91+0.32 | 22.81(0.65) | -61.20(0.01) | 0.64(0.02) | 33.63 | 0.72 | 31.81 | 5.0 | 24.9 |
| 3.74(0.78) | -60.43(0.05) | 0.68(0.13) | 5.20 | |||||
| 5.26(0.49) | -59.14(0.05) | 1.17(0.13) | 4.22 | |||||
| G310.15+0.76 | 1.04(0.23) | -58.42(0.04) | 0.40(0.10) | 2.42 | 0.62 | 19.45 | 5.0 | 15.2 |
| 3.44(0.29) | -57.61(0.03) | 0.67(0.07) | 4.82 | |||||
| 2.71(0.29) | -56.47(0.02) | 0.51(0.05) | 5.02 | |||||
| 8.93(0.50) | -55.33(0.02) | 1.08(0.07) | 7.74 | |||||
| 3.34(0.49) | -53.42(0.11) | 1.59(0.28) | 1.97 | |||||
| G310.38-0.30 | 0.83(0.22) | -55.09(0.07) | 0.52(0.17) | 1.50 | 0.56 | 8.41 | 5.2 | 7.1 |
| 4.03(0.39) | -54.33(0.01) | 0.41(0.03) | 9.22 | |||||
| 3.55(0.45) | -53.55(0.06) | 0.96(0.14) | 3.46 | |||||
| G311.04+0.69 | 0.90(0.15) | 24.66(0.03) | 0.38(0.07) | 2.21 | 0.50 | 0.90 | 12.7 | 4.5 |
| G311.51-0.45 | 2.98(0.70) | -50.91(0.21) | 1.88(0.50) | 1.49 | 0.61 | 2.98 | 4.6 | 2.0 |
| G313.76-0.86 | 7.49(0.85) | -50.55(0.01) | 0.54(0.04) | 12.94 | 0.70 | 36.28 | 4.0 | 18.2 |
| 8.81(2.01) | -49.78(0.11) | 1.67(0.24) | 4.95 | |||||
| 17.59(1.78) | -49.80(0.21) | 6.70(0.64) | 2.47 | |||||
| 0.51(0.22) | -47.45(0.04) | 0.25(0.11) | 1.91 | |||||
| 1.88(0.26) | -46.69(0.02) | 0.36(0.05) | 4.84 | |||||
| G317.87-0.15 | 2.09(0.63) | -42.36(0.14) | 1.27(0.38) | 1.55 | 0.64 | 15.75 | 3.0 | 4.4 |
| 0.95(0.32) | -41.40(0.03) | 0.34(0.09) | 2.65 | |||||
| 2.60(0.72) | -40.19(0.13) | 1.50(0.38) | 1.63 | |||||
| 10.11(1.33) | -39.80(0.58) | 9.88(1.42) | 0.96 | |||||
| G317.88-0.25 | 1.63(0.39) | -38.63(0.10) | 0.87(0.24) | 1.76 | 0.50 | 13.15 | 2.6 | 2.8 |
| 0.81(0.41) | -37.86(0.06) | 0.44(0.16) | 1.73 | |||||
| 5.29(0.49) | -36.88(0.03) | 1.00(0.11) | 4.96 | |||||
| 5.41(0.39) | -35.53(0.03) | 0.98(0.08) | 5.17 | |||||
| G320.23-0.28 | 0.52(0.23) | -67.28(0.05) | 0.32(0.14) | 1.52 | 0.62 | 7.61 | 4.6 | 5.0 |
| 1.49(0.28) | -66.03(0.02) | 0.36(0.06) | 3.91 | |||||
| 5.15(0.65) | -65.60(0.14) | 2.40(0.36) | 2.02 | |||||
| 0.45(0.20) | -63.78(0.05) | 0.29(0.13) | 1.48 | |||||
| G321.94-0.01 | 0.86(0.33) | -35.35(0.03) | 0.26(0.09) | 3.14 | 0.85 | 35.35 | 2.4 | 6.4 |
| 9.07(1.53) | -34.19(0.10) | 1.52(0.28) | 5.62 | |||||
| 0.94(0.34) | -33.37(0.05) | 0.35(0.16) | 2.52 | |||||
| 19.05(2.20) | -32.41(0.03) | 1.24(0.08) | 14.42 | |||||
| 5.43(2.50) | -30.50(0.77) | 3.40(1.44) | 1.50 | |||||
| G324.19+0.41 | 2.96(0.34) | -52.48(0.06) | 1.18(0.17) | 2.35 | 0.56 | 3.65 | 3.5 | 1.4 |
| 0.70(0.21) | -51.41(0.04) | 0.34(0.10) | 1.93 | |||||
| G326.32-0.39 | 24.40(0.79) | -72.48(0.04) | 3.31(0.12) | 6.92 | 0.59 | 35.14 | 4.5 | 22.3 |
| 2.04(0.31) | -73.08(0.02) | 0.39(0.05) | 4.86 | |||||
| 7.72(0.49) | -72.43(0.01) | 0.55(0.03) | 13.18 | |||||
| 0.72(0.20) | -71.33(0.03) | 0.26(0.07) | 2.61 | |||||
| 0.25(0.15) | -69.96(0.05) | 0.20(0.14) | 1.17 | |||||
| G326.41+0.93 | 1.73(0.37) | -44.41(0.16) | 1.56(0.38) | 1.04 | 0.56 | 9.80 | 2.8 | 2.4 |
| 8.07(0.49) | -40.82(0.08) | 2.85(0.21) | 2.66 | |||||
| G326.61+0.80 | 9.09(0.65) | -37.72(0.11) | 4.04(0.35) | 2.11 | 0.48 | 11.48 | 2.7 | 2.6 |
| 1.63(0.48) | -37.92(0.06) | 0.86(0.20) | 1.79 | |||||
| 0.76(0.22) | -37.03(0.04) | 0.39(0.10) | 1.85 | |||||
| G326.92-0.31 | 1.61(1.12) | -46.76(0.58) | 1.68(1.06) | 0.90 | 0.53 | 4.19 | 3.1 | 1.3 |
| 1.45(0.91) | -45.81(0.05) | 0.64(0.21) | 2.12 | |||||
| 1.13(0.26) | -44.65(0.07) | 0.70(0.17) | 1.53 | |||||
| G326.97-0.03 | 1.71(0.37) | -61.29(0.06) | 0.62(0.13) | 2.58 | 0.52 | 8.86 | 3.9 | 4.2 |
| 2.31(0.47) | -60.40(0.06) | 0.78(0.17) | 2.80 | |||||
| 3.11(0.40) | -58.78(0.08) | 1.43(0.23) | 2.04 | |||||
| 0.74(0.17) | -57.27(0.04) | 0.37(0.10) | 1.85 | |||||
| 0.99(0.25) | -55.16(0.12) | 0.96(0.28) | 0.97 | |||||
| G327.57-0.85 | 13.76(0.35) | -37.04(0.00) | 0.52(0.01) | 24.96 | 0.67 | 24.28 | 2.6 | 5.1 |
| 10.51(0.71) | -35.95(0.11) | 3.14(0.21) | 3.14 | |||||
| G327.72-0.38 | 1.63(0.27) | -73.31(0.06) | 0.73(0.14) | 2.10 | 0.64 | 1.63 | 4.5 | 1.0 |
| G327.89+0.15 | 1.84(0.22) | -92.76(0.04) | 0.60(0.09) | 2.87 | 0.56 | 8.66 | 5.5 | 8.2 |
| 0.63(0.23) | -91.81(0.06) | 0.42(0.16) | 1.40 | |||||
| 6.19(0.38) | -90.49(0.04) | 1.40(0.11) | 4.14 | |||||
| G328.16+0.59 | 1.85(0.19) | -93.03(0.02) | 0.47(0.05) | 3.72 | 0.57 | 1.85 | 5.7 | 1.9 |
| G328.55+0.27 | 33.39(0.32) | -59.45(0.00) | 0.82(0.01) | 38.03 | 0.67 | 35.70 | 3.8 | 16.2 |
| 2.31(0.22) | -58.48(0.02) | 0.36(0.04) | 6.12 | |||||
| G329.16-0.29 | 4.21(0.41) | -49.99(0.07) | 1.42(0.16) | 2.79 | 0.56 | 5.53 | 3.3 | 1.9 |
| 1.32(0.40) | -48.04(0.18) | 1.27(0.44) | 0.97 | |||||
| G329.47+0.52 | 2.18(0.81) | -68.84(0.29) | 1.72(0.59) | 1.19 | 0.57 | 5.89 | 14.6 | 39.4 |
| 3.71(0.81) | -66.73(0.18) | 1.81(0.39) | 1.92 | |||||
| G330.88-0.37 | 38.02(1.38) | -61.20(0.15) | 8.20(0.32) | 4.36 | 0.90 | 45.38 | 3.8 | 20.5 |
| 7.35(0.41) | -57.92(0.01) | 0.64(0.04) | 10.86 | |||||
| G331.37-0.40 | 2.57(0.22) | -64.91(0.03) | 0.66(0.06) | 3.67 | 0.55 | 2.57 | 4.1 | 1.4 |
| G331.62+0.53 | 1.97(0.65) | -53.10(0.32) | 2.04(0.79) | 0.90 | 0.59 | 3.68 | 3.5 | 1.4 |
| 0.81(0.32) | -51.91(0.04) | 0.38(0.12) | 2.03 | |||||
| 0.89(0.33) | -50.72(0.15) | 0.92(0.36) | 0.91 | |||||
| G331.71+0.58 | 50.84(0.28) | -68.07(0.00) | 0.92(0.01) | 52.12 | 0.49 | 67.70 | 4.3 | 39.2 |
| 16.86(0.38) | -66.03(0.02) | 1.82(0.05) | 8.71 | |||||
| G331.71+0.60 | 3.36(0.57) | -68.23(0.03) | 0.56(0.07) | 5.66 | 0.59 | 21.83 | 4.3 | 12.7 |
| 3.32(0.84) | -67.39(0.05) | 0.77(0.20) | 4.04 | |||||
| 1.72(0.59) | -66.48(0.06) | 0.59(0.16) | 2.75 | |||||
| 1.57(0.78) | -65.36(0.12) | 1.03(0.38) | 1.43 | |||||
| 11.86(1.70) | -66.89(0.22) | 5.74(0.73) | 1.94 | |||||
| G332.28-0.55 | 12.77(0.71) | -53.11(0.11) | 4.74(0.32) | 2.53 | 0.54 | 88.89 | 3.6 | 36.1 |
| 5.25(0.31) | -52.37(0.01) | 0.57(0.03) | 8.59 | |||||
| 70.88(0.31) | -53.29(0.00) | 0.56(0.00) | 119.32 | |||||
| G332.35-0.12 | 3.97(0.48) | -50.16(0.04) | 0.68(0.09) | 5.45 | 0.56 | 5.79 | 3.4 | 2.1 |
| 1.14(0.44) | -49.61(0.04) | 0.35(0.09) | 3.10 | |||||
| 0.68(0.17) | -49.08(0.04) | 0.30(0.09) | 2.11 | |||||
| G332.36+0.60 | 3.56(0.35) | -43.10(0.02) | 0.50(0.05) | 6.64 | 0.75 | 12.97 | 3.1 | 3.9 |
| 9.41(0.81) | -42.11(0.17) | 3.89(0.35) | 2.27 | |||||
| G332.58+0.15 | 1.04(0.32) | -42.29(0.07) | 0.44(0.29) | 2.23 | 0.54 | 1.04 | 3.0 | 0.3 |
| G332.81-0.70 | 9.83(0.20) | -53.51(0.00) | 0.50(0.01) | 18.48 | 0.55 | 24.15 | 3.6 | 9.8 |
| 5.79(1.75) | -52.59(0.05) | 0.50(0.06) | 10.86 | |||||
| 5.25(2.17) | -52.07(0.08) | 0.63(0.19) | 7.83 | |||||
| 3.28(0.67) | -51.21(0.08) | 0.80(0.15) | 3.84 | |||||
| G332.91-0.55 | 1.43(0.35) | -56.23(0.11) | 0.95(0.29) | 1.42 | 0.62 | 2.90 | 3.7 | 1.2 |
| 0.87(0.23) | -55.37(0.03) | 0.31(0.08) | 2.64 | |||||
| 0.60(0.20) | -54.69(0.07) | 0.42(0.16) | 1.35 | |||||
| G333.32+0.10 | 1.68(0.40) | -49.35(0.12) | 1.12(0.29) | 1.41 | 0.62 | 13.63 | 3.3 | 4.7 |
| 5.91(0.53) | -47.19(0.07) | 1.82(0.21) | 3.06 | |||||
| 5.40(0.43) | -44.30(0.06) | 1.66(0.16) | 3.06 | |||||
| 0.63(0.18) | -42.25(0.05) | 0.37(0.12) | 1.60 | |||||
| G335.59-0.30 | 2.07(0.40) | -47.34(0.10) | 1.14(0.24) | 1.71 | 0.52 | 6.04 | 3.3 | 2.1 |
| 1.11(0.62) | -46.06(0.08) | 0.65(0.23) | 1.61 | |||||
| 1.09(0.47) | -45.23(0.04) | 0.43(0.12) | 2.39 | |||||
| 1.76(1.29) | -44.36(0.89) | 2.45(1.66) | 0.68 | |||||
| G336.02-0.83 | 62.43(0.39) | -48.43(0.00) | 0.87(0.01) | 67.77 | 0.53 | 97.07 | 3.5 | 37.3 |
| 34.64(0.90) | -47.17(0.09) | 6.96(0.20) | 4.68 | |||||
| G336.03-0.82 | 3.71(0.79) | -46.24(0.08) | 0.75(0.15) | 4.66 | 0.64 | 6.17 | 3.3 | 2.1 |
| 1.29(0.76) | -45.61(0.09) | 0.50(0.17) | 2.44 | |||||
| 1.17(0.26) | -44.15(0.08) | 0.72(0.19) | 1.52 | |||||
| G336.96-0.98 | 0.62(0.23) | -45.31(0.05) | 0.32(0.11) | 1.85 | 0.59 | 6.72 | 3.3 | 2.3 |
| 3.19(0.62) | -44.49(0.06) | 0.81(0.18) | 3.72 | |||||
| 2.16(0.59) | -43.64(0.05) | 0.59(0.14) | 3.45 | |||||
| 0.74(0.34) | -42.63(0.17) | 0.80(0.44) | 0.87 | |||||
| G337.30-0.87 | 2.75(0.32) | -94.03(0.07) | 1.31(0.18) | 1.97 | 0.58 | 2.75 | 5.4 | 2.5 |
| G338.32-0.41 | 0.40(0.16) | -39.11(0.06) | 0.32(0.14) | 1.18 | 0.44 | 5.36 | 3.1 | 1.6 |
| 2.52(0.22) | -38.56(0.01) | 0.43(0.04) | 5.56 | |||||
| 2.43(0.25) | -37.57(0.05) | 0.96(0.12) | 2.38 | |||||
| G339.58-0.13 | 6.90(1.84) | -34.53(0.25) | 1.93(0.40) | 3.36 | 0.54 | 27.31 | 2.8 | 6.7 |
| 2.40(1.20) | -33.73(0.05) | 0.64(0.15) | 3.55 | |||||
| 8.48(1.15) | -32.76(0.04) | 1.08(0.12) | 7.34 | |||||
| 9.52(0.57) | -31.18(0.04) | 1.35(0.09) | 6.60 | |||||
| G339.95-0.54 | 2.88(0.37) | -94.64(0.04) | 0.74(0.09) | 3.63 | 0.49 | 15.30 | 5.5 | 14.5 |
| 3.73(0.47) | -93.45(0.05) | 1.11(0.14) | 3.15 | |||||
| 8.69(0.78) | -94.40(0.32) | 7.97(0.87) | 1.02 | |||||
| G340.05-0.25 | 0.55(0.16) | -57.01(0.06) | 0.44(0.15) | 1.17 | 0.50 | 8.38 | 3.9 | 4.0 |
| 2.43(0.42) | -55.02(0.11) | 1.29(0.27) | 1.77 | |||||
| 0.65(0.35) | -54.05(0.06) | 0.43(0.17) | 1.43 | |||||
| 2.69(0.60) | -52.99(0.08) | 1.18(0.24) | 2.15 | |||||
| 2.07(0.58) | -51.04(0.27) | 2.02(0.65) | 0.96 | |||||
| G340.97-1.02 | 107.93(1.50) | -24.35(0.03) | 5.61(0.06) | 18.07 | 0.52 | 218.65 | 2.3 | 36.3 |
| 62.23(2.89) | -23.88(0.03) | 1.52(0.03) | 38.41 | |||||
| 42.05(2.24) | -23.29(0.00) | 0.71(0.01) | 55.52 | |||||
| 6.45(0.50) | -21.83(0.02) | 0.78(0.05) | 7.81 | |||||
| G341.22-0.26 | 2.99(0.49) | -44.58(0.03) | 0.55(0.08) | 5.14 | 0.89 | 17.20 | 3.6 | 7.0 |
| 14.21(0.97) | -44.13(0.12) | 3.82(0.30) | 3.50 | |||||
| G341.24-0.27 | 12.69(2.08) | -44.90(0.29) | 3.50(0.46) | 3.40 | 0.83 | 27.19 | 3.5 | 10.4 |
| 11.10(1.05) | -43.78(0.02) | 0.75(0.05) | 13.82 | |||||
| 1.86(0.54) | -43.02(0.04) | 0.41(0.10) | 4.23 | |||||
| 1.55(0.65) | -42.33(0.06) | 0.52(0.17) | 2.79 | |||||
| G342.15+0.51 | 2.37(0.44) | -84.53(0.14) | 1.56(0.33) | 1.43 | 0.42 | 2.37 | 5.3 | 2.1 |
| G342.48+0.18 | 7.01(0.80) | -42.39(0.09) | 1.56(0.20) | 4.21 | 0.54 | 13.98 | 3.6 | 5.7 |
| 0.84(0.25) | -42.43(0.02) | 0.27(0.06) | 2.93 | |||||
| 4.84(0.80) | -40.76(0.09) | 1.31(0.17) | 3.47 | |||||
| 1.29(0.27) | -37.34(0.11) | 1.08(0.26) | 1.12 | |||||
| G343.50+0.03 | 1.94(0.23) | -31.78(0.04) | 0.73(0.10) | 2.48 | 0.53 | 4.89 | 3.1 | 1.5 |
| 0.75(0.28) | -30.63(0.05) | 0.42(0.13) | 1.68 | |||||
| 2.20(0.49) | -29.34(0.19) | 1.85(0.50) | 1.12 | |||||
| G343.50-0.47 | 1.96(0.25) | -35.74(0.03) | 0.57(0.08) | 3.24 | 0.50 | 28.72 | 3.2 | 9.2 |
| 5.34(0.81) | -34.67(0.05) | 0.79(0.12) | 6.34 | |||||
| 11.59(0.87) | -33.95(0.01) | 0.54(0.03) | 19.99 | |||||
| 9.83(0.39) | -33.14(0.01) | 0.72(0.03) | 12.81 | |||||
| G343.53-0.51 | 1.75(0.49) | -34.77(0.41) | 2.85(0.75) | 0.58 | 0.46 | 2.51 | 3.2 | 0.8 |
| 0.76(0.26) | -33.68(0.06) | 0.53(0.16) | 1.35 | |||||
| G345.13-0.17 | 9.18(0.63) | -25.79(0.09) | 3.38(0.27) | 2.55 | 0.52 | 17.77 | 2.8 | 4.4 |
| 2.19(0.38) | -26.39(0.03) | 0.46(0.07) | 4.43 | |||||
| 6.41(0.49) | -25.74(0.02) | 0.62(0.04) | 9.74 | |||||
| G345.99-0.02 | 1.34(0.22) | -82.83(0.04) | 0.52(0.10) | 2.42 | 0.65 | 1.91 | 5.6 | 1.9 |
| 0.57(0.15) | -81.43(0.03) | 0.24(0.07) | 2.27 | |||||
| G348.17+0.46 | 8.90(2.30) | -8.35(0.25) | 1.93(0.39) | 4.33 | 0.72 | 54.21 | 1.3 | 2.9 |
| 26.04(1.94) | -7.43(0.01) | 0.70(0.03) | 35.13 | |||||
| 12.57(1.13) | -6.56(0.02) | 0.71(0.07) | 16.61 | |||||
| 1.70(0.79) | -5.83(0.06) | 0.48(0.15) | 3.31 | |||||
| 5.00(0.60) | -4.85(0.07) | 1.20(0.17) | 3.91 | |||||
| G348.55-0.98 | 41.47(0.92) | -16.53(0.05) | 4.91(0.10) | 7.93 | 0.54 | 89.61 | 2.4 | 16.2 |
| 29.32(0.48) | -16.10(0.00) | 0.84(0.01) | 32.93 | |||||
| 18.82(0.45) | -14.86(0.01) | 0.85(0.02) | 20.87 | |||||
| G348.58-0.92 | 3.92(1.40) | -15.30(0.41) | 2.32(0.72) | 1.59 | 0.73 | 15.23 | 2.2 | 2.3 |
| 6.57(0.97) | -14.22(0.02) | 0.68(0.06) | 9.12 | |||||
| 3.39(0.49) | -12.26(0.08) | 1.20(0.19) | 2.65 | |||||
| 1.35(0.29) | -9.63(0.07) | 0.69(0.17) | 1.84 | |||||
| G348.73-1.04 | 18.17(1.59) | -12.13(0.31) | 7.95(0.66) | 2.15 | 0.73 | 42.84 | 1.6 | 3.4 |
| 9.79(1.85) | -11.64(0.10) | 1.28(0.19) | 7.16 | |||||
| 4.42(1.79) | -10.61(0.07) | 0.81(0.22) | 5.12 | |||||
| 2.52(1.06) | -9.83(0.04) | 0.44(0.11) | 5.33 | |||||
| 7.93(1.08) | -9.17(0.05) | 0.91(0.11) | 8.21 | |||||
Note. — Column (1): source name. Columns (2)-(5): the integrated flux density S, the velocity at peak maser emission VLSR, the line width (FWHM) V, and the peak flux density P, of each maser feature estimated from Gaussian fits to 95 GHz class I methanol maser lines, the formal error from the Gaussian fit is given in parenthesis. The corresponding values in main beam temperature TMB (K) can be obtained by dividing the flux density by a factor of 9.3 (see Section 2.2). Column (6): 1 noise in the observed maser spectrum. Column (7): the total integrated flux density Sint of the maser spectrum obtained from summing the integrated flux density of all maser features in each source in column (2). Column (8): the kinematic distance to source estimated from galactic rotation curve of Reid et al. (2009). The distances to G49.07-0.33, G309.91+0.32, G310.15+0.76 which cannot be derived from the galactic rotation curve are assumed to be 5 kpc. Column (9): the integrated luminosity of 95 GHz methanol maser estimated with assuming maser isotropic emission, i.e. Lm=4D2Sint.
(This table is available in its entirety in a machine-readable form in the online journal. A portion is shown here for guidance regarding its form and content.)
| Source | (Jy) | Source | (Jy) | Source | (Jy) | Source | (Jy) |
|---|---|---|---|---|---|---|---|
| G11.11-0.11 | 0.71 | G12.02-0.21 | 0.61 | G16.58-0.08 | 0.56 | G17.96+0.08 | 0.60 |
| G19.61-0.12 | 0.45 | G20.24+0.07 | 0.63 | G21.24+0.19 | 0.63 | G24.17-0.02 | 0.52 |
| G28.28-0.36 | 0.48 | G28.85-0.23 | 0.45 | G29.89-0.77 | 0.45 | G29.91-0.81 | 0.52 |
| G29.96-0.79 | 0.56 | G35.15+0.80 | 0.45 | G35.68-0.18 | 0.56 | G36.01-0.20 | 0.63 |
| G37.48-0.10 | 0.60 | G37.55+0.20 | 0.56 | G40.28-0.27 | 0.48 | G44.01-0.03 | 0.47 |
| G45.47+0.05 | 0.48 | G45.50+0.12 | 0.48 | G48.66-0.30 | 0.47 | G49.42+0.33 | 0.50 |
| G53.92-0.07 | 0.58 | G54.11-0.04 | 0.74 | G54.11-0.08 | 0.60 | G57.61+0.02 | 0.74 |
| G298.90+0.36 | 0.58 | G304.89+0.64 | 0.61 | G305.57-0.34 | 0.43 | G305.62-0.34 | 0.65 |
| G305.77-0.25 | 0.71 | G309.15-0.35 | 0.39 | G309.90+0.23 | 0.69 | G309.97+0.50 | 0.56 |
| G309.97+0.59 | 0.67 | G309.99+0.51 | 0.63 | G310.08-0.23 | 0.65 | G312.11+0.26 | 0.61 |
| G313.71-0.19 | 0.41 | G317.44-0.37 | 0.63 | G317.46-0.40 | 0.65 | G324.11+0.44 | 0.71 |
| G324.17+0.44 | 0.58 | G325.52+0.42 | 0.61 | G326.27-0.49 | 0.48 | G326.31+0.90 | 0.56 |
| G326.36+0.88 | 0.67 | G326.37+0.94 | 0.54 | G326.57+0.20 | 0.71 | G326.78-0.24 | 0.86 |
| G326.79+0.38 | 0.47 | G326.80+0.51 | 0.52 | G327.65+0.13 | 0.61 | G327.86+0.19 | 0.45 |
| G328.60+0.27 | 0.60 | G331.08-0.47 | 0.43 | G331.12-0.46 | 0.50 | G331.51-0.34 | 0.50 |
| G332.12+0.94 | 0.52 | G332.28-0.07 | 0.50 | G332.33-0.12 | 0.65 | G332.47-0.52 | 0.67 |
| G332.59+0.04 | 0.45 | G333.08-0.56 | 0.61 | G334.04+0.35 | 0.63 | G335.43-0.24 | 0.50 |
| G336.87+0.29 | 0.61 | G337.16-0.39 | 0.58 | G340.07-0.24 | 0.58 | G340.10-0.18 | 0.52 |
| G340.75-1.00 | 0.45 | G340.77-0.12 | 0.48 | G338.39-0.40 | 0.50 | G338.42-0.41 | 0.48 |
| G341.20-0.26 | 0.48 | G341.99-0.10 | 0.47 | G342.04+0.43 | 0.45 | G343.19-0.08 | 0.47 |
| G343.40-0.40 | 0.48 | G343.42-0.37 | 0.54 | G343.72-0.18 | 0.56 | G343.78-0.24 | 0.56 |
| G344.21-0.62 | 0.43 | G345.72+0.82 | 0.63 | G346.04+0.05 | 0.63 |
| Source Properties | NDa | NTa | Detection rate |
|---|---|---|---|
| Likely outflow | 53 | 86 | 62% |
| Possible outflow | 52 | 106 | 49% |
| IRDC | 71 | 128 | 55% |
| Non-IRDC | 34 | 64 | 53% |
| With associated class II maser | 39 | 49 | 80% |
| Without associated class II maser | 31 | 81 | 38% |
| With associated OH maser | 13 | 14 | 93% |
| Without associated OH maser | 43 | 90 | 48% |
| With associated UC Hii region | 11 | 13 | 85% |
| Without associated UC Hii region | 21 | 34 | 62% |
| With associated 1.1 mm | 35 | 54 | 65% |
| Without associated 1.1 mm | 1 | 9 | 11% |
| Source | Class IIa | Class Ib | Remarkc | Source | Class IIa | Class Ib | Remarkc |
|---|---|---|---|---|---|---|---|
| G14.33-0.64d | Y | Y | 1 | G331.34-0.35fh | Y | Y | 4 |
| G16.59-0.05h | Y | Y | 2 | G332.29-0.09h | Y | Y | 4 |
| G23.01-0.41 | Y | Y | 1 | G332.35-0.44i | Y | N | 4 |
| G28.83-0.25e | Y | N | 1 | G332.56-0.15e | Y | N | 1 |
| G43.04-0.45 | Y | – | 4 | G332.60-0.17h | Y | Y | 2 |
| G298.26+0.74 | Y | – | 1 | G332.73-0.62 | Y | – | 2 |
| G309.38-0.13 | Y | Y | 1 | G332.94-0.69d | Y | Y | 1 |
| G318.05+0.09fi | Y | N | 2 | G332.96-0.68d | Y | Y | 1 |
| G323.74-0.26h | Y | Y | 4 | G333.13-0.56h | Y | Y | 4 |
| G324.72+0.34 | Y | Y | 1 | G333.18-0.09 | Y | Y | 1 |
| G326.48+0.70h | Y | Y | 2 | G333.47-0.16h | Y | Y | 2 |
| G326.86-0.67 | Y | Y | 1 | G335.06-0.43h | Y | Y | 2 |
| G327.12+0.51e | Y | N | 1 | G335.59-0.29 | Y | Y | 1 |
| G327.30-0.58d | Y | Y | 3 | G335.79+0.18i | Y | N | 2 |
| G327.39+0.20d | Y | Y | 1 | G337.40-0.40h | Y | Y | 4 |
| G327.40+0.44e | Y | N | 1 | G337.91-0.48 | – | Y | 2 |
| G328.25-0.53fh | Y | Y | 2 | G338.92+0.55h | Y | Y | 4 |
| G328.81+0.63h | Y | Y | 4 | G340.06-0.23 | N | – | 4 |
| G329.03-0.20h | Y | Y | 2 | G340.78-0.10 | Y | – | 3 |
| G329.07-0.31df | Y | Y | 3 | G343.12-0.06d | N | Y | 1 |
| G329.18-0.31 | Y | Y | 1 | G344.23-0.57fh | Y | Y | 2 |
| G329.41-0.46i | Y | N | 2 | G344.58-0.02 | Y | – | 1 |
| G329.47+0.50h | Y | Y | 2 | G345.00-0.22h | Y | Y | 4 |
| G329.61+0.11eg | Y | N | 1 | G345.51+0.35h | Y | Y | 5 |
| G330.95-0.18i | Y | N | 4 | G348.18+0.48f | N | N | 4 |
| G331.13-0.24h | Y | Y | 2 |
| EGO name | BGPS namea | Robj | Sv(int)b | Mc | n(H2)c | N(H2)d | Avd |
|---|---|---|---|---|---|---|---|
| (′′) | (Jy) | (M⊙) | (103 cm-3) | (1022 cm-2) | |||
| G10.290.13h | G010.28600.120 | 68 | 9.41 | 1100 | 10.5 | 3.3 | 33 |
| G10.340.14h | G010.34300.144 | 85 | 8.58 | 1000 | 5.0 | 1.9 | 19 |
| G12.200.03fh | G012.20100.034 | 53 | 2.06 | 940 | 3.2 | 1.2 | 12 |
| G12.420.50j | G012.419+00.506 | 51 | 0.76 | 99 | 6.8 | 0.5 | 5 |
| G12.680.18h | G012.68100.182 | 86 | 11.82 | 5900 | 5.6 | 2.6 | 26 |
| G12.910.03eh† | G012.90500.030 | 65 | 3.56 | 1800 | 2.2 | 1.4 | 14 |
| G12.910.26h | G012.90900.260 | 79 | 15.85 | 5200 | 1.7 | 4.1 | 41 |
| G14.630.58fh† | G014.63300.574 | 72 | 10.20 | 1100 | 5.4 | 3.2 | 32 |
| IRDC182233j | G018.60800.074 | 71 | 2.18 | 640 | 2.5 | 0.7 | 7 |
| G18.670.03eh† | G018.66600.032 | 57 | 2.49 | 1500 | 1.5 | 1.3 | 13 |
| G18.890.47eh† | G018.88800.475 | 101 | 9.85 | 4500 | 3.2 | 1.6 | 16 |
| G19.010.03eh† | G019.01000.029 | 44 | 2.40 | 960 | 7.7 | 2.0 | 20 |
| G19.360.03h | G019.36400.031 | 96 | 6.82 | 960 | 7.6 | 1.2 | 12 |
| G19.880.53fh† | G019.88400.535 | 41 | 5.22 | 1400 | 3.2 | 5.1 | 51 |
| G22.040.22eh† | G022.04100.221 | 88 | 4.68 | 1400 | 1.7 | 1.0 | 10 |
| G23.820.38i | G023.81800.384 | 19 | 0.59 | 280 | 2.7 | 2.8 | 28 |
| G23.960.11eh† | G023.96800.110 | 57 | 3.35 | 1500 | 2.5 | 1.7 | 17 |
| G24.000.10eh† | G023.99600.100 | 36 | 1.87 | 820 | 2.0 | 2.4 | 24 |
| G24.110.17j | G024.11600.174 | 77 | 2.48 | 1300 | 2.2 | 0.7 | 7 |
| G24.330.14eh | G024.32900.142 | 42 | 4.38 | 3800 | 1.4 | 4.0 | 40 |
| G24.630.15fj† | G024.63200.155 | 50 | 1.98 | 550 | 18.5 | 1.3 | 13 |
| G24.940.07h† | G024.94300.075 | 49 | 1.40 | 280 | 16.1 | 0.9 | 9 |
| G25.270.43fh† | G025.26600.439 | 67 | 2.38 | 820 | 12.7 | 0.9 | 9 |
| G25.380.15fi | G025.38800.147 | 34 | 3.17 | 2100 | 14.8 | 4.6 | 46 |
| G27.970.47j† | G027.96900.474 | 60 | 1.32 | 290 | 5.1 | 0.6 | 6 |
| G34.260.15i | G034.258+00.154 | 103 | 78.55 | 27000 | 3.4 | 11.9 | 119 |
| G34.280.18i | G034.28300.184 | 17 | 0.77 | 230 | 4.8 | 1.1 | 11 |
| G34.410.24ei | G034.41000.232 | 96 | 20.78 | 6400 | 5.6 | 3.7 | 37 |
| G35.040.47fj† | G035.04500.478 | 98 | 4.71 | 1200 | 12.7 | 0.8 | 8 |
| G35.790.17fi | G035.79400.176 | 54 | 2.60 | 890 | 9.7 | 1.4 | 14 |
| G39.100.49fh† | G039.10000.491 | 50 | 0.81 | 73 | 0.9 | 0.5 | 5 |
| G39.390.14i | G039.38900.143 | 35 | 1.37 | 630 | 3.7 | 1.8 | 18 |
| G40.280.22fi | G040.28300.221 | 35 | 3.50 | 2200 | 1.6 | 4.7 | 47 |
| G45.800.36i | G045.80500.355 | 26 | 0.97 | 500 | 1.2 | 2.4 | 24 |
| G49.070.33fj† | G049.06900.328 | 64 | 3.13 | 1800 | 2.0 | 1.2 | 12 |
| G16.590.05gh | G016.58600.051 | 32 | 3.42 | 1700 | 18.6 | 5.5 | 55 |
| G23.010.41gh† | G023.01200.410 | 96 | 12.6 | 9500 | 2.0 | 2.2 | 22 |

![[Uncaptioned image]](/html/1107.2914/assets/x2.png)
Fig. 2.— Continued.
![[Uncaptioned image]](/html/1107.2914/assets/x3.png)
Fig. 2.— Continued.
![[Uncaptioned image]](/html/1107.2914/assets/x4.png)
Fig. 2.— Continued.
![[Uncaptioned image]](/html/1107.2914/assets/x5.png)
Fig. 2.— Continued.
![[Uncaptioned image]](/html/1107.2914/assets/x6.png)
Fig. 2.— Continued.
![[Uncaptioned image]](/html/1107.2914/assets/x7.png)
Fig. 2.— Continued.