Astro Space Center of Lebedev Physical Institute, Profsoyuznaya Str. 84/32, 117997 Moscow, Russia
INAF-IASF Palermo, 90146 Palermo, Italy
INAF-IASF Roma, 00133 Roma, Italy
Department of Physics, University of Washington, Seattle, WA 98195-1560, USA
Cahill Center for Astronomy and Astrophysics, California Institute of Technology, Pasadena, CA 91125, USA
National Research Council Research Associate, National Academy of Sciences, Washington, DC 20001, resident at Naval Research Laboratory, Washington, DC 20375, USA
Laboratoire Leprince-Ringuet, École polytechnique, Route de Saclay, 91128 Palaiseau, France
Laboratoire AIM, CEA-IRFU/CNRS/Université Paris Diderot, Service d’Astrophysique, CEA Saclay, 91191 Gif sur Yvette, France
Kavli Institute for Cosmological Physics, University of Chicago, Chicago, IL 60637, USA
INAF, Osservatorio Astronomico di Torino, I-10025 Pino Torinese (TO), Italy
Institute for Astrophysical Research, Boston University, Boston, MA 02215, USA
Instituto de Astrofísica de Andalucía, CSIC, E-18080 Granada, Spain
Astronomical Institute, St. Petersburg State University, St. Petersburg, Russia
EPT Observatories, Tijarafe, La Palma, Spain
INAF, TNG Fundación Galileo Galilei, La Palma, Spain
Institut de Ciencies de l’Espai (IEEC-CSIC), Campus UAB, 08193 Barcelona, Spain
Harvard-Smithsonian Center for Astrophysics, Cambridge, MA 02138, USA
Graduate Institute of Astronomy, National Central University, Jhongli 32054, Taiwan
Abastumani Observatory, Mt. Kanobili, 0301 Abastumani, Georgia
Isaac Newton Institute of Chile, St. Petersburg Branch, St. Petersburg, Russia
Pulkovo Astronomical Observatory, Pulkovskoe Chaussee 65/1, 196140 St. Petersburg, Russia
Agrupació Astronòmica de Sabadell, 08206 Sabadell, Spain
Special Astrophysical Observatory, Nizhnij Arkhyz, Karachai-Cherkessian Republic, 369167, Russia
11email: schinzel@mpifr-bonn.mpg.de
Identification of -ray emission from 3C 345 and NRAO 512
For more than 15 years, since the days of the Energetic Gamma-Ray Experiment Telescope (EGRET) on board the Compton Gamma-Ray Observatory (CGRO; 1991-2000), it has remained an open question why the prominent blazar 3C 345 was not reliably detected at -ray energies 20 MeV. Recently a bright -ray source (0FGL J1641.4+3939/1FGL J1642.5+3947), potentially associated with 3C 345, was detected by the Large Area Telescope (LAT) on Fermi. Multiwavelength observations from radio bands to X-rays (mainly GASP-WEBT and Swift) of possible counterparts (3C 345, NRAO 512, B3 1640396) were combined with 20 months of Fermi-LAT monitoring data (August 2008 - April 2010) to associate and identify the dominating -ray emitting counterpart of 1FGL J1642.5+3947. The source 3C 345 is identified as the main contributor for this -ray emitting region. However, after November 2009 (15 months), a significant excess of photons from the nearby quasar NRAO 512 started to contribute and thereafter was detected with increasing -ray activity, possibly adding flux to 1FGL J1642.5+3947. For the same time period and during the summer of 2010, an increase of radio, optical and X-ray activity of NRAO 512 was observed. No -ray emission from B3 1640396 was detected.
Key Words.:
Galaxies: active - quasars: individual (3C 345, NRAO 512, B3 1640396) - Gamma rays: galaxies1 Introduction
The quasar 3C$ $345 is known as a prominent variable source from radio- to X-ray bands ( 10 keV). It is particularly bright at radio wavelengths and has an extended radio structure that is observable from sub-pc to kpc scales which is archetypical for a relativistic blazar jet (e.g. Lobanov & Zensus 1999; Kollgaard et al. 1989). Its jet has an apparent opening angle of 13° (Pushkarev et al. 2009). Unwin et al. (1994) concluded that the observed high-energy emission of this source is caused by inverse Compton up-scattering of lower energy photons by relativistic electrons of the pc-scale radio jet. However, it remained a puzzle why 3C 345 was not detected at energies above 20 MeV, while 3C 279 with similar apparent properties is a prominent source at -ray energies.
The high-redshift quasar NRAO$ $512, 0.5° west of 3C 345, is known as a compact radio source with a two-sided jet morphology on kpc scales and with a flat radio spectrum (Kovalev et al. 1999). The observed VLBI radio structure revealed a wide apparent jet opening angle of 50° (Pushkarev et al. 2009), which implies a small viewing angle to the line of sight, with its emission directly beamed at us.
The Energetic Gamma-Ray Experiment Telescope (EGRET; Thompson et al. 1993) on board the Compton Gamma Ray Observatory (CGRO) spacecraft did not observe a significant excess of -ray photons consistent with 3C 345 (3EG; Hartman et al. 1999), covering the first four phases of the CGRO mission (1991-1995). This lack of detectable flux of -rays above 20 MeV from 3C 345 was attributed to the high detection threshold of EGRET. A source consistent with the position of 3C 345, labeled as EGR J1642+3940, was found by Casandjian & Grenier (2008). This source was seen almost entirely in a single two-week viewing period with an excess of 5.8, from April 23rd - May 7th, 1996 (vp5190), which was after the data used for the 3EG. Unfortunately, the angular resolution of EGRET was too poor to distinguish contributions from the other two nearby candidates NRAO 512 and B3 1640396, see Table 1. Between October 1st and October 4th, 1993, a similar source was marginally detected by EGRET ( 2.1), but its centroid was localized closer to Mrk 501. In exactly the same viewing period, Kataoka et al. (1999) claimed EGRET detected a flare from Mrk 501, which lies 2.5° east of 3C 345. This would then be the only time that either of those sources was seen by EGRET – a strange coincidence that led Casandjian & Grenier to note that the EGR J1642+3940 source association with 3C 345 is “not clear”.
On June 11th, 2008, the Fermi Gamma-ray Space Telescope (short Fermi) was launched, equipped with the Large Area Telescope (LAT) instrument (Atwood et al. 2009) providing continuous all-sky monitoring of -ray emission as a default mode of operation. The LAT, compared with EGRET, has an improved sensitivity by a factor of 25 and an improved point-source localization. After 20 months of LAT operation within the region of interest, a localization improvement (comparing radii of 95% error circles) of a factor of 14 was reached compared to EGRET. These improvements provided a new opportunity to probe 3C 345 for -ray emission above 100 MeV.
The three-month bright Fermi source list (0FGL) for the dataset collected between August and October 2008 reported a -ray source (0FGL J1641.4+3939) near the position of 3C 345. It was then associated with the quasar B3 1640396 (CLASS J1641+3935) at low confidence (Abdo et al. 2009b). The bright 0FGL source was listed in the first Fermi-LAT source catalog (1FGL) as 1FGL J1642.5+3947 (Abdo et al. 2010a), further constraining its localization. An association with 3C 345 was still not possible with high confidence based on Fermi-LAT data alone, nevertheless, 1FGL J1642.5+3947 was listed in the catalog as being affiliated with its most likely counterpart 3C 345 (Abdo et al. 2010b).
In October 2009 a GeV flare was detected from the vicinity of 0FGL J1641.4+3939 (Reyes & Cheung 2009). Simultaneously, the GASP-WEBT collaboration reported on increased optical and radio activity of 3C 345 (Larionov et al. 2009). This event triggered additional observations at different frequencies, which made it possible to establish an identification through correlated multiwavelength activity.
Here we present 20 months of monitoring observations by Fermi LAT of the region around 3C 345, NRAO 512 and B3 1640396, as well as radio, optical, UV, and X-ray observations of these sources. Section 2 discusses the observations and data reduction methods applied to obtain calibrated datasets for the subsequent analysis. Section 3 discusses the results of Fermi-LAT observations and identification through multiwavelength counterparts of events in the light curve. Section 4 discusses and summarizes the findings of this paper.
2 Observations and data reduction methods
| Name(s) | 3C 345 | NRAO 512 | B3$ $1640$+$396 |
|---|---|---|---|
| CLASS$ $J1641+3935 | |||
| R.A. | 16h42m58810 | 16h40m29633 | 16h41m47540 |
| Dec. | +39°48′3699 | +39°46′4603 | +39°35′0333 |
| z | 0.5928 | 1.666 | 0.540 |
| Refs. | (1, 3) | (1, 4) | (2, 5) |
Refs. – The numerals in the references row translate to:
(1) Fey et al. (2004); (2) Myers et al. (2003);
(3) Marziani et al. (1996); (4) Stickel et al. (1989); (5) Brinkmann et al. (1995)
Notes:
Name(s) – Common source names.
R.A./Dec. – Right ascension/declination (J2000) of the radio source localization.
z – Source redshift.
2.1 -ray monitoring
The Fermi LAT (Atwood et al. 2009) is a pair-conversion telescope designed to cover the energy range from 20 MeV to greater than 300 GeV. The 1FGL catalog, based on 11 months of monitoring data, lists the -ray source 1FGL J1642.5$+$3947 (R.A. 16h42m33.55s, Dec. 39°47′38.8″, 95% position error radius r950.056°; Abdo et al. 2010a), which lies in close vicinity of the three quasars 3C 345, NRAO 512 and B3 1640396, listed in Table 1.
The Fermi-LAT data on the field in which 1FGL J1642.53947 is located were processed and analyzed using the Fermi Science Tools software package (version: v9r15p2111http://fermi.gsfc.nasa.gov/…/documentation/Cicerone; Abdo et al. 2010a). The photons were extracted from a region of interest (ROI) centered on the radio position of 3C 345 within a radius of 15∘ and a time range of 20 months, August 4th, 2008, to April 4th, 2010 (in MET222Mission Elapsed Time (MET) is measured in seconds from 2001.0 UT, including leap seconds. 239557417 - 292088627 s). The general data processing procedures applied were similar to those described in Abdo et al. (2009b) and Abdo et al. (2010a).
To ensure that the collected events considered in this analysis have a high probability of being photons, the “diffuse class” selection was applied. Furthermore, events above the zenith angle 105° were removed to avoid a significant contamination by rays produced from cosmic-ray interactions in Earth’s atmosphere333The Earth’s limb lies at a zenith angle of 113° at the 565 km nearly circular orbit of Fermi. The zenith angle is defined as the angle of a photon’s apparent origin to the Earth-spacecraft vector. (Abdo et al. 2009c). The P6_V3_DIFFUSE instrument response functions (IRF) were used (see Rando et al. 2009).
The remaining -ray-like events were analyzed using a maximum-likelihood approach (Mattox et al. 1996) to localize -ray sources and extract their spectra. As in the analysis of 1FGL, two sets of standard LAT analysis tools were used, and their results compared for consistency. The first set, based on gtfindsrc and gtlike tools, employs an unbinned likelihood analysis in which the expected response of the LAT is evaluated separately for each photon, given its energy and direction with respect to the detector axes. The second toolset, pointlike, uses a simpler, binned analysis methodology, where photons are binned spatially and in energy, and an averaged set of response functions is applied. The two packages give very similar results, with the pointlike package running much more quickly.
In both likelihood methodologies the -ray emission in the ROI is assumed to arise from two diffuse components and a number of point sources. Each point source is modeled spatially as a delta function and spectrally as a power law. The statistical significance of a potential source is estimated by forming a “test statistic” (TS),
| (1) |
where is the value of the likelihood obtained in the “source” hypothesis, with the source present in the model of the ROI and is the value in the alternate, “null” hypothesis, that the source is not real (and hence not included in the ROI model). If the null hypothesis is true, and assuming certain applicability conditions are met, Wilks’ theorem (Wilks 1938) states that TS is distributed as , where is the number of additional parameters optimized in the source model leading to . Because each point source has four free parameters (two for its position and two for its spectrum), we expect that , from which its significance can be evaluated. A source-detection threshold of TS=25 was adopted in 1FGL, which corresponds to a false detection probability of if .
The gtlike model used for localization in this paper includes the 1FGL J1642.53947 point-source component and all other point sources from the 1FGL catalog (Abdo et al. 2010b) within a 20° radius around the radio position of 3C 345. Further analysis was performed using two point-source components instead of one to fit the observed data. The model parameters for sources outside the 15° ROI were fixed to their respective 1FGL values. The model included 20 or 21 point sources with free parameters (flux and spectral index), depending on whether a single point source was fitted for 1FGL J1642.53947 (20 point sources) or whether two source components were added to take into account the separate contributions of 3C 345 and NRAO 512 (21 point sources). The background component of Galactic diffuse emission (gll_iem_v02.fit) and an isotropic component (isotropic_iem_v02.txt), both of which are the standard models available from the Fermi Science Support Center (FSSC)444 http://fermi.gsfc.nasa.gov/…/lat/BackgroundModels.html, were added as well. The isotropic component includes both the contribution from the extragalactic diffuse emission and from the residual, charged particle backgrounds.
To produce light curves, the standard tool gtlike was used, applying an unbinned spectral likelihood analysis as described above. A gtlike input source model was constructed based on the improved 20-month spectral fits obtained from the localization analysis. Only sources that were detected with a TS 25 in the 20-month integration were included in the final gtlike input source model to construct a light curve. The data were split into regular time intervals, each integrating over periods of 2, 5 and 30 days. Then an unbinned spectral likelihood analysis was performed on each integrated dataset with photon indices fixed to the 20-month average values. For time periods with a significance of the detection of TS 5 on 5- and 30-day scales, 2 upper limits were calculated following the likelihood profile (Rolke et al. 2005), where the upper limit is determined by increasing the flux from the maximum likelihood value until the log likelihood decreases by 2.0 (for the particular implementation in case of LAT data see Abdo et al. 2010a). All light curves make use of the collected data in the energy range of 0.1-300 GeV. Different time binnings were chosen to study different aspects of the time evolution of the source flux. To study the longer term behavior, 30-day bins were used (Section 3.2.1), monthly bins being relatively standard for Fermi analysis. To assess faster flaring behavior, and in particular to estimate when the peak flaring occurs, a two-day time binning was selected (Section 3.2.2). Finally, the best compromise between short and long time bins is the light curve with five-day integration periods (Section 3.3).
2.2 X-ray observations
Triggered by the reported -ray flare of 0FGL J1641.4+3939 in October 2009 (Reyes & Cheung 2009), X-ray observations of all three candidate counterpart sources were performed by the X-ray Telescope (XRT, 0.210 keV; Burrows et al. 2005) on board the Swift satellite (Gehrels et al. 2004). The list of Swift-XRT observations together with the spectral fit results is reported in Table 2.
The XRT data were processed with standard procedures (xrtpipeline v0.12.4) to calibrate the observations. The filtering and screening criteria were applied by means of the FTOOLS in the Heasoft package version 6.8555xrtpipeline and FTOOLS are part of the Heasoft software package: http://heasarc.gsfc.nasa.gov/lheasoft/; a detailed discussion on XRT data analysis can be found in the XRT User’s Guide: http://heasarc.gsfc.nasa.gov/…/xrt_swguide_v1_2.pdf. Given the low fluxes of the sources during observations ( 0.5 counts s-1 in the 0.210 keV range), only photon counting (PC) data were considered for our analysis with XRT grades 012 selected (according to Swift nomenclature, see Burrows et al. 2005). The source events were extracted in a circle of radius 1520 pixels (covering 85-90% of the XRT point spread function, PSF, at 1.5 keV) around the source, depending on its intensity. The background was estimated from a nearby source-free circular region of 40-pixel radius. Ancillary response files were generated with xrtmkarf to account for different extraction regions, vignetting and PSF corrections. The spectral redistribution matrices v011 in the calibration database maintained by HEASARC were used.
The adopted energy range for spectral fitting is 0.310 keV. All data were rebinned with a minimum of 20 counts per energy bin to use the minimization fitting technique, except when the statistics were poor ( 200 counts), in which case the Cash statistic (Cash 1979) was used and the data were binned to 1 counts bin-1. The Cash statistic is based on a likelihood ratio test and is widely used for parameter estimation in photon counting experiments. Swift-XRT uncertainties are given at 90 confidence level for each parameter, unless stated otherwise.
Spectral fitting was performed using XSPEC version 12.5.1 with an absorbed power law model. For the Galactic absorption a fixed H I column density nH of cm-2 was used for 3C 345, cm-2 for B3 1640396 and cm-2 for NRAO 512, obtained from the Leiden/Argentine/Bonn Galactic H I survey (Kalberla et al. 2005).
| Source | Obs. Date (*) | Exp. | Flux | Index |
|---|---|---|---|---|
| 3C 345: | 2009-10-04 (5109) | 4.2 | 6.8 0.5 | 1.68 0.11 |
| 2009-10-06a (5111) | 1.9 | 4.7 0.7 | 1.66 0.17 | |
| 2009-10-08 (5113) | 2.1 | 7.1 0.8 | 1.75 0.16 | |
| 2009-10-09 (5114) | 2.2 | 6.4 0.7 | 1.62 0.15 | |
| 2009-10-18 (5123) | 3.9 | 6.2 0.5 | 1.67 0.12 | |
| 2009-11-01 (5137) | 4.1 | 5.5 0.5 | 1.77 0.11 | |
| 2009-11-15 (5151) | 4.0 | 5.9 0.5 | 1.88 0.11 | |
| 2009-11-29 (5165) | 4.1 | 5.7 0.5 | 1.71 0.12 | |
| 2010-03-06/07 (5262/3) | 2.6 | 5.6 0.6 | 1.84 0.15 | |
| 2010-03-09a (5265) | 1.4 | 5.6 0.8 | 1.78 0.18 | |
| 2010-04-09a (5296) | 2.0 | 5.5 0.7 | 1.88 0.16 | |
| 2010-08-18 (5427) | 4.3 | 5.4 0.5 | 1.54 0.11 | |
| NRAO 512: | 2009-10-08a (5113) | 2.1 | 0.6 | 1.5 0.5 |
| 2009-10-15a (5120) | 2.1 | 0.5 0.2 | 2.2 0.6 | |
| 2010-08-06/07a (5415/6) | 5.5 | 0.7 0.1 | 2.0 0.3 | |
| B3 1640+396: | 2009-12-01a (5167) | 1.1 | 0.7 | 1.8 0.7 |
Notes:
Obs. Date (*) – Date of Swift-XRT observation (*=JD-2450000).
Exp. – Swift-XRT effective exposure time in ks.
Flux – Integrated unabsorbed photon flux 0.3-10 keV in units
of 10-12 erg cm-2 s-1.
a Cash statistic used for observations with less than 200 photons.
2.3 UV, optical and mm observations
In the case of 3C 345 a dense optical monitoring was performed by the GLAST-AGILE Support Program (GASP) of the Whole Earth Blazar Telescope (WEBT) collaboration. The GASP-WEBT is performing long-term monitoring of 28 -ray loud blazars in the optical, near-infrared, mm and radio bands (Villata et al. 2008, 2009). The GASP has been closely following a strong optical outburst in 3C 345 reported during the second half of 2009 (Larionov et al. 2009). The optical GASP data for this paper were acquired at the following observatories: Abastumani (Georgia), Calar Alto (Spain, within the MAPCAT program), Crimean (Ukraine), Lowell (Perkins, USA), Lu-lin (SLT, Taiwan), Sabadell (Spain), St. Petersburg (Russia), and Tijarafe (Spain).
Magnitude calibration was performed with respect to a common choice of reference stars in the field of the source obtained from the photometric sequence by González-Pérez et al. (2001). In addition to the GASP monitoring data, optical observations performed by the Special Astrophysical Observatory (SAO) of the Russian Academy of Sciences, using the SAO Zeiss 1-m telescope in BVR bands were included. The observational strategy and calibration procedures applied were described in detail by Bychkova et al. (2004). In Section 3.3 the R band magnitudes were converted to the linear flux density scale to compare light curves between wavelengths. The magnitudes were corrected for a Galactic extinction of 0.036 mag, for the magnitude to flux conversion the zero magnitude fluxes of Bessell et al. (1998) were used.
Two R-band observations of 3C 345 and B3 1640396 were conducted on January 26th, 2009 (14x180 s exposure), and on February 13th, 2009 (13x180 s exposure), using a robotic 200-mm telescope of the Tzec Maun observatory (Mayhill, NM, USA). Magnitude calibration was performed in a manner similar to the GASP observations.
Observations of 3C 345 and NRAO 512 were performed with the Ultraviolet/Optical Telescope (UVOT) on board the Swift spacecraft (Roming et al. 2005). Optical photometry of 3C 345 was calibrated using comparison stars from Smith et al. (1985). Calibration of the UV data was performed following the method of Poole et al. (2008). Comparison stars in the vicinity of 3C 345 could not be used to calibrate optical photometry of NRAO 512 with Swift UVOT because of its narrow field of view. Instead, the magnitude scale was calibrated using Sloan Digital Sky Survey (SDSS; Abazajian et al. 2009) stars in the field and transformations between the SDSS and Johnson photometric systems from Smith et al. (2002).
Table 3 lists the relevant results of mainly quasi-simultaneous optical/UV observations of 3C 345, NRAO 512 and B3 1640396 performed at Tzec Maun observatory and Swift UVOT. The Galactic extinction in the direction of these sources is between E(BV) 0.010 mag and 0.014 mag according to the tables of Schlegel et al. (1998). Using the extinction law by Cardelli et al. (1989) and coefficients describing the UVOT filters (Roming et al. 2009), the following extinctions (in magnitudes) were obtained for the individual bands: 0.030.04 (V), 0.040.06 (B), 0.050.07 (U), 0.070.09 (W1), 0.090.13 (M2) and 0.080.12 (W2).
The source 3C 345 was monitored also at mm wavelengths (230 GHz) by the Sub-millimeter Array (SMA) on Mauna Kea for the GASP. Additionally, a program conducted by Ann Wehrle (private communication) provided the data collected by the SMA for NRAO 512 and B3 1640+396.
| Source | Obs. Date (*) | Band | Magnitude |
|---|---|---|---|
| 3C 345: | 2009-01-26 (4858) | R | 16.48 0.02 |
| 2009-02-13 (4876) | R | 16.92 0.03 | |
| 2009-10-08 (5113) | U | 16.44 0.06 | |
| 2009-10-08 (5113) | UVW1 | 16.28 0.03 | |
| 2010-08-18 (5427) | UVW1 | 16.47 0.02 | |
| NRAO 512: | 2009-10-08 (5113) | U | 18.61 0.04 |
| 2010-08-06 (5415) | U | 17.71 0.05 | |
| 2010-08-06 (5415) | UVW1 | 18.07 0.02 | |
| B3 1640+396: | 2009-01-26 (4858) | R | 18.57 0.13 |
| 2009-02-13 (4876) | R |
Notes:
Obs. Date (*) – Date of Swift-XRT observation (*=JD-2450000).
Band – Optical filter used for photometric observations
Magnitude – Observed optical magnitude in given filter band. The magnitudes are not
corrected for Galactic extinction.
no detection
3 Results
3.1 Localization of -ray emission
An unbinned spectral likelihood analysis was performed using integrated 20-month Fermi-LAT monitoring data in the energy range of 0.1100 GeV. This energy range was chosen after a series of different energy cuts were compared, to minimize the error on the localization. In the 1FGL catalog -ray sources are typically localized with a 95% position error radius of 0.02° – 0.07° for sources with TS 1000, but 0.06° – 0.5° for TS 30 (Abdo et al. 2010a). In cases of faint -ray emitters it is difficult to obtain well-constrained localizations to make statistically significant associations, even more so for two faint -ray emitters in close vicinity of each other.
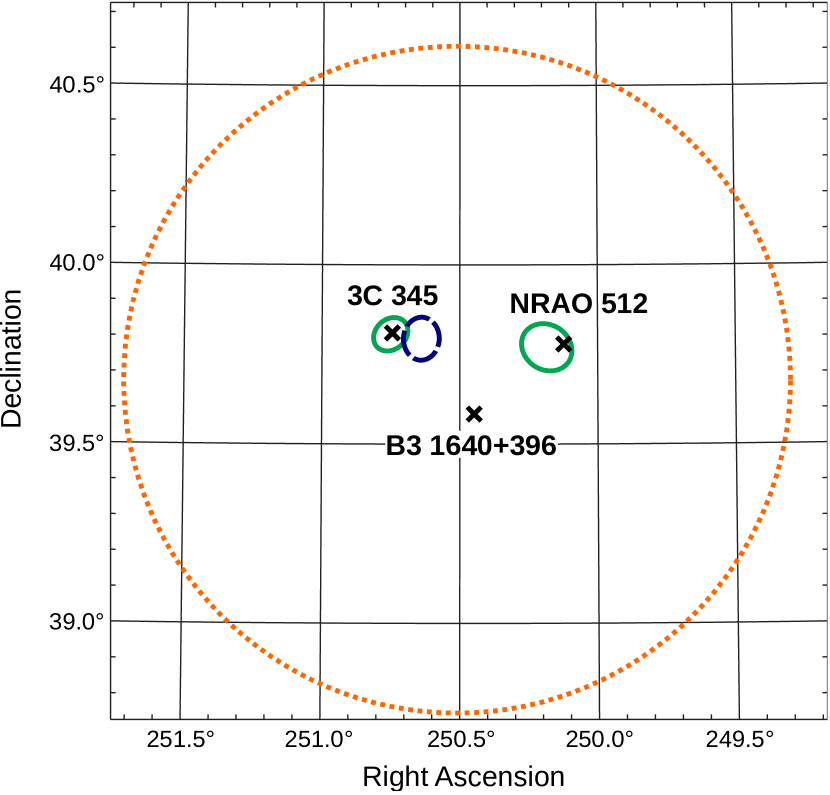
A single point-source, 1FGL J1642.5+3947, is listed in the 1FGL catalog around the analyzed region. Assuming a single point-source, the best-fit position using the 20-month LAT dataset is R.A. 16h42m24s, Dec. +39°48′27″, with a 95% error circle radius of 0.037°. This procedure also provided the following characteristic source parameters: photon index666The photon spectral index is defined as N(E) E-Γ, where N(E) is the -ray photon flux as a function of energy E.: 2.440.03, integrated flux: ph cm-2 s-1, TS value of 2825. The estimated systematic uncertainty of the integrated flux is 10% at 100 MeV, 5% at 500 MeV and 20% at 10 GeV. After 20 months of data the localized position is shifted by 0.042° from its 1FGL position toward NRAO 512, separated by 0.13° (east) from 3C 345 and by 0.48°(west) from NRAO 512. This suggested a significant contribution of excess photons from the direction west of 3C 345.
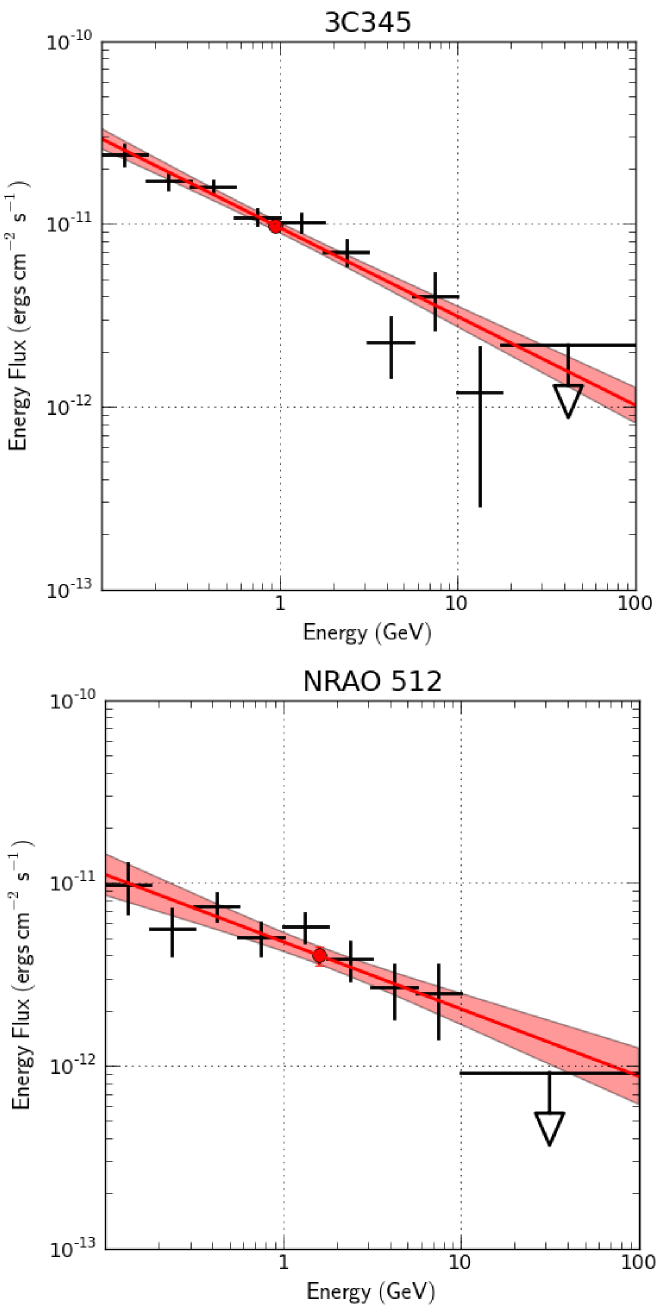
The unbinned spectral likelihood analysis was complemented by a pointlike analysis, similar to the method applied to determine positions and error ellipses for the 1FGL catalog. The approach of pointlike is described in Section 4.2 of Abdo et al. (2010a). This analysis revealed that a significant number of excess -ray photons were detected from the vicinity of NRAO 512 after November 2009 (15 month). A fit with two point-source models in which source positions were not fixed, representing contributions by 3C 345 and NRAO 512, yielded significant detections for the 20-month period (see Table 4). Fig. 1 shows the radio positions of the three candidate sources together with the EGRET and 1FGL localizations, as well as the improved localizations for the two -ray sources found in the 20-month dataset. B3 1640396 is 19.3′ and 16.5′ separated from the respective localizations of 3C 345 and NRAO 512. Both -ray counterparts of 3C 345 and NRAO 512 now coincide with their respective radio positions (within the 95% error ellipse). This suggests that both sources may be -ray emitters. This is firmly established in Section 3.3 using the broadband temporal characteristics of the sources. There is no evidence for significant -ray emission from the third candidate source, B3 1640396. The results of pointlike were cross-checked with an iterative use of gtlike and gtfindsrc, which confirm the pointlike results within errors, see Table 4. A 2 upper limit was calculated for B3 1640396 by fixing each of the three candidate sources to their radio positions and assuming a spectral shape for B3 1640396 and using the previously fitted for 3C 345 and NRAO 512. This resulted in a 20-month upper limit for the integrated flux of 7.4 ph cm-2 s-1. Fig. 2 shows the observed binned spectra of the two sources together with their respective power-law fits. The pointlike best-fit parameters are listed in Table 4. In Fig. 3 the respective 30-day binned -ray light curves of the two localized sources are shown and are discussed below in more detail.
| 3C 345 | NRAO 512 | |
|---|---|---|
| R.A. (J2000) | 16h43m0.24s | 16h40m44.4s |
| Dec. (J2000) | 39°48′22.7″ | 39°46′12.0″ |
| r | 0.35′ | 2.9′ |
| a (95%) | 0.0490° | 0.0735° |
| b (95%) | 0.0442° | 0.0626° |
| 41.6 | -33.2 | |
| (pl) | 2.490.02 | 2.370.04 |
| (gt) | 2.45 0.05 | 2.41 0.08 |
| Flux (pl) | 1.220.10 | 0.510.23 |
| Flux (gt) | 1.13 0.13 | 0.67 0.13 |
| Pivot Energy | 949 | 1598 |
| TS | 1076 | 246 |
Notes:
R.A./Dec. – Right ascension/declination of the -ray localization;
– distance to respective radio source position;
a (95%) – major axis of 95% localization error ellipse;
b (95%) – minor axis of 95% localization error ellipse;
– Rotation angle of the error ellipse East of North (degrees);
– spectral index of power-law fit, (pl) are the values obtained from the pointlike fit and (gt) are values from the gtlike fit;
Flux – 20-month average flux (0.1-100 GeV) determined from the power-law spectral fit
in units of 10ph cm-2 s-1;
Pivot Energy – in MeV, this is the energy for which there is no correlation
between the flux or normalization and spectral index uncertainties;
TS – Likelihood test statistic value.
3.2 20-month of -ray monitoring
3.2.1 Long-term variability of 3C 345 and NRAO 512
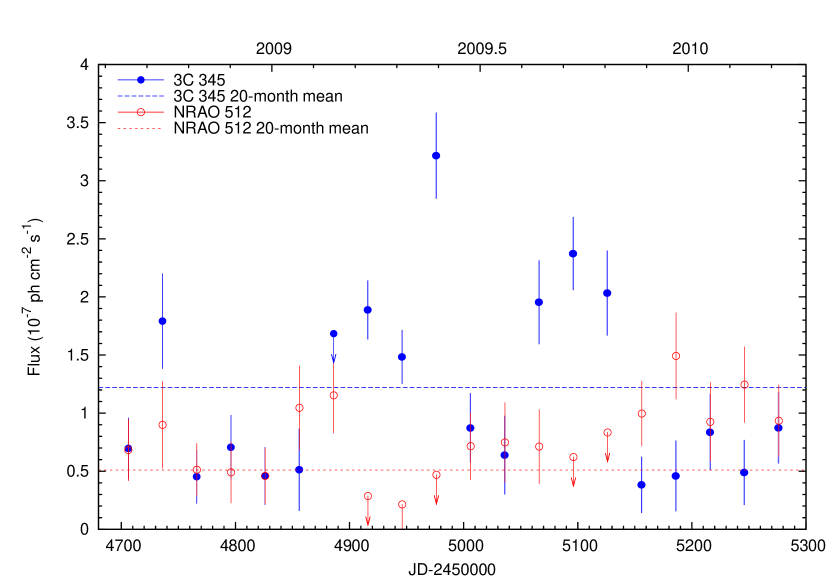
To study the long-term variability, light curves were produced for the -ray counterparts associated with 3C 345 and NRAO 512 with 30-day binning. The 30-day binned light curve is shown in Fig. 3. For most of the data points NRAO 512 did not reach above a TS of 25, except for the last five months of the 20-month period. This led to the conclusion that NRAO 512 did not produce a significant excess of -ray emission over the local background during the first 15 months of LAT operation; thus it did not appear in the 1FGL catalog. After 15 months the amount of excess photons from the vicinity of NRAO 512 slowly increased, making a detection over the integrated 20-month period possible. The average Fermi-LAT flux for the first 15-months of the monitoring period was (0.42 0.07) 10-7 ph cm-2 s-1 compared to (1.1 0.1) 10-7 ph cm-2 s-1 for the last quarter of the monitoring period (months 15-20).
The observed -ray flux values reveal variability on timescales from days to months. To quantify this variability, the variability index () as defined through the distribution (see Abdo et al. 2010a) was determined. It is computed from the 30-day integrated light curve data shown in Fig. 3. Whenever TS 5 the 2 upper limit was computed and its error estimate for that interval was replaced with half the difference between that upper limit and its value determined through the unbinned spectral likelihood analysis. In the absence of variability is expected to follow a distribution with 19 ( N) degrees of freedom. At the 99% confidence level the light curve is significantly different from a flat one if . For 3C 345 a of 115.3 was obtained, for NRAO 512 it was 37.7. Both sources are variable according to the 99% confidence interval with higher variability observed from 3C 345.
In the shorter binned light curve of NRAO 512, 63% of the derived values had a TS 5 (i.e. non-detections) compared to 48% for 3C 345. Because NRAO 512 did not show a significant flux for most of the time on integrations of five days or less and with the observation that the flux of 3C 345 dominates, the model component of NRAO 512 was removed and light curves were produced with a single component fixed at the position of the -ray localization of 3C 345 listed in Table 4. This reduced the amount of noise in the light curve of 3C 345 and the number of values with a TS 5 was only 14%.
3.2.2 Short-term variability of 3C 345
For the remainder of this paper the discussion is based on light curves produced with a single point-source model component. The five-day binned light curve of 3C 345 is shown in Fig. 4 for comparison with observations at other wavelengths.
To investigate shorter term variability in the observed -ray emission of 3C 345, several prominent light-curve “flare events” were identified and parameters such as rise time, fall time and time of the peak were extracted using the five-day and two-day integrated light curves. These parameters can be used to constrain the size of emission regions and cooling-times. Table 5 summarizes these results, listing characteristic parameters for all -ray flare events for which the peak had a significance of TS 25 in the two-day light curve. This corresponded to a flux greater than 10-7 ph cm-2 s-1. The time of onset and end of an individual flare event was determined through a change in the sign of the gradient at the rising and declining slope of the light curve around the peak of a flare event.
| (*) | |||||||
|---|---|---|---|---|---|---|---|
| JD() | JD() | JD() | days | days | days | ||
| 4734 | 4709 | 4754 | 45 | 25 | 20 | ||
| 4856 | 4844 | 4874 | 30 | 12 | 18 | ||
| 4916 | 4904 | 4944 | 40 | 12 | 28 | ||
| 4978/4998 | 4969 | 5014 | 45 | 9 | 16 | / | |
| 5020 | 5014 | 5044 | 30 | 6 | 24 | ||
| 5056/5070 | 5044 | 5089 | 45 | 12 | 19 | / | |
| 5104 | 5099 | 5119 | 20 | 5 | 15 | ||
| 5194 | 5169 | 5214 | 45 | 25 | 20 | ||
| 5278 | 5264 | 14 | |||||
| Average values: | 38 | 13 | 20 | 5.0 0.5 |
Notes: – in units of JD() JD-2450000, peak value was obtained from the two-day integrated light curve, all values have an error of 1 day;
, – in units of JD() JD-2450000, all values have an error of 3 days;
, , – in units of days, all values with error of 4 days;
– two-day integrated flux value of the -ray event peak value;
(*) Labels are split into two sub-categories according to their peak flux and significance of detection, denoted by Roman and Arab numbers, see Fig. 4 for details.
Three dominant flare events of at least ph cm-2 s-1 and a significance of above 7 were observed on two-day time scales, one during 2008 and two during 2009. They were labeled with , and in Fig. 4. Several weaker flares were identified and labeled with numbers from 1 to 6. On average, the flares had a duration of 38 days a slightly faster rise than fall time and an average peak flux of ph cm-2 s-1 (two-day integrations centered on the peak).
3.3 Identification of -ray counterparts
Following the -ray outburst on October 2nd, 2009, Swift observations were triggered on the candidate sources 3C 345, NRAO 512 and B3 1640396. X-ray spectra and optical magnitudes were obtained from these observations. A summary of relevant measurements is listed in Tables 2 and 3.
The brightest source of the three candidates in X-ray as well as in optical is 3C 345. On January 26th, 2009, 3C 345 and B3 1640396 were detected in the optical R-band at respective magnitudes of 16.48 0.02 and 18.6 0.1. On October 8th, 2009, observations of 3C 345 and NRAO 512 showed respective optical U-band magnitudes of 16.45 0.08 and 18.64 0.04. Both NRAO 512 and B3 1640396 were a factor of 7-8 fainter than 3C 345 at optical wavelengths. At X-ray energies, as seen from Table 2, NRAO 512 and B3 1640396 had similar fluxes, which were a factor of 8-9 fainter than 3C 345. Archival Swift-UVOT and XRT data from observations of NRAO 512 made in January 2007 have an average optical U magnitude of 18.0 0.1 and an X-ray flux of (8.3 2.3)10-13 erg cm-2 s-1, which are consistent with the recently observed values. Quasi-simultaneous mm observations between October and December 2009 determined the fluxes of 3C 345, NRAO 512 and B3 1640396 to be 3.0, 0.4 and 0.10.3 Jy. The respective flux ratios are consistent with the ones in the optical/UV and X-rays. The mm radio flux density of 3C 345 was at least a factor of 7 higher than for NRAO 512 and B3 1640+396.
No significant excess of -ray emission from NRAO 512 was observed during the first 15-months of the Fermi-LAT operation. At the end of 2009, NRAO 512 showed an increasing trend in its 15 GHz VLBI radio flux observed by the MOJAVE team (Lister et al. 2009)777www.physics.purdue.edu/MOJAVE/sourcepages/1638+398.shtml. Indeed, the radio flux reached a low activity level around May 2009 and more than doubled until about July 2010 with the mm-radio flux density reaching a peak value of over 0.6 Jy in August 2010. A similar trend was observed in optical emission. Within one year, the optical flux increased by a factor of 2.2 (see Table 3). In X-rays a flux increase of at least 20-30% was observed, but because of the low statistics (less than 200 photons) it is difficult to compare the observations. An increased number of -ray photons was detected spatially consistent with NRAO 512 during the last quarter of the 20-month period. The excess is not high enough to affect the short-term bins of the light curve of 3C 345 significantly, however, as was shown in Section 3.1, the integrated 20-month dataset made it possible to detect a second point source west of 1FGL J1642.5+3947, which is consistent with the radio position of NRAO 512 (see Fig. 1). Altogether this identifies NRAO 512 as a -ray source.
3.4 Multi-wavelength analysis of -ray emission from 3C 345
During 2009 nine optical observatories, listed in Section 2.3, regularly monitored 3C 345, mainly as part of the GASP-WEBT program. This provided a densely sampled optical R-band light curve (Fig. 4). Visual comparison of the -ray and optical light curves indicates a likely correspondence between at least four -ray/optical flare events: Flare , , 4 and . With the addition of X-ray and mm-radio monitoring data, the following aspects are of particular interest:
-
1.
A possible fast optical brightening of at least 0.3 mag with a duration of only a few days (Fig. 4) was observed (JD 2454978), coincident with the peak of Flare II. Unfortunately, the optical monitoring had a gap between JD 2454953 and JD 2454977. At the same time the mm radio light curve showed a maximum of around 4.3 Jy. Moreover, a high X-ray flux was observed in the same period of the Flare II, followed by a decrease similar to what was observed in and radio bands. Even if the maximum X-ray flux was observed two weeks before Flare II, the -ray event lacks strictly simultaneous X-ray observations, thus we cannot exclude that a simultaneous X-ray flare was missed.
-
2.
The broad optical flaring episode observed around September/October 2009 had a total duration of about five months, with shorter timescale sub-structures that correspond to activity variations observed also at - and X-rays. The peak in the optical was observed on September 19th, 2009 (JD 2455094), and had no similarity in profile with events at other wavelengths (see Fig. 4).
-
3.
Ten days after the peak of the optical light curve, the strong -ray Flare was observed. The optical peak was followed by fast optical variability at a significant amplitude of 0.30.5 mag, with an elevated magnitude observed on September 29th on the same day as -ray Flare .
-
4.
Flares 1 and 3 can be related to the appearance of new features in the pc-scale radio jet of 3C 345 at 43 GHz (see Schinzel et al. 2010).
-
5.
All but Flares 5 and 6 occur before the significant excess of -ray emission was observed near NRAO 512. However, for at least Flare 6, a correspondence in optical variability was found for 3C 345; unfortunately, a lack of multiwavelength data around Flare 5 makes it impossible to identify it with either 3C 345 or NRAO 512.
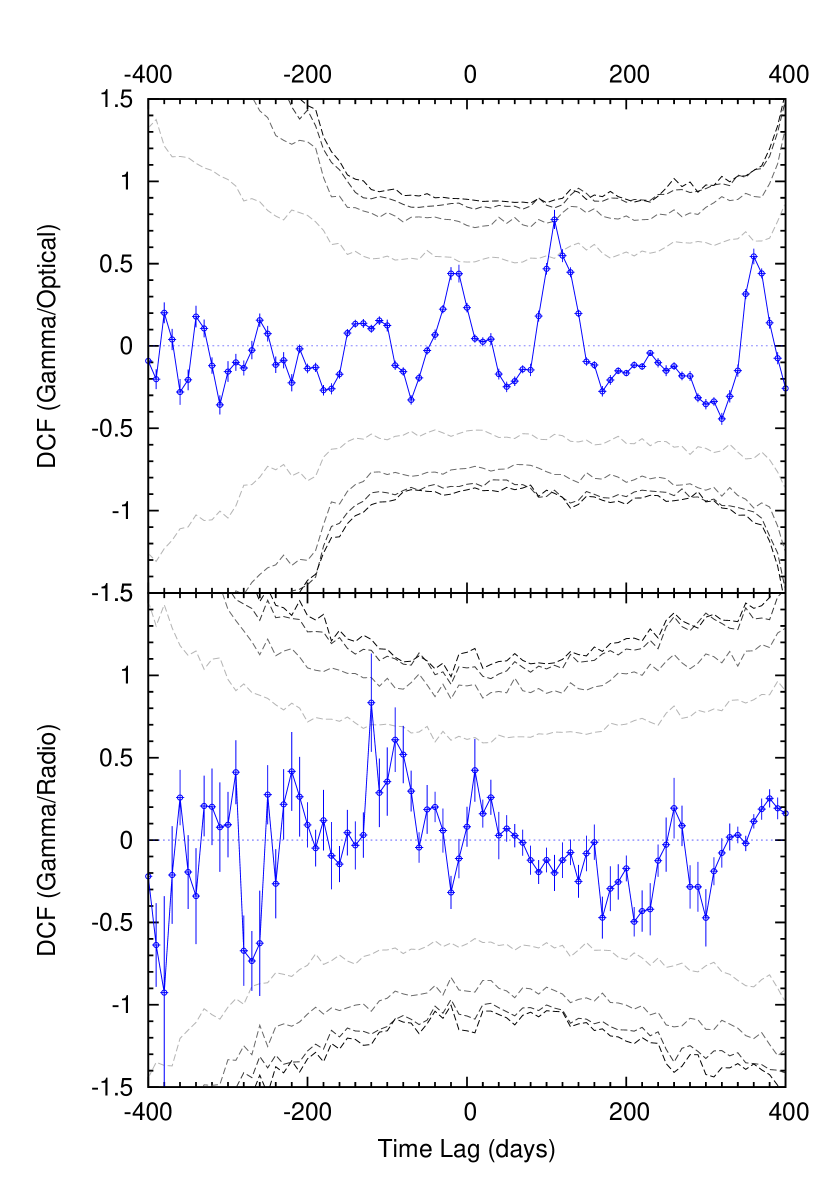
To quantify the cross-correlation between light curves, a discrete correlation was calculated (DCF; Edelson & Krolik 1988) using the 20-month Fermi-LAT light curve and the optical R-band light curve between JD 2454680 (August 1st, 2008) and 2455299 (April 12th, 2010), as well as the radio SMA light curve between JD 2454721 (September 11th, 2008) and 2455289 (April 2nd, 2010). Fig. 5 (top) plots the resulting DCF comparing optical and -ray light curves using a five-day -ray integration and a ten-day timelag binning. This yields a number of distinct correlation peaks, of which the two most significant are discussed. In the first peak the optical leads the -ray flux by (15 10) days with a correlation coefficient of 0.44 0.05. The second peak corresponds to the optical flux lagging the -rays by 110 5 days with a correlation coefficient of 0.77 0.06. To test the robustness of these peaks in the DCF, we artificially removed the points corresponding to the peak -ray flux from Flares II and III and recalculated the DCF. The same behavior was observed, with the -ray flux leading the optical by 20 days and lagging by 110 days. This shows that the results obtained do not solely depend on these two events. Finally, the DCF between the -ray and the SMA light curve of 3C 345 was calculated, which yielded a noisy distribution of correlation peaks (also see Fig. 5). The strongest peak indicates that the radio emission leads the rays by 120 5 days with a correlation coefficient of 0.83 0.30.
The statistical significance of the cross-correlation peaks was investigated using Monte Carlo simulations, following Chatterjee et al. (2008) and Max-Moerbeck et al. (2010) and assuming that the noise properties of the light curves can be described by a power-law power spectral density (PSD; ) with an exponent that depends on the particular energy band of the emission.
In order to estimate the significance of the -ray/optical cross correlation, an attempt was made to calculate and characterize the PSD shape from the presented data directly, despite the limited length (20 months) and sampling ( 1 day) of the light curves. For the optical and -ray data, the light curves available support a range of time scales corresponding to about one decade in the frequency domain. The respective range is even smaller for the more sparsely sampled radio data. The PSDs were calculated following Section 3.1 in Uttley et al. (2002). The resulting power-law slopes, , are in the range of 1.2–0.7. Values of are not consistent with the calculated PSD shapes and can be ruled out. However, Uttley et al. (2002) demonstrated that aliasing effects add to the power spectral slopes and could potentially flatten the observed power spectrum. The relatively high noise and short time span of the data makes this range of rather unreliable. Monte Carlo simulations for these values of yield extremely high cross-correlation significances of 99.999% for the -ray/optical light curves and 99.98% for the -ray/radio case. It should be noted that a reliable determination of the PSD from observational data is usually done with a much larger dynamic range (e.g. covering 4–5 orders of magnitude in the frequency scale), which is also the case in Uttley et al. (2002). The radio, optical and -ray data discussed in our paper do not provide such an extended coverage in the frequency space. We adopt therefore a more cautious approach, exploring a range of power-law indices based on published values.
In the -ray regime for BL Lacs and for flat spectrum radio quasars (Abdo et al. 2010c). Instead, for 3C 279, it has been found that at 14.5 GHz and in the R-band (Chatterjee et al. 2008). More recently Chatterjee et al. (2011) found an average optical power-law index of for a sample of six blazars in the R-band. Simulated light curves with PSD power-law indices in these ranges can provide reliable estimates on the significance of the cross-correlations. The simulations use light curves of the same length as the data and simulated up to a maximum frequency of 1 day-1 using the method described by Timmer & Koenig (1995). Each case uses 10000 pairs of light curves, which are sampled and cross-correlated in the same fashion as the observed light curves. From these simulated data the distribution of correlation coefficients for each time bin can be obtained for the case of non correlated time series. Fig. 5 presents the (99.7%) significance levels for all tested PSD shape combinations.
The -ray/optical correlation has a significance of higher than 3 (99.7%) for the peak at a timelag of 110 days in most of the tested cases. It is the most significant peak in the DCF and it has a moderately high confidence level () even for the least significant case ( and ; highest dashed line in the top panel of Fig. 5) among the values considered. The -ray/optical peak at a timelag of about 20 days has a much lower confidence level () in the least significant case and it remains below the 3 level at all times. The -ray/radio cross-correlation at timelag 120 days has a confidence level of in the least significant case ( and ).
The source 3C 345 is by far the brightest of the three quasars in the -ray region studied during the presented time period. In all bands it was consistently brighter than NRAO 512 and B3 1640396. The improved Fermi position combined with multi-wavelength activity and a moderate significance of correlated optical/-ray variability, using a plausible range of in the -ray and optical PSDs, strongly suggest an identification of 3C 345 as -ray source and the main contributor to the observed -ray flux in 1FGL J1642.5+3947.
4 Discussion and summary
Properties of the -ray emitting region reported in the first three-month Bright Source List (Abdo et al. 2009a) as well as in the first 11-month Fermi-LAT source catalog (Abdo et al. 2010a, b) were compared to the 20-month dataset presented here. Localizations of the sources in this region were improved over the previously reported values, leading to the detection of two -ray point sources, one consistent with 1FGL J1642.5+3947 and a new -ray source 0.4° west of it. 3C 345 and NRAO 512 were identified as the counterparts for these -ray sources. Their -ray spectra have a spectral slope of 2.4–2.5 typical for that of flat spectrum radio quasars (Abdo et al. 2010b). No significant spectral break was observed in the spectrum of either source, unlike in the case of 3C 454.3 (Ackermann et al. 2010), however, the statistics at the highest energies are poor, and the presence of a spectral break at E10 GeV is not ruled out.
The -ray emission from 3C 345 was identified based on an improved -ray counterpart localization and multi-wavelength activity including correlations of moderate significance found between the optical and radio variability, using a plausible range of in the -ray and optical PSDs, and major -ray events observed by Fermi LAT during its first 20 months of operation. EGRET observed 3C 345 between 1991 and 1994 during a time of enhanced radio activity. An upper limit of 2.5 10-7 ph cm-2 s-1 for the viewing period September 12th - 19th, 1991, was reported (Fichtel et al. 1994). However, Casandjian & Grenier (2008) report the detection of a -ray source that could be consistent with 3C 345 in the period April 23rd - May 7th, 1996 with a -ray flux of (3.5 0.8) 10-7 ph cm-2 s-1, but it was noted that the association with 3C 345 remains unclear because of a possible confusion with Mrk 501. In the Fermi-era, with an increased sensitivity and the possibility of long-term integrations, 3C 345 was already detected during the first three months of operation at a level of 18 and after 20 months it reached over 30. However, owing to the unclear association of 3C 345 with EGR J1642+3940, the three-month data were falsely associated with CLASS J1641+3035 (B3 1640+396), which, as shown in this paper, did not produce a significant excess of -ray emission above the detection threshold of Fermi-LAT. Thus the simplest explanation for the previous non-detection of 3C 345 is that its emission was just below or at the detection limit of EGRET.
These findings end the decade-long debate whether 3C 345 is -ray loud (Unwin et al. 1997). The identification of 1FGL J1642.5+3947 with 3C 345 is further supported by the connection of radio-emission of the parsec-scale jet with the observed -ray emission (Schinzel et al. 2010). Here not only individual flares were correlated with radio events, but an unambigious long-term trend in -ray emission was observed, which matched the trend of the radio flux density light curve of the inner jet at 43 GHz. The trend and correlated radio events relate to a distance of 10 pc in the source frame and questions existing scenarios that place the -ray emission at sub-pc distances from the central engine (e.g., Tavecchio et al. 2010). This supports the arguments given by Unwin et al. (1997) that the observed -ray emission is related to the relativistic jet on pc scales.
The cross-correlation found between -ray and optical light curves at 110 days had a moderate confidence level of 98.5%, whereas the lag at -20 days had a confidence level of only 67.6% using a plausible range of in the -ray and optical PSDs. If typical values for the power spectral density (PSD) shapes are assumed ( and ; second to lowest dashed line in the top panel of Fig. 5), the confidence level remains low at 89.3%. The weak correlation found between the -ray and 230 GHz radio light curves had a worst-case confidence level of 89.3%. Assuming a possibly more typical combination of PSD shapes ( and ), a confidence level of 96.1% is obtained. If this weak correlation holds, it could suggest a connection between the radio emission and production of -rays. A timelag of -120 days suggests the mm-radio emission precedes the -rays. Pushkarev et al. (2010) showed for a larger sample of radio-loud quasars that on average the 15 GHz radio emission lags 1.2 months behind -rays. The result presented here indicates that between 15 GHz and 230 GHz it is possible to directly observe the -ray emitting region, as already implied by Unwin et al. (1997), which supports the argument of -ray production in the relativistic jet on pc scales. However, in contrast to these, a more confident cross-correlation result of -rays leading by 80 and 50 days was recently obtained for two prominent BL Lac type objects, OJ 287 (Agudo et al. 2011a) and AO 0235+164 (Agudo et al. 2011b), respectively. Doubts on the indicated radio/-ray correlation of 3C 345 remain in this problem and should be investigated more thoroughly with a longer and denser sampled lightcurve at mm wavelengths.
The -ray emission from NRAO 512, a high-redshift quasar, was identified based on a correlated increase in multiwavelength emission from radio up to GeV energies between 2009 and 2010. At monthly timescales the source started to be significant around November 2009. This increase of -ray flux led to the first detection of the now identified new -ray counterpart west of 3C 345. The LAT flux quoted in this paper for the first 15 months was below the EGRET detection threshold, offering a plausible explanation of why EGRET did not see emission from NRAO 512, except possibly during a -ray flare event.
The radio, optical and X-ray flux ratios between 3C 345, NRAO 512 and B3 1640396 could be used to gauge their individual -ray photon contributions and might be able to provide an indication of false associations for -ray photons from this part of the sky. Multiwavelength monitoring, in addition to the continuous all-sky monitoring by Fermi LAT, will help to improve the localization of -ray emission from this region and is necessary for a deeper variability study for any of these sources in the future. Ultimately this might lead to the detection of -ray emission from B3 1640396 as well.
Acknowledgements.
The authors would like to thank Ann Wehrle, Benoit Lott, Seth Digel, Gino Tosti, Dave Thompson, and Greg Taylor for their helpful comments and useful discussions, which improved the quality of this manuscript. We thank the A&A referee for extensive comments. The Fermi LAT Collaboration acknowledges generous ongoing support from a number of agencies and institutes that have supported both the development and the operation of the LAT as well as scientific data analysis. These include the National Aeronautics and Space Administration and the Department of Energy in the United States, the Commissariat à l’Energie Atomique and the Centre National de la Recherche Scientifique / Institut National de Physique Nucléaire et de Physique des Particules in France, the Agenzia Spaziale Italiana and the Istituto Nazionale di Fisica Nucleare in Italy, the Ministry of Education, Culture, Sports, Science and Technology (MEXT), High Energy Accelerator Research Organization (KEK) and Japan Aerospace Exploration Agency (JAXA) in Japan, and the K. A. Wallenberg Foundation, the Swedish Research Council and the Swedish National Space Board in Sweden. Additional support for science analysis during the operations phase is gratefully acknowledged from the Istituto Nazionale di Astrofisica in Italy and the Centre National d’Etudes Spatiales in France. Frank Schinzel and Kirill Sokolovsky were supported for this research through a stipend from the International Max Planck Research School (IMPRS) for Astronomy and Astrophysics at the Universities of Bonn and Cologne. M. Villata organized the optical-to-radio observations by GASP-WEBT as the president of the collaboration. Additional support for science analysis during the operations phase is gratefully acknowledged from the Istituto Nazionale di Astrofisica in Italy and the Centre National d’Études Spatiales in France. The St.Petersburg University team acknowledges support from Russian RFBR foundation via grant 09-02-00092. Acquisition of the MAPCAT data is supported in part by the Spanish Ministry of Science and Innovation and the Regional Government of Andalucía through grants AYA2007-67626-C03-03 and P09-FQM-4784, respectively. The Abastumani team acknowledges financial support by the Georgian National Science Foundation through grant GNSF/ST08/4-404. A. Marscher and S. Jorstad received support for this work from NASA grants NNX08AV65G, NNX08AV61G, and NNX09AT99G, and National Science Foundation grant AST-0907893 to Boston University. The Submillimeter Array is a joint project between the Smithsonian Astrophysical Observatory and the Academia Sinica Institute of Astronomy and Astrophysics and is funded by the Smithsonian Institution and the Academia Sinica. This paper is partly based on observations carried out at the German-Spanish Calar Alto Observatory, which is jointly operated by the MPIA and the IAA-CSIC. This research has made use of NASA’s Astrophysics Data System, the SIMBAD database, operated at CDS, Strasbourg, France and the NASA/IPAC Extragalactic Database (NED) which is operated by the JPL, Caltech, under contract with NASA. This research has made use of data from the MOJAVE database that is maintained by the MOJAVE team (Lister et al. 2009).References
- Abazajian et al. (2009) Abazajian, K. N., Adelman-McCarthy, J. K., Agüeros, M. A., et al. 2009, ApJS, 182, 543
- Abdo et al. (2010a) Abdo, A. A., Ackermann, M., Ajello, M., et al. 2010a, ApJS, 188, 405
- Abdo et al. (2010b) Abdo, A. A., Ackermann, M., Ajello, M., et al. 2010b, ApJ, 715, 429
- Abdo et al. (2010c) Abdo, A. A., Ackermann, M., Ajello, M., et al. 2010c, ApJ, 722, 520
- Abdo et al. (2009a) Abdo, A. A., Ackermann, M., Ajello, M., et al. 2009a, ApJS, 183, 46
- Abdo et al. (2009b) Abdo, A. A., Ackermann, M., Ajello, M., et al. 2009b, ApJ, 700, 597
- Abdo et al. (2009c) Abdo, A. A., Ackermann, M., Ajello, M., et al. 2009c, Phys. Rev. D, 80, 122004
- Ackermann et al. (2010) Ackermann, M., Ajello, M., Baldini, L., et al. 2010, ApJ, 721, 1383
- Agudo et al. (2011a) Agudo, I., Jorstad, S. G., Marscher, A. P., et al. 2011a, ApJ, 726, L13
- Agudo et al. (2011b) Agudo, I., Marscher, A. P., Jorstad, S. G., et al. 2011b, ApJ, 735, L10
- Atwood et al. (2009) Atwood, W. B., Abdo, A. A., Ackermann, M., et al. 2009, ApJ, 697, 1071
- Bessell et al. (1998) Bessell, M. S., Castelli, F., & Plez, B. 1998, A&A, 333, 231
- Brinkmann et al. (1995) Brinkmann, W., Siebert, J., Reich, W., et al. 1995, A&AS, 109, 147
- Burrows et al. (2005) Burrows, D. N., Hill, J. E., Nousek, J. A., et al. 2005, Space Science Reviews, 120, 165
- Bychkova et al. (2004) Bychkova, V. S., Kardashev, N. S., Vlasyuk, V. V., & Spiridonova, O. I. 2004, Astronomy Reports, 48, 840
- Cardelli et al. (1989) Cardelli, J. A., Clayton, G. C., & Mathis, J. S. 1989, ApJ, 345, 245
- Casandjian & Grenier (2008) Casandjian, J.-M. & Grenier, I. A. 2008, A&A, 489, 849
- Cash (1979) Cash, W. 1979, ApJ, 228, 939
- Chatterjee et al. (2011) Chatterjee, R., Bailyn, C., Bonning, E. W., et al. 2011, ArXiv e-prints, arXiv:1101.3815
- Chatterjee et al. (2008) Chatterjee, R., Jorstad, S. G., Marscher, A. P., et al. 2008, ApJ, 689, 79
- Edelson & Krolik (1988) Edelson, R. A. & Krolik, J. H. 1988, ApJ, 333, 646
- Fey et al. (2004) Fey, A. L., Ma, C., Arias, E. F., et al. 2004, AJ, 127, 3587
- Fichtel et al. (1994) Fichtel, C. E., Bertsch, D. L., Chiang, J., et al. 1994, ApJS, 94, 551
- Gehrels et al. (2004) Gehrels, N., Chincarini, G., Giommi, P., et al. 2004, ApJ, 611, 1005
- González-Pérez et al. (2001) González-Pérez, J. N., Kidger, M. R., & Martín-Luis, F. 2001, AJ, 122, 2055
- Hartman et al. (1999) Hartman, R. C., Bertsch, D. L., Bloom, S. D., et al. 1999, ApJS, 123, 79
- Kalberla et al. (2005) Kalberla, P. M. W., Burton, W. B., Hartmann, D., et al. 2005, A&A, 440, 775
- Kataoka et al. (1999) Kataoka, J., Mattox, J. R., Quinn, J., et al. 1999, ApJ, 514, 138
- Kollgaard et al. (1989) Kollgaard, R. I., Wardle, J. F. C., & Roberts, D. H. 1989, AJ, 97, 1550
- Kovalev et al. (1999) Kovalev, Y. Y., Nizhelsky, N. A., Kovalev, Y. A., et al. 1999, VizieR Online Data Catalog, 413, 90545
- Larionov et al. (2009) Larionov, V. M., Villata, M., Raiteri, C. M., et al. 2009, The Astronomer’s Telegram, 2222, 1
- Lister et al. (2009) Lister, M. L., Aller, H. D., Aller, M. F., et al. 2009, AJ, 137, 3718
- Lobanov & Zensus (1999) Lobanov, A. P. & Zensus, J. A. 1999, ApJ, 521, 509
- Marziani et al. (1996) Marziani, P., Sulentic, J. W., Dultzin-Hacyan, D., Calvani, M., & Moles, M. 1996, ApJS, 104, 37
- Mattox et al. (1996) Mattox, J. R., Bertsch, D. L., Chiang, J., et al. 1996, ApJ, 461, 396
- Max-Moerbeck et al. (2010) Max-Moerbeck, W., Richards, J. L., Pavlidou, V., et al. 2010, in Fermi meets Jansky - AGN in Radio and Gamma-Rays, ed. T. Savolainen, E. Ros, W. P. Porcas, & J. A. Zensus, 77–80
- Myers et al. (2003) Myers, S. T., Jackson, N. J., Browne, I. W. A., et al. 2003, MNRAS, 341, 1
- Poole et al. (2008) Poole, T. S., Breeveld, A. A., Page, M. J., et al. 2008, MNRAS, 383, 627
- Pushkarev et al. (2010) Pushkarev, A. B., Kovalev, Y. Y., & Lister, M. L. 2010, ApJ, 722, L7
- Pushkarev et al. (2009) Pushkarev, A. B., Kovalev, Y. Y., Lister, M. L., & Savolainen, T. 2009, A&A, 507, L33
- Rando et al. (2009) Rando et al. 2009, ArXiv e-prints, arXiv:0907.0626
- Reyes & Cheung (2009) Reyes, L. C. & Cheung, C. C. 2009, The Astronomer’s Telegram, 2226, 1
- Rolke et al. (2005) Rolke, W. A., López, A. M., & Conrad, J. 2005, NIM A, 551, 493
- Roming et al. (2005) Roming, P. W. A., Kennedy, T. E., Mason, K. O., et al. 2005, Space Science Reviews, 120, 95
- Roming et al. (2009) Roming, P. W. A., Koch, T. S., Oates, S. R., et al. 2009, ApJ, 690, 163
- Schinzel et al. (2010) Schinzel, F. K., Lobanov, A. P., Jorstad, S. G., et al. 2010, in Fermi meets Jansky - AGN in Radio and Gamma-Rays, ed. T. Savolainen, E. Ros, W. P. Porcas, & J. A. Zensus, 175–178, arXiv:1012.2820
- Schlegel et al. (1998) Schlegel, D. J., Finkbeiner, D. P., & Davis, M. 1998, ApJ, 500, 525
- Smith et al. (2002) Smith, J. A., Tucker, D. L., Kent, S., et al. 2002, AJ, 123, 2121
- Smith et al. (1985) Smith, P. S., Balonek, T. J., Heckert, P. A., Elston, R., & Schmidt, G. D. 1985, AJ, 90, 1184
- Stickel et al. (1989) Stickel, M., Fried, J. W., & Kuehr, H. 1989, A&AS, 80, 103
- Tavecchio et al. (2010) Tavecchio, F., Ghisellini, G., Bonnoli, G., & Ghirlanda, G. 2010, MNRAS, 405, L94
- Thompson et al. (1993) Thompson, D. J., Bertsch, D. L., Fichtel, C. E., et al. 1993, ApJS, 86, 629
- Timmer & Koenig (1995) Timmer, J. & Koenig, M. 1995, A&A, 300, 707
- Unwin et al. (1997) Unwin, S. C., Wehrle, A. E., Lobanov, A. P., et al. 1997, ApJ, 480, 596
- Unwin et al. (1994) Unwin, S. C., Wehrle, A. E., Urry, C. M., et al. 1994, ApJ, 432, 103
- Uttley et al. (2002) Uttley, P., McHardy, I. M., & Papadakis, I. E. 2002, MNRAS, 332, 231
- Villata et al. (2009) Villata, M., Raiteri, C. M., Gurwell, M. A., et al. 2009, A&A, 504, L9
- Villata et al. (2008) Villata, M., Raiteri, C. M., Larionov, V. M., et al. 2008, A&A, 481, L79
- Wilks (1938) Wilks, S. S. 1938, Ann. Math. Stat., 9, 60