The relation of optical/UV and X-ray emission in low-luminosity active galactic nuclei
Abstract
We study the relation of optical/UV and X-ray emission in the low luminosity active galactic nuclei (LLAGNs), using a sample of 49 sources including 28 local Seyfert galaxies and 21 low-ionization nuclear emission-line regions (LINERs) with the optical/UV spectral luminosity at the wavelength , , and the X-ray spectral luminosity at 2 keV, . The strong correlations are found between the X-ray luminosity and the optical/UV to X-ray index, , with the optical/UV luminosity, with the slopes very similar to the findings for the luminous AGNs in the previous works. The correlation between and is very weak as that found for the luminous AGNs in the majority of previous similar works. We also study the relation between and the Eddington ratio for our sample and find a significant anti-correlation for the sources with , which is opposite to the correlation between the two variables for the luminous AGNs. Using the advection dominated accretion flow (ADAF) model, we roughly reproduce this anti-correlationship for the two variables for the LLAGNs. This result strongly supports the ADAF as a candidate accretion mode in LLAGNs.
1 Introduction
In the long term and various types of studies on the active galactic nuclei (AGNs), the spectral energy distribution (SED) is one of the most focused topics investigated in both the observational and theoretical works, which is believed to provide clues to the physical mechanism of the emission from AGNs. There are many different types of active galaxies, such as Seyfert galaxies, radio galaxies, quasars, and low ionized nuclear emission-line region (LINER) galaxies, etc., which have different emission properties. Although the detailed physical mechanism is undetermined, it is commonly accepted that they probably have very different accretion modes which result in their different emission spectra. The optical/UV continuum in the luminous quasar is supposed to be the blackbody radiation from the thin accretion disk surrounding the black hole in AGN, while the X-ray emission is originated from the hot corona located above the thin disk where the disk seed photons are inverse Compton up-scattered by the energetic electrons (e.g., Zdziarski et al., 1999; Chiang, 2002; Fabian et al., 2002; Middleton et al., 2007; Cao, 2009; Veledina et al., 2010). For low-luminosity AGNs (LLAGNs), namely LINERs and local Seyfert galaxies, it is still unclear whether the accretion mode is the same as luminous AGNs or a different accretion mode and physical mechanism is present. By comparing the nuclear spectral energy distribution (SED) of 13 nearby LINERs with the average SED of powerful quasars, Maoz (2007) found that the broad band SEDs of LINERs are quite similar to the SED of more luminous AGN. Papadakis et al. (2008) studied the near-IR to X-ray spectrum of four low luminosity Seyfert 1 galaxies and concluded these LLAGNs have the same shape as the spectrum of quasars that are times more luminous, which suggested that the thin accretion disk plus hot corona model may still sustain at low accretion rate in the LLAGNs. However, Ho (1999) found that the LLAGN SEDs have a weak or absent blue bump which is a typical emission characterizing the blackbody radiation from the thin accretion disk. Advection-dominated accretion flows (ADAFs) have been suggested to be present in many black hole systems accreting at low rates, including some quiescent X-ray binaries and LLAGNs, to reproduce the spectral energy distributions (SEDs) from these sources(e.g., Narayan & Yi, 1994, 1995; Lasota et al., 1996; Narayan et al., 1996, 1998). Quataert et al. (1999) showed that the optical/UV to X-ray emission detected from the nuclei of M81 and NGC 4579 can be well explained by an optically thick, geometrically thin accretion disk which extends down to (, inside which an ADAF is present) (Xu & Cao, 2009). Ptak et al. (2004) found that ADAF models can be used to fit the UV to X-ray SED of a LINER galaxy, NGC 3998 quite well. Moreover, Gu & Cao (2009) found a significant anticorrelation between the hard X-ray photon index and the Eddington ratio for a sample of LLAGNs (see also Younes et al., 2011), which is in contrast with the positive correlation for luminous AGNs (Wang et al., 2004; Shemmer et al., 2006, 2008), but similar to that of X-ray binaries (XRBs) in the low/hard state (Yamaoka et al., 2005; Yuan et al., 2007). They suggested that the accretion mode in LLAGNs may be similar to that of XRBs in the low/hard state, of which the X-ray emission is assumed to originate from the Comptonization process in ADAF.
The relations between the quantities characterizing the optical/UV and X-ray properties of the observed AGN SEDs have been comprehensively studied. Some studies suggested that the dependence of the optical/UV to X-ray spectral indices between the rest-frame 2500 and 2 keV, , on optical/UV luminosity may be primarily caused by the dependence on redshift (Bechtold et al., 2003; Kelly et al., 2007), and some others argued that this dependence may be artificially resulted from the larger dispersion of the optical luminosities deviating from the average SED than that of the X-ray luminosities (Yuan et al., 1998; Tang et al., 2007). Many recent works found the significant relations between (and X-ray luminosity) with optical/UV luminosity in different wide luminosity and redshift range AGN samples (e.g., Vignali et al., 2003; Strateva et al., 2005; Steffen et al., 2006; Just et al., 2007; Young et al., 2010; Grupe et al., 2010; Lusso et al., 2010). Most of these previous works focused on the luminous AGN sources, with the optical luminosity and the Eddington luminosity ratio , which showed that is positively correlated with the Eddington luminosity ratio for the different samples. Following the spectral evolution of a galactic black hole binary, GRO J1655-40, Sobolewska et al. (2011) simulated the spectral states of AGN and modeled SEDs for a mixture of AGNs in different spectral states, which predicted that the correlations between and the Eddington luminosity ratio changes the sign when the the Eddington luminosity ratio changes from above to below a critical value, .
In this work, we use a sample of 49 LLAGNs to explore the relations between and X-ray luminosity with optical/UV luminosity, and the relation between and the Eddington luminosity ratio in LLAGNs, and compare the results with those of previous works. In addition, we try to model the SEDs of LLAGNs in different accretion rates and different black hole masses with ADAF models, and compare the theoretical results with the observational ones. The sample and the estimates of the optical luminosity for the sources are described in §2. In §3, we present the results for the sample. We use the ADAF model to explain the statistic results of the LLAGNs in §4 and the discussion is in §5. The cosmological parameters , and have been adopted in this work.
2 The Sample
For the purpose of our study on LLAGN, we construct a sample of 49 AGN sources including 21 LINERs and 28 local Seyfert galaxies, which originate from a sample compiled by Gu & Cao (2009). The objects in Gu & Cao (2009)’s sample are drawn from the Palomar sample (Ho et al., 1997a; Ho, 2008) and the multi-wavelength catalogue of LINER (MCL) (Carrillo et al., 1999). To complete their study on the relation between the hard X-ray photon index and the Eddington ratio in LLAGN, they carefully selected sources for the sample. The X-ray observation with Chandra and XMM-Newton were searched for the objects. The sources without the nuclei at hard X-ray band ( keV) were excluded to ensure that the X-ray emission are really from the nuclear component of the AGN. The Compton-thick sources were also excluded because the Compton-thick absorption may flat the X-ray photon index in 2-10 keV spectral fitting which leads error in the study. In addition, the measurement of black hole mass or stellar velocity dispersion were also one of the selected criteria for the sample. They finally compiled a sample of 55 sources, of which 27 are LINERs and 28 are local Seyfert galaxies. These 28 local Seyfert galaxies are totally selected for our sample. For the 27 LINERS, we select 21 of them for our sample, the remaining 6 LINERs are excluded because the observational data used to calculate the optical/UV luminosity for the study of this work are unavailable.
For the selected sources in our sample, the redshift , the black hole mass , the spectral photon index , and the integrated 2-10 keV luminosity for every sources are all available in Gu & Cao (2009) for our present investigation. To obtain the optical/UV luminosity, we use several different approaches for the sources which have different observational data. For 19 Seyferts, we use the observed absolute B magnitude of the nucleus (Ho & Peng, 2001) to compute the optical/UV luminosity of the source combined with the observed distance (labeled as approach 1). Analyzing the high-resolution images of the objects observed by the Hubble Space Telescopes (HST), Ho & Peng (2001) obtained the nuclear magnitudes and luminosities of H lines including narrow plus broad components. The absolute magnitudes of the nuclei have been corrected for Galactic extinction but not for internal extinction. Ho & Peng (2001) also presented a relation between the optical continuum and Balmer emission line luminosity which is valid for both luminous and low-luminosity AGNs.
For the other 9 Seyferts and 3 LINERs, we use the data of optical emission lines, H (narrow plus broad component) luminosity (Ho et al., 1997b) and the ratio of H to H (Ho et al., 1997a), to compute the luminosity of (labeled as approach 2). For other 7 LINERs, only narrow component of H is available (Ho et al., 1997a), but the ratio of broad H to total (broad plus narrow component) H (Ho et al., 1997b) and the ratio of H to H (Ho et al., 1997a) are also available, thus we can calculate the total H luminosity (labeled as approach 3). For the left 11 LINERs, we have narrow H luminosity and the ratio of H to H for every source (Ho et al., 1997a), but the ratio of broad H to total H is not available. The averaged value from the former 7 LINERs are used (labeled as approach 4), which should be reasonable. The absolute B magnitudes for the above sources can then be obtained according to the relation of and (Ho & Peng, 2001)
| (1) |
With the corrected absolute B magnitudes and the distances derived from the redshift, we can then calculate the B band spectral fluxes and luminosities from the nuclei of the sources for this work. A typical spectral index for the featureless optical/UV continuum of the Seyfert 1 nuclei (e.g., Ward et al., 1987), , is adopted in the calculation. All the data for our sample are listed in Table 1.
3 Calculation of the optical/UV-to-X-ray indices for the sample
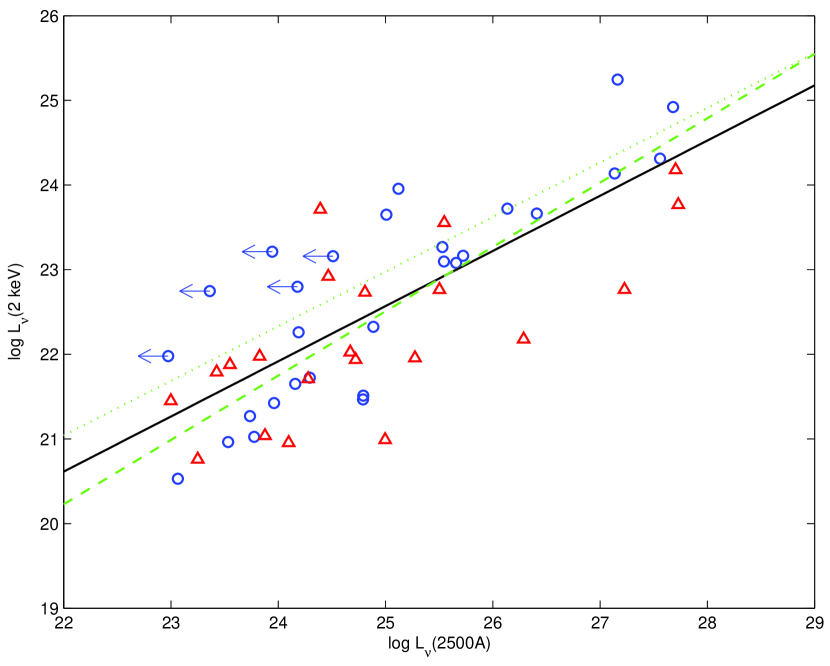
When the B band optical luminosity is derived from the absolute B magnitude, we can extrapolate the optical continuum to the UV with the typical optical spectral index, , and obtain the spectral luminosity at the wavelength , . The X-ray spectral luminosity at 2 keV , , can be computed with the known integrated 2-10 keV luminosity and the hard X-ray photon index compiled from Gu & Cao (2009). Figure 1 displays the relations between the the X-ray spectral luminosity and the optical/UV spectral luminosity at the wavelength , , of our sample. We find a significant correlation for the two quantities as follows:
| (2) |
with the probability of a null coefficient . The optical/UV and X-ray spectral luminosities of our sample ranged in and , respectively.
The optical/UV-to-X-ray spectral index, which is traditionally defined as
| (3) |
can be calculated with optical/UV and X-ray spectral luminosities. We list the derived optical/UV luminosity, X-ray spectral luminosity, and of our sample in Table 1.
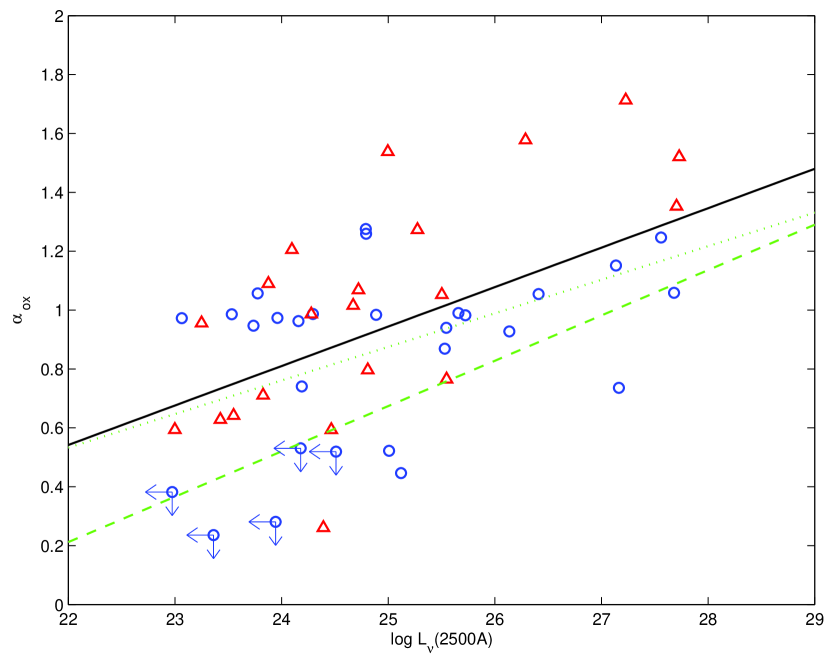
The relation between and for the sources in our sample is also studied as many previous similar works. The result is shown in Figure 2. The optical/UV-to-X-ray spectral index, , lies from to for the most sources. We find a significant correlation between and , the significance level for disapproving the null hypothesis that the two variables are uncorrelated is less than for all the sources. The best-fitting linear regression line for the sample is
| (4) |
which is also plotted in Figure 2. The fitted slope is consistent with that inferred from the relation of and the definition of in equation 3.
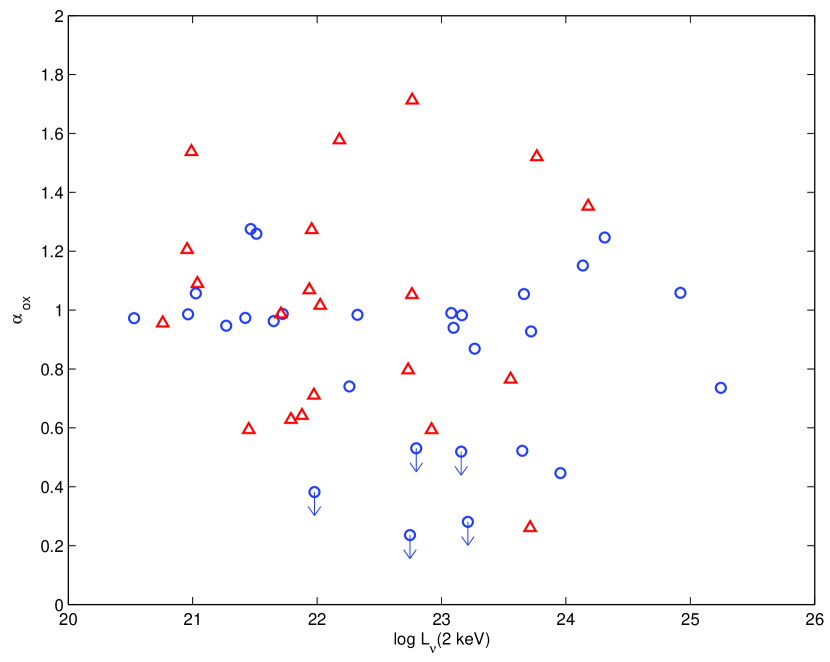
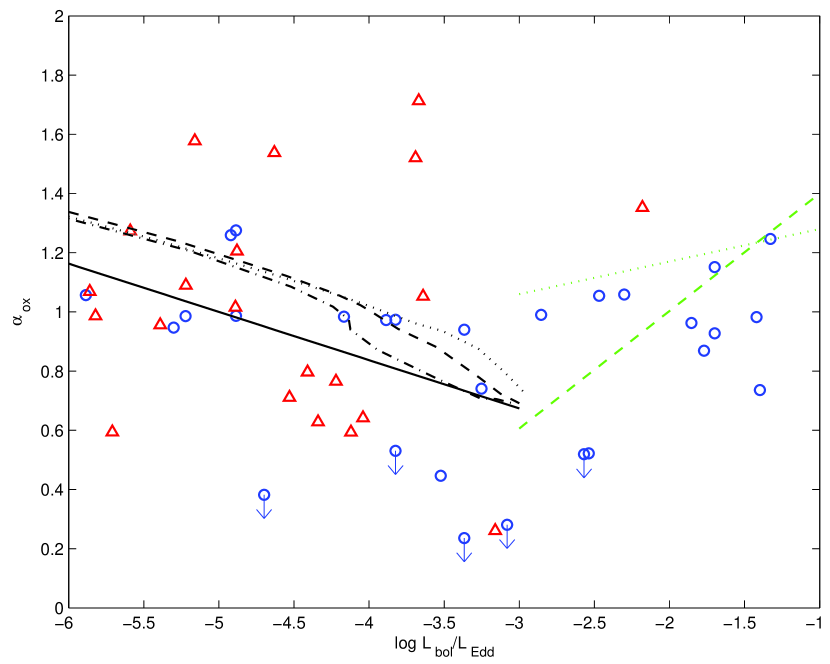
We also investigate the relationship between and the X-ray spectral luminosity at 2 keV, . The significance level for approving that the two variables are correlated is about for . Moreover, the relationship between and the Eddington ratio is explored, where the bolometric luminosity is calculated from the integrated 2-10 keV X-ray luminosity assuming that as done by Gu & Cao (2009). For all the sources of our sample, we find that the significance level for approving that the two variables are anti-correlated is about for . According to the ADAF model, the optically thin ADAF solution exists only for the mass accretion rate (defined as , ) less than a critical value , which is a dependence of the viscosity parameter , (Mahadevan, 1997; Narayan et al., 1998). For the adopted parameter in our calculations (see next section for the details), the corresponding value of the critical mass accretion rate is , above which no global ADAF solution is available. From our theoretical calculations with ADAF model (see next section for the details), we find that the ADAF accreting at corresponds to the Eddingtong ratio . Thus, we re-test the relation of for the sources with . After excluding the sources with the Eddingtong ratio , the significance level for approving that the two variables are anti-correlated is improved to about . The best-fitting linear regression line for 36 sources with the Eddingtong ratio is
| (5) |
Figures 3 and 4 show the relations of and , respectively.
4 The optical/UV-to-X-ray indices simulated with the ADAF model
The ADAFs are supposed to be present in LLAGNs, of which the accretion rate is very low, e.g., below the critical value, . The global structure of an ADAF surrounding a black hole with mass can be calculated, if some parameters, , , and , are specified. We employ the approach suggested by Manmoto (2000) to calculate the global structure of an accretion flow surrounding a Schwarzschild black hole in the general relativistic frame. All the radiation processes are included in the calculations of the global accretion flow structure (see Manmoto, 2000; Yuan et al., 2009, for details and the references therein). The values of parameters adopted in this work are different from those in Manmoto (2000). The value of the viscosity parameter is still a controversial issue (see Xu, 2011, for details and the references therein). In this work, a typical value of the viscosity parameter is adopted in the calculations. The parameter , defined as , (), describes the magnetic field strength of the accretion flow. We assume in all the calculations. This parameter will mainly affect the radio spectrum from the source, while it affects little on the optical/UV and X-ray emission, which we mostly focus on in this work. The parameter describes the fraction of the viscously dissipated energy directly going into electrons in the accretion flow. It was pointed out that a significant fraction of the viscously dissipated energy could go into electrons by magnetic reconnection, if the magnetic fields in the flow are strong (Bisnovatyi-Kogan & Lovelace, 1997, 2000). The value of is still uncertain, usually between 0.1-0.5 (Cao, 2005, 2007), and we adopt a conventional value of in all the calculations.
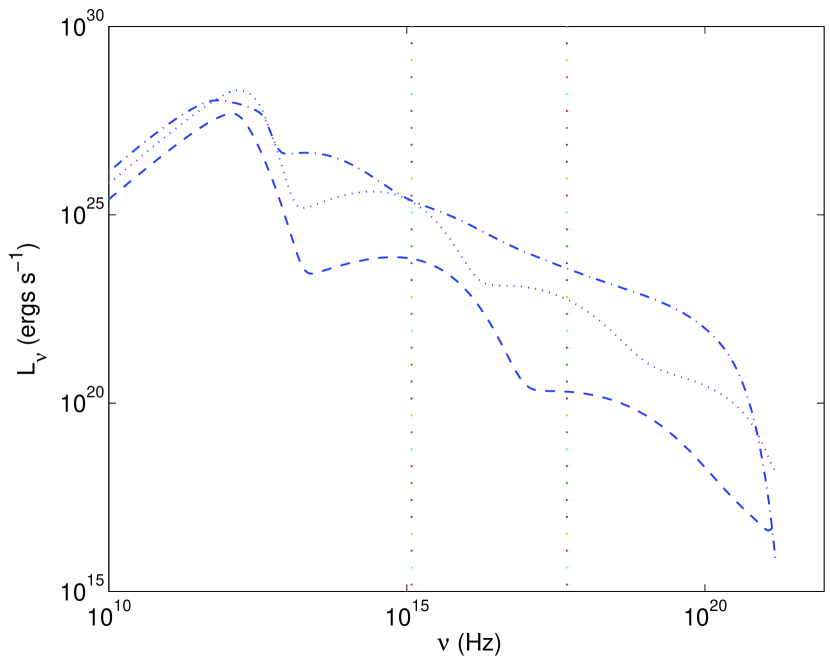
Given the values for parameters , and , the mass accretion rate is changed from to to simulate the LLAGNs with different Eddington ratios. The typical black hole masses , , and are adopted for the LLAGNs in the calculations. The global structure of the ADAF is obtained, with which the spectrum of LLAGNs are calculated.
From the derived spectrum of every simulated LLAGN, the optical/UV to X-ray indices and the Eddington luminosity ratio can then be calculated. To compare the simulated results with the sample, the bolometric luminosity of the simulated AGN is also calculated from the integrated 2-10 keV X-ray luminosity assuming that . The relations of with are plotted in different types of lines in Figure 4 for different black hole masses and .
5 Discussion
In this paper, we have explored the relations between and the X-ray luminosity with the optical/UV luminosity, and the relation between and the Eddington luminosity ratio for a sample of 49 LLAGNs, including 21 LINERs and 28 local Seyfert galaxies.
The observed significant correlations in and for our LLAGN sample are similar to those results given in the previous works for luminous AGNs (e.g., Vignali et al., 2003; Strateva et al., 2005; Steffen et al., 2006; Just et al., 2007; Young et al., 2010; Grupe et al., 2010; Lusso et al., 2010). The slope of relation we obtained in this work is 0.652, an intermediate value between the slopes, (Strateva et al., 2005; Lusso et al., 2010), presented in the previous works. The slope of relation we obtained in this work is 0.134, an intermediate value between the slopes, (Grupe et al., 2010; Lusso et al., 2010), derived in the previous works. These correlations between and imply that the more luminous AGN sources emit more both in the optical/UV and X-ray bands, while the X-ray emission increases more quickly than the optical/UV emission, if we believed that these correlations are intrinsic in the SEDs of AGNs rather than the artificial results caused by the different dispersions in the optical/UV and X-ray luminosities for the sample. Although the thin disk plus hot corona model is commonly accepted to be the possible accretion model for the luminous AGNs to quantitatively explain the wide band emission, of which the optical/UV continuum is supposed to be the blackbody radiation from the thin disk while the X-ray emission originates from the hot corona where the disk seed photons are inverse Compton up-scattered by the energetic electrons, more quantitatively theoretical calculations about the optical/UV and X-ray emission correlations are needed to support these arguments. On the other hand, the similarity of the correlation in and for our LLAGN sample comparing with the luminous AGN samples in previous works can not rule out the possibility that there are different accretion modes presented in the LLAGNs from that in the luminous AGNs, if the accretion mode in the LLAGNs can also satisfy these correlations. The ADAF model suggested to be present in the low luminosity accretion systems is one of the choices. According to the theoretical calculations as stated in §4, we find that the simulated LLAGN SEDs with the ADAF model can also qualitatively explain the correlations in and we derived for our LLAGN sample (see Figure 5). In the ADAF model, the optical/UV emission is mainly contributed from the inverse Compton scatter of soft synchrotron photons by the hot electron in the ADAF, and X-ray emission is contributed both from the inverse Compton scattering and the bremsstrahlung emission. For the luminous sources with high accretion rate, the inverse Compton component dominates the X-ray spectrum. More quantitative theoretical works based on the distribution functions for the AGNs as functions of various quantities such as black hole mass, accretion rate, etc., will provide more convincing explanations to the observed correlations, which is worthy to be studied in the future work.
The derived correlation of , with the slope of such as 0.397 (Lusso 2010), and 0.11 (Grupe 2010), for the luminous AGNs with - in the previous works changes the sign to be anti-correlation as Sobolewska et al. (2011) found, with the slope of -0.163, for the sources with in our LLAGN sample. This change of sign implies that the accretion mode for the LLAGNs may be different from the one for luminous AGNs. Thus, we simulate some LLAGNs SEDs with the ADAF model, and study the relation of for the simulated low luminosity sources. Changing the mass accretion rate from to for the sources with a given black hole mass, we find that the simulated optical/UV to X-ray indices decreases with the increasing mass accretion rate, predicting a strong anti-correlation between the two variables as showed in our analysis for the LLAGN sample (see Figure 4). It is needed to notice that the corresponding value is from to . According to many previous works (e.g., Narayan, 1996; Narayan et al., 1996; Esin et al., 1997, 1998; Cao, 2003; Xu & Cao, 2009), ADAFs may co-exist with the standard thin disks in the sources when mass accretion rates are slightly lower than the critical value, e.g., -. In this case, the ADAF is present in the inner region near the black hole and connects to a standard thin disk (plus hot corona) at a certain transition radius. The contribution of the outer thin disk (and hot corona) to the continuum may be important, which will change the optical/UV to X-ray index of the spectra. This may be the reason that an anti-correlation between and is present for the sources with . In addition, we also vary the black hole mass in the simulation, the relations are almost unchanged because the Eddington luminosity ratio is insensitive to the black hole mass. Although the theoretical relation curve is a bit higher than the fitted line for the sample, our simulation provide a strong support to the ADAF model as a candidate accretion mode in the LLAGNs. Our sample contains a small number of LLAGNs. More accumulated LLAGN sources will improve the work and strengthen our conclusions.
There have been claims that jet models can reproduce the SEDs of LLAGN such as Sgr A* and M81 (e.g., Falcke & Markoff, 2000; Yuan et al., 2002; Markoff et al., 2008). For the sources having jets, there should be some contribution from the jets to the X-ray emission, which may change the optical/UV to X-ray spectral index of these sources studied in this work. Prediction of the relation between the optical/UV to X-ray index and the Eddington fraction of LLAGNs with jet models can be compared with the observational statistical findings, which may give us a clue to the jet models. However, we still lack of certain evidence showing the presence of jets in most of LLAGN sources in our sample from both the theoretical and observational researches. Moreover, for those LLAGN sources probably possessing jets, it is shown that the dominance of the X-ray emission from the ADAF or jets depends on the X-ray luminosity of the source(Yuan & Cui, 2005; Wu et al., 2007, 2011). When the X-ray luminosity is below the critical value (), the X-ray emission from the jet should be the dominant emission rather than that from the accretion flow. While the X-ray luminosity of the majority sources of our sample is higher than , the X-ray emission from the ADAF should be the major contribution to the source. On the other hand, there are some additional free parameters describing the jet model than the pure ADAF model, e.g., the power normalization , temperature of particles entering base of jet , energy index of electron power-law tail (see Falcke & Biermann, 1995; Falcke & Markoff, 2000; Yuan et al., 2002; Markoff et al., 2008, for the details ). The dependence of the calculated spectrum on the model parameters and their interdependence are complex, and the values of the parameters are still uncertain. Prediction of the relation between the optical/UV to X-ray index and the Eddington fraction of LLAGNs with the jet model is somewhat dependent of the model parameters, which is beyond the scope of this work.
In this work, the bolometric luminosity is estimated from the integrated 2-10 keV X-ray luminosity assuming a constant bolometric correction, , which is determined from a mean energy distribution calculated from 47 luminous, mostly nearby quasars (Elvis et al., 1994). However, there is evidence that the bolometric correction depends on the Eddington ratio in AGN (e.g., Vasudevan & Fabian, 2007, 2009; Young et al., 2010). Vasudevan & Fabian (2007) suggested a more well-defined relationship between the bolometric correction and Eddington ratio in AGN, with a transitional region at an Eddington ratio of , below which the bolometric correction is typically 15-25, and above which it is typically 40-70. The constant bolometric correction, , we adopted in this work is typical for luminous AGNs with Eddington ratio . Since the Eddington ratio (or the X-ray 2-10 keV luminosity) of the LLAGN sources in our sample covers over five orders of magnitude and are all below , the bolometric correction and the calculated bolometric luminosity may be smaller than what we show in Table 1 and Figure 4, if the dependence of the bolometric correction on the Eddington ratio in AGN does exist. Moreover, the lower the Eddington ratio (or the X-ray 2-10 keV luminosity), the smaller the bolometric correction. Thus, the slope of the correlation between and may be smaller than that obtained in this work.
The optical/UV-to-X-ray index, , for most of the sample spans the range , very similar to the results of Maoz (2007) () and Eracleous et al. (2010) (). However, the scatter of the sources is obvious and nonnegligible, with 8 objects having and 4 objects having . It appears that the scatter is not random (see Figures 2 and 4), the objects with are mostly Seyferts and with are mostly LINERs. The sources of this scatter are not very certain. There are several possible sources which may originate from several factors. (1) The scatter of the Seyferts with very low may be due to the difficulty of the measurements. Even with HST resolution, it is in practice very difficult to reliably measure nuclear continumm magnitudes for very faint sources. In our sample, only lower limit magnitudes are available for five optically faint Seyferts, e.g., NGC 2639, 4138, 4168, 4258, and 7479, and the optical/UV to X-ray indices of these faint sources are all less than 0.6. Note that the larger magnitudes will result in lower optical luminosity and higher optical/UV to X-ray indices for the faint sources, and increase the scatter in the figures. (2) The optical/UV spectral luminosity of the LINERs are all calculated from the Balmer emission-line measurements (approaches 2, 3, and 4) using the relation derived by fitting the combined sample including PG quasars and local Seyfert galaxies(Ho & Peng, 2001). It is found that the relation for Seyferts appears marginally shallower than that for quasars (see the dashed line in Figure 6 of Ho & Peng, 2001). Therefore, the absolute B magnitude of the low luminosity sources may be overestimated with a steeper relation, and systematically result in a larger for the objects calculated with approaches 2, 3, and 4 including all the LINERs and 9 Seyferts. For the five faint Seyfert galaxies NGC 2639, 4138, 4168, 4258, and 7479, we also use the relation to re-estimate the optical/UV spectral luminosity and the optical/UV to X-ray indices (approach 2), the calculated becomes larger and in the range . Thus, the of 19 Seyferts calculated with approach 1 may be systematically lower than those of objects calculated with approaches 2, 3, and 4. Moreover, the total line luminosity of , , including broad and narrow components is computed with different types of line data in approaches 2, 3, and 4 (see section 2 for details), which may also introduce scatter of in the result. (3) The X-ray data of Seyfert galaxies are all from the same study using the homogeneous analysis, while that of LINERs are from various works with the different spectral analysis (see Gu & Cao, 2009, and reference therein). This makes it very difficult to analyze the systematic scatter of of these LINERs due to its inhomogeneity.
References
- Bechtold et al. (2003) Bechtold, J., et al. 2003, ApJ, 588, 119
- Bisnovatyi-Kogan & Lovelace (1997) Bisnovatyi-Kogan G. S., & Lovelace R. V. E. 1997, ApJ, 486, L43
- Bisnovatyi-Kogan & Lovelace (2000) Bisnovatyi-Kogan G. S., & Lovelace R. V. E., 2000, ApJ, 529, 978
- Cao (2003) Cao, X. 2003, ApJ, 599, 147
- Cao (2005) Cao, X. 2005, ApJ, 631, L101
- Cao (2007) Cao, X. 2007, ApJ, 659, 950
- Cao (2009) Cao, X. 2009, MNRAS, 394, 207
- Carrillo et al. (1999) Carrillo, R., Masegosa, J., Dultzin-Hacyan, D., & Ordoñez, R. 1999, Rev. Mexicana Astron. Astrofis., 35, 187
- Eracleous et al. (2010) Eracleous, M., Hwang, J. A., & Flohic, H. M. L. G. 2010, ApJS, 187, 135
- Chiang (2002) Chiang, J. 2002, ApJ, 572, 79
- Elvis et al. (1994) Elvis, M., et al. 1994, ApJS, 95, 1
- Esin et al. (1997) Esin, A. A., McClintock, J. E., & Narayan, R. 1997, ApJ, 489, 865
- Esin et al. (1998) Esin, A. A., Narayan, R., Cui, W., Grove, J. E., & Zhang, S.-N. 1998, ApJ, 505, 854
- Fabian et al. (2002) Fabian, A. C., Ballantyne, D. R., Merloni, A., Vaughan, S., Iwasawa, K., & Boller, T. 2002, MNRAS, 331, L35
- Falcke & Biermann (1995) Falcke, H., & Biermann, P. L. 1995, A&A, 293, 665
- Falcke & Markoff (2000) Falcke, H., & Markoff, S. 2000, A&A, 362, 113
- Grupe et al. (2010) Grupe, D., Komossa, S., Leighly, K. M., & Page, K. L. 2010, ApJS, 187, 64
- Gu & Cao (2009) Gu, M., & Cao, X. 2009, MNRAS, 399, 349
- Ho (1999) Ho, L. C. 1999, ApJ, 516, 672
- Ho (2008) Ho, L. C. 2008, ARA&A, 46, 475 ApJ, 555, 650
- Ho et al. (1997a) Ho, L. C., Filippenko, A. V., & Sargent, W. L. W. 1997a, ApJS, 112, 315
- Ho et al. (1997b) Ho, L. C., Filippenko, A. V., Sargent, W. L. W., & Peng, C. Y. 1997b, ApJS, 112, 391
- Ho & Peng (2001) Ho, L. C., & Peng, C. Y. 2001,
- Just et al. (2007) Just, D. W., Brandt, W. N., Shemmer, O., Steffen, A. T., Schneider, D. P., Chartas, G., & Garmire, G. P. 2007, ApJ, 665, 1004
- Kelly et al. (2007) Kelly, B. C., Bechtold, J., Siemiginowska, A., Aldcroft, T., & Sobolewska, M. 2007, ApJ, 657, 116
- Lasota et al. (1996) Lasota, J.-P., Abramowicz, M. A., Chen, X., Krolik, J., Narayan, R. & Yi, I. 1996, ApJ, 462, 142
- Lusso et al. (2010) Lusso, E., et al. 2010, A&A, 512, A34
- Mahadevan (1997) Mahadevan, R. 1997, ApJ, 477, 585
- Manmoto (2000) Manmoto, T. 2000, ApJ, 534, 734
- Markoff et al. (2008) Markoff, S., et al. 2008, ApJ, 681, 905
- Maoz (2007) Maoz, D. 2007, MNRAS, 377, 1696
- Middleton et al. (2007) Middleton, M., Done, C., & Gierliński, M. 2007, MNRAS, 381, 1426
- Narayan (1996) Narayan, R. 1996, ApJ, 462, 136
- Narayan et al. (1998) Narayan, R., Mahadevan, R., & Quataert, E. 1998, in Theory of Black Hole Accretion Disks, edited by Marek A. Abramowicz, Gunnlaugur Bjornsson, and James E. Pringle. Cambridge University Press, 1998., p.148
- Narayan et al. (1996) Narayan, R., McClintock, J. E.,& Yi, I., 1996, ApJ, 457, 821
- Narayan & Yi (1994) Narayan, R. & Yi, I. 1994, ApJ, 428, L13
- Narayan & Yi (1995) Narayan, R. & Yi, I. 1995, ApJ, 452, 710
- Papadakis et al. (2008) Papadakis, I. E., Ioannou, Z., Brinkmann, W., & Xilouris, E. M. 2008, A&A, 490, 995
- Ptak et al. (2004) Ptak, A., Terashima, Y., Ho, L. C., & Quataert, E. 2004, ApJ, 606, 173
- Quataert et al. (1999) Quataert, E., Di Matteo, T., Narayan, R. & Ho, L. C. 1999, ApJ, 525, L89
- Shemmer et al. (2006) Shemmer, O., Brandt, W. N., Netzer, H., Maiolino, R., & Kaspi, S. 2006, ApJ, 646, L29
- Shemmer et al. (2008) Shemmer, O., Brandt, W. N., Netzer, H., Maiolino, R., & Kaspi, S. 2008, ApJ, 682, 81
- Sobolewska et al. (2011) Sobolewska, M. A., Siemiginowska, A., & Gierliński, M. 2011, MNRAS, 413, 2259
- Steffen et al. (2006) Steffen, A. T., Strateva, I., Brandt, W. N., Alexander, D. M., Koekemoer, A. M., Lehmer, B. D., Schneider, D. P., & Vignali, C. 2006, AJ, 131, 2826
- Strateva et al. (2005) Strateva, I. V., Brandt, W. N., Schneider, D. P., Vanden Berk, D. G., & Vignali, C. 2005, AJ, 130, 387
- Tang et al. (2007) Tang, S. M., Zhang, S. N., & Hopkins, P. F. 2007, MNRAS, 377, 1113
- Vasudevan & Fabian (2007) Vasudevan, R. V., & Fabian, A. C. 2007, MNRAS, 381, 1235
- Vasudevan & Fabian (2009) Vasudevan, R. V., & Fabian, A. C. 2009, MNRAS, 392, 1124
- Veledina et al. (2010) Veledina, A., Vurm, I., & Poutanen, J. 2010, arXiv:1012.0439
- Vignali et al. (2003) Vignali, C., Brandt, W. N., & Schneider, D. P. 2003, AJ, 125, 433 & Garmire, G. P. 2007, ApJ, 665, 1004
- Wang et al. (2004) Wang, J.-M., Watarai, K.-Y., & Mineshige, S. 2004, ApJ, 607, L107
- Ward et al. (1987) Ward, M., Elvis, M., Fabbiano, G., Carleton, N. P., Willner, S. P., & Lawrence, A. 1987, ApJ, 315, 74
- Wu et al. (2007) Wu, Q., Yuan, F., & Cao, X. 2007, ApJ, 669, 96
- Wu et al. (2011) Wu, Q., Cao, X., & Wang, D.-X. 2011, arXiv:1104.3235
- Xu (2011) Xu, Y.-D. 2011, ApJ, 729, 10
- Xu & Cao (2009) Xu, Y.-D., & Cao, X.-W. 2009, Research in Astronomy and Astrophysics, 9, 401
- Yamaoka et al. (2005) Yamaoka, K., Uzawa, M., Arai, M., Yamazaki, T., & Yoshida, A. 2005, Chinese Journal of Astronomy and Astrophysics Supplement, 5, 273
- Younes et al. (2011) Younes, G., Porquet, D., Sabra, B., & Reeves, J. N. 2011, A&A, 530, A149
- Young et al. (2010) Young, M., Elvis, M., & Risaliti, G. 2010, ApJ, 708, 1388
- Yuan & Cui (2005) Yuan, F., & Cui, W. 2005, ApJ, 629, 408
- Yuan et al. (2007) Yuan, F., Taam, R. E., Misra, R., Wu, X.-B., & Xue, Y. 2007, ApJ, 658, 282
- Yuan et al. (1998) Yuan, W., Siebert, J., & Brinkmann, W. 1998, A&A, 334, 498
- Yuan et al. (2002) Yuan, F., Markoff, S., & Falcke, H. 2002, A&A, 383, 854
- Yuan et al. (2009) Yuan, Y.-F., Cao, X., Huang, L., & Shen, Z.-Q. 2009, ApJ, 699, 722
- Zdziarski et al. (1999) Zdziarski, A. A., Lubinski, P., & Smith, D. A. 1999, MNRAS, 303, L11
| Name | log | log | approach | |||||
|---|---|---|---|---|---|---|---|---|
| (1) | (2) | (3) | (4) | (5) | (6) | (7) | (8) | (9) |
| Seyfert galaxies | ||||||||
| NGC 1275 | 0.017559 | 8.51 | -25.92 | 1.06 | 24.92 | 27.68 | -2.30 | 1 |
| NGC 2639 | 0.011128 | 8.02 | -29.02 | 0.53 | 22.80 | 24.18 | -3.82 | 1 |
| NGC 3031 | -0.000113a | 7.80 | -26.03 | 0.98 | 22.32 | 24.89 | -4.17 | 1 |
| NGC 3227 | 0.003859 | 7.59 | -25.86 | 1.05 | 23.66 | 26.41 | -2.47 | 1 |
| NGC 3516 | 0.008836 | 7.36 | -25.86 | 1.15 | 24.14 | 27.14 | -1.70 | 1 |
| NGC 4051 | 0.002336 | 6.11 | -26.11 | 0.98 | 23.16 | 25.72 | -1.42 | 1 |
| NGC 4138 | 0.002962 | 7.75 | -28.10 | 0.28 | 23.21 | 23.94 | -3.08 | 1 |
| NGC 4151 | 0.003319 | 7.18 | -24.58 | 1.25 | 24.31 | 27.56 | -1.33 | 1 |
| NGC 4168 | 0.007388 | 7.95 | -29.86 | 0.38 | 21.98 | 22.97 | -4.70 | 1 |
| NGC 4258 | 0.001494 | 7.61 | -28.08 | 0.24 | 22.75 | 23.36 | -3.37 | 1 |
| NGC 4388 | 0.008419 | 6.80 | -26.82 | 0.93 | 23.72 | 26.14 | -1.70 | 1 |
| NGC 4395 | 0.001064 | 5.04 | -26.99 | 0.96 | 21.65 | 24.16 | -1.85 | 1 |
| NGC 4565 | 0.004103 | 7.70 | -27.54 | 1.28 | 21.47 | 24.79 | -4.89 | 1 |
| NGC 4579 | 0.005067 | 7.78 | -26.96 | 0.94 | 23.10 | 25.55 | -3.37 | 1 |
| NGC 4639 | 0.003395 | 6.85 | -27.97 | 0.74 | 22.26 | 24.19 | -3.25 | 1 |
| NGC 5033 | 0.002919 | 7.30 | -26.37 | 0.99 | 23.08 | 25.66 | -2.85 | 1 |
| NGC 5273 | 0.003549 | 6.51 | -26.67 | 0.87 | 23.27 | 25.53 | -1.77 | 1 |
| NGC 5548 | 0.017175 | 8.03 | -26.41 | 0.74 | 25.25 | 27.16 | -1.40 | 1 |
| NGC 7479 | 0.007942 | 7.07 | -28.39 | 0.52 | 23.16 | 24.51 | -2.57 | 1 |
| NGC 2655 | 0.004670 | 7.77 | -27.43 | 0.52 | 23.65 | 25.01 | -2.54 | 2 |
| NGC 2685 | 0.002945 | 7.15 | -28.08 | 0.97 | 21.42 | 23.96 | -3.82 | 2 |
| NGC 3147 | 0.009407 | 8.79 | -27.93 | 0.45 | 23.96 | 25.12 | -3.52 | 2 |
| NGC 3486 | 0.002272 | 6.14 | -28.75 | 0.97 | 20.53 | 23.06 | -3.89 | 2 |
| NGC 3941 | 0.003095 | 8.15 | -28.30 | 1.06 | 21.03 | 23.78 | -5.89 | 2 |
| NGC 4477 | 0.004520 | 7.92 | -28.12 | 0.99 | 21.72 | 24.29 | -4.89 | 2 |
| NGC 4501 | 0.007609 | 7.90 | -28.07 | 1.26 | 21.51 | 24.79 | -4.92 | 2 |
| NGC 4698 | 0.003342 | 7.84 | -28.41 | 0.95 | 21.27 | 23.74 | -5.30 | 2 |
| NGC 4725 | 0.004023 | 7.49 | -28.78 | 0.99 | 20.96 | 23.53 | -5.22 | 2 |
| LINERs | ||||||||
| NGC 266 | 0.015547 | 7.90 | -27.99 | 1.05 | 22.76 | 25.50 | -3.64 | 3 |
| NGC 0315 | 0.016485 | 9.24 | -27.99 | 0.77 | 23.56 | 25.55 | -4.22 | 3 |
| NGC 2681 | 0.002308 | 7.20 | -27.73 | 1.21 | 20.95 | 24.10 | -4.88 | 3 |
| NGC 3226 | 0.003839 | 8.24 | -27.80 | 0.59 | 22.92 | 24.47 | -4.12 | 3 |
| NGC 3718 | 0.003312 | 7.97 | -28.31 | 0.71 | 21.97 | 23.83 | -4.53 | 3 |
| NGC 4143 | 0.003196 | 8.31 | -27.44 | 1.02 | 22.03 | 24.67 | -4.89 | 3 |
| NGC 4278 | 0.002165 | 9.20 | -27.05 | 1.07 | 21.94 | 24.72 | -5.86 | 3 |
| NGC 3169 | 0.004130 | 7.95 | -27.94 | 0.26 | 23.71 | 24.39 | -3.16 | 4 |
| NGC 4261 | 0.007465 | 8.94 | -28.04 | 0.80 | 22.73 | 24.81 | -4.41 | 4 |
| NGC 4374 | 0.003536 | 8.80 | -27.92 | 0.99 | 21.71 | 24.28 | -5.82 | 4 |
| NGC 4457 | 0.002942 | 7.00 | -27.04 | 1.54 | 20.99 | 25.00 | -4.63 | 4 |
| NGC 4494 | 0.004483 | 7.60 | -28.53 | 1.09 | 21.04 | 23.88 | -5.22 | 4 |
| NGC 4548 | 0.001621 | 7.51 | -28.09 | 0.63 | 21.79 | 23.43 | -4.34 | 4 |
| NGC 4552 | 0.001071 | 8.50 | -28.16 | 0.59 | 21.45 | 23.00 | -5.71 | 4 |
| NGC 4594 | 0.003639 | 9.04 | -26.95 | 1.27 | 21.96 | 25.27 | -5.59 | 4 |
| NGC 4736 | 0.001027 | 7.42 | -27.87 | 0.96 | 20.76 | 23.25 | -5.39 | 4 |
| NGC 5746 | 0.005751 | 7.49 | -29.07 | 0.64 | 21.88 | 23.55 | -4.04 | 4 |
| NGC 6500 | 0.010017 | 8.28 | -26.82 | 1.58 | 22.18 | 26.29 | -5.16 | 4 |
| UGC 08696 | 0.037780 | 7.74 | -26.57 | 1.35 | 24.18 | 27.70 | -2.18 | 2 |
| NGC 6240 | 0.024480 | 9.11 | -26.16 | 1.52 | 23.77 | 27.73 | -3.69 | 2 |
| NGC 7130 | 0.016151 | 7.54 | -26.30 | 1.71 | 22.76 | 27.23 | -3.67 | 2 |
Note. — Col.(1): Source name. Col.(2): Redshift. Col.(3): Black hole mass. Col.(4): , the logarithmic spectral flux at B band in units of . Col.(5): Derived optical/UV to X-ray luminosity index. Col. (6): , the logarithmic X-ray spectral luminosity at 2 keV in units of . Col. (7): , the logarithmic optical/UV spectral luminosity at the wavelength in units of . Col.(8): Eddington luminosity ratio. Col.(9): Approach number. The numbers 1, 2, 3, and 4, refer to the different approaches we used to obtain the absolute B magnitude for the sources with different usable data, see the text in §2 for the details.
a Distance of 3.5 Mpc.