59Co NMR evidence for charge and orbital order in the kagomé like structure of Na2/3CoO2
Abstract
We report a complete set of 59Co NMR data taken on the phase of sodium cobaltates NaxCoO2, for which we have formerly established the in plane Na ordering and its three dimensional stacking from a combination of symmetry arguments taken from Na and Co NQR/NMR data. Here we resolve all the parameters of the Zeeman and quadrupolar Hamiltonians for all cobalt sites in the unit cell and report the temperature dependencies of the NMR shift and spin lattice relaxation data for these sites. We confirm that three non-magnetic Co3+ (Co1) are in axially symmetric positions and that the doped holes are delocalized on the nine complementary magnetic cobalt sites (Co2) of the atomic unit cell. The moderately complicated atomic structure resumes then in a very simple electronic structure in which the electrons delocalize on the Co2 kagomé sublattice of the triangular lattice of Co sites. The observation of a single temperature dependence of the spin susceptibilities indicates that a single band picture applies, and that the magnetic properties are dominated by the static and dynamic electronic properties at the Co2 sites. We evidence that they display a strong in plane electronic anisotropy initially unexpected but which accords perfectly with an orbital ordering along the kagomé sublattice organization. These detailed data should now permit realistic calculations of the electronic properties of this compound in order to determine the incidence of electronic correlations.
pacs:
76.60.-k, 71.27.+a, 71.28.+dI Introduction
The cobaltates NaxCoO2 are layered oxyde materials somewhat similar to the cuprates in as much as the charge doping of the CoO2 layers is controlled on a large range by variation of the Na content. This can be put in parallel with the doping of the cuprates by chemical substitutions on the layers separating the CuO2 planes. One significant difference with the cuprates is that the Co of the CoO2 plane are ordered on a triangular lattice and not on a square lattice as for the CuO2 plane of the cuprates. In this configuration the large crystal field on the Co site favors a low spin state in which orbital degeneracy influences significantly the electronic properties and may yield large thermoelectric effects.Terasaki et al. (1997) A rich variety of other physical properties ranging from ordered magnetic states,Mendels et al. (2005) high Curie-Weiss magnetism and metal insulator transition,Foo et al. (2004) superconductivityTakada et al. (2003) etc have then been observed on the cobaltates.
In most cases the theoretical calculations considered to explain the physical properties of cuprates and cobaltates have assumed uniform delocalization of the carriers in the layersSingh (2000) and the incidence of the coulomb potential of the ionic dopants has been generally considered as unimportant.
Experimentally though, the disorder due to the dopants has been shown to have an important incidence on the local electronic properties in the cuprates and can blur the physical properties and may drive as well system specific, that is non generic properties of the CuO2 planes. For instance static stripe charge organization of the CuO2 planes have been seen only on specific systems such as La2-xBaxCuO4 for which static distortions lead to an orthorombicity of the structure.Abbamonte et al. (2005) Some anisotropic electronic properties of YBa2Cu3O6+x compounds might as well tentatively be associated with the incidence of the ordered CuO chains which drive the doping of the CuO2 planes.Ando et al. (2002)
In the cobaltates, NMR experiments and structural investigations have given evidence that for a large interplay occurs between atomic arrangements and electronic properties, as the Na are found to be ordered.Zandbergen et al. (2004); Mukhamedshin et al. (2004); Alloul et al. (2008); Roger et al. (2006); Shu et al. (2007); Huang et al. (2009) It has been shown earlier that this ordering is associated quite systematically with cobalt charge disproportionation into and Co charge states.Mukhamedshin et al. (2005); Alloul et al. (2008); Lang et al. (2008); Julien et al. (2008) As the cobalt ions in sodium cobaltates are in low spin configurations the Co3+ has an electronic spin and appears to be inert magnetically, when compared to the other Co sites with higher charge state on which holes delocalize (formally Co4+ should have ). However the actual Na atomic order, the organization of the Co sites and their electronic properties has not been so far determined experimentally, except for the case of where such a large charge differentiation does not occur.Bobroff et al. (2006); Ning et al. (2008) This did not therefore permit yet any theoretical calculations, even in the LDA approximation, based on an actual structure.
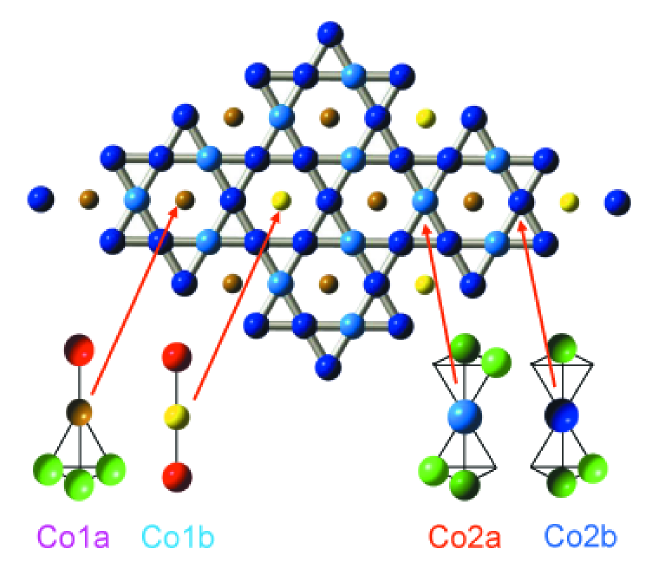
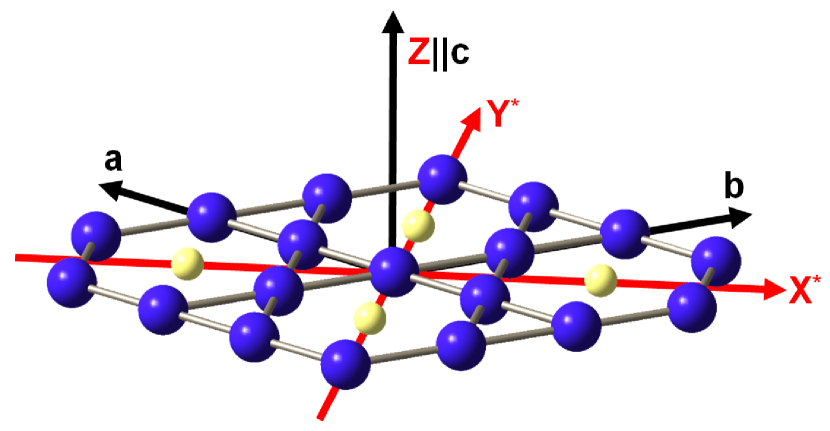
We have however established for long that one specific structure of NaxCoO2 was quite stable for and we could ascertain recently that it corresponds to a atomic structure which could be determined by combining NMR and NQR experiments.Alloul et al. (2009) The Na organization in this structure, which agrees with GGA calculations,Hinuma et al. (2008) consists of two Na on top of Co sites (the Na1 sites) and six on top of Co triangles (the Na2 sites). This twelve Co unit cell and the stacking between planes has been confirmed by x-ray diffraction experiments.Platova et al. (2009) It results in a differentiation of four cobalt sites in the structure, two nearly non-magnetic Co3+ and two more magnetic sites constituting a kagomé sublattice of the triangular Co lattice on which the holes are delocalized (see Fig. 1).
Let us point out that a conflicting suggestion concerning the structure of this phase has been proposed in Ref. Shu et al., 2010. In Appendix A we demonstrate that our data are quite incompatible with this alternative structure, and that nothing allows so far to establish the occurrence of oxygen vacancies in our samples.
In the present paper we shall present a further important experimental step which consists in the determination of a full set of 59Co NMR data which, together with NQR data, allow us to unravel the electronic properties of the four considered Co sites. We confirm that the electronic structure resumes in two type of Co sites, the non-magnetic Co1 sites with charge state 3+ and the Co2 sites on which holes delocalize. The magnetic properties sensed by all four sites have a single dependent behaviour which confirm a single band picture suggested initially.Mukhamedshin et al. (2005) We evidence unexpected large anisotropies of the magnetic NMR shift and spin lattice relaxation of the Co2 sites, which have direct implications on the electronic structure of the CoO2 plane. These results should trigger realistic calculations to explain the correlated electronic structure of these compounds and their evolution with hole doping.
The paper is organized as follows. Sections II-V contain all experimental aspects of the paper, while in Sec. VI we collected and discussed all the results which are relevant for further theoretical considerations.
In Sec. II we recall briefly the methods used to synthesize single phase samples for and to orient the samples in an applied field. More details on the NMR tests of the quality of the sample alignment are given in Appendix B. In Sec. III we recall some basics of the NMR spectroscopy of nuclear spins in presence of electric field gradients (EFG) which induce quadrupole effects. We report then the 59Co NMR spectra detected in NaxCoO2 samples when the field is applied in both directions and , and the experimental procedures used to separate the contributions of the different sites to the NMR spectrum. We describe then the simulations of the NMR spectra which allowed us to evidence the large in plane anisotropy of the NMR shift of the magnetic sites.
In Sec. IV we present the dependencies of the NMR shifts of all Co sites in the structure and compare them to that observed on the Na NMR (technical details are reported in Appendix C). This allowed us to separate the dependent spin contribution to the NMR shifts from a independent term that we assign to an orbital contribution. We evidence that both terms are non-axial on the Co2 sites.
In Sec. V the technical aspects of the measurements of the 59Co NMR spin lattice relaxation are presented and the data obtained on the two types of cobalt sites are analyzed by comparing the Co data to that taken formerly on 23Na. This permits us as well to separate the spin and orbital contributions to . The anisotropies of the data for the spin contributions can be explained by those obtained for the hyperfine coupling. These results allow us as well to demonstrate that the spin and orbital contributions to are at least an order of magnitude larger for Co2 than for Co1 sites.
In Sec. VI we then discuss the ensemble of results on the EFG, the NMR shifts and data. While so far the qualitative aspects of the data had lead us to consider that the Co1 sites were Co3+, the measured parameters allow us to get a little bit further and to obtain an upper limit on the charge occupancy of the Co1 sites. More importantly this allows us to consider the origin of the anisotropy on the Co2 sites and to conclude that it results from the distribution of holes between the axial orbitals and the in plane orbitals on the Co2 site.
II Sample preparation and experimental techniques
Experiments on sodium cobaltates NaxCoO2 have been performed on both powders or single crystals. Usually, NMR experiments, which provide information on the bulk of the samples are expected to bring more information on single crystals than in powder samples. However this has not be proven to be the case so far.Ning et al. (2004); Julien et al. (2008) Indeed, we have shown that homogeneous single phase powder samples can be synthesized and can be well controlled by x-rays and NMR.Alloul et al. (2008) Also the penetration of rf magnetic field into conducting cobaltates single crystals is limited by the skin effect. Thus for our study we used powder samples. However, as they consist of particles oriented randomly, the resulting angular distribution of quadrupole splittings introduces as well some difficulties in the analysis of the NMR spectra.
II.1 Samples preparation
The methods which have been used to synthesize reproducibly single-phase powder samples with sodium content x=0.67 have been reported in Ref. Platova et al., 2009. As described there, we used three different routes to synthesize homogeneous single phase samples of Na2/3CoO2 compounds:
(1) direct synthesis from a stoichiometric composition of Co3O4 and Na2CO3.
(2) from a mixture of cobaltates with calibrated compositions synthesized previously (such as Na1/2CoO2 and Na0.71CoO2 Alloul et al. (2008)) taken in a proper ratio.
(3) by de-intercalation of Na from Na0.71CoO2 by annealing it at 700∘C - out of its own stability temperature range.
Whatever the synthesis procedure used, the X-ray spectra of these Na2/3CoO2 samples displayed the same axis parameter and diffraction spectra, including the satellite Bragg peaks due to Na order.Platova et al. (2009) However we noticed an important difference between these materials regarding the possibility to orient them in a magnetic field.
II.2 Powder sample alignment
As the room susceptibility of sodium cobaltates is known to be anisotropic,Wang et al. (2003) we have used this anisotropy to align the single crystallites of powder samples in a 7 T field, by mixing the samples with Stycast 1266 epoxy resin which cured in the field. Thus in our samples crystallites axes were aligned in the same direction, but planes of different crystallites are randomly distributed.Egorov et al. (1990) To be successful, this procedure requires a powder in which individual grains should be single crystallites and should not form clusters. Also the shape and packing of the grains should not prevent them rotating freely in the magnetic field.
The best aligned samples were obtained from powders which were directly synthesized along route (1) with grain sizes of 50-100 microns, but a residual unreacted Co3O4 could not be avoided in many cases and the corresponding 59Co NMR signal of Co3O4 could be seen in the spectra. The powders obtained along route (3) also usually align well in the magnetic field. Those synthesized along route (2) were most difficult and sometimes impossible to align. In such a synthesis the small grains are probably randomly welded to each other, so that the final powder does not consist of single crystallites.
For a perfect alignment the samples should look like a single crystal in the direction but with full plane disorder. Details on the NMR tests of the quality of the sample alignment are given in Appendix B.
Here we should mention that the Stycast perfectly protects the powder from environment (water) influence.Platova et al. (2010) For this Na concentration the samples prepared 6 years ago did not show any changes in the NMR spectra.
III 59Co NMR spectra in the Na2/3CoO2
III.1 NMR Background
Generally in solid state NMR an atomic nucleus with spin and quadrupole moment has its spin energy levels determined by the Zeeman interaction with a external magnetic field and the quadrupolar interaction with the electric field gradient (EFG) on the nucleus site. Therefore the Hamiltonian consists of two parts - Zeeman Hamiltonian and quadrupolar Hamiltonian , and can be writtenAbragam (1961); Slichter (1990):
| (1) |
where is gyromagnetic ratio.
The physical properties of the studied compound are hidden in the two tensors in this Hamiltonian - magnetic shift tensor and the EFG tensor . The principal axes of both tensors are associated with the local structure and assuming that the principal axes (X,Y,Z) of both tensors coincide, the Zeeman and quadrupolar Hamiltonians can be re-written:
| (2) | |||
where , and the three quadrupolar frequencies
are linked by Laplace equation . Therefore it is more common to use two parameters - the quadrupolar frequency corresponding to the largest principal axis component of the EFG tensor and the asymmetry parameter (here the principal axes of the EFG tensor are chosen following ).
The nuclear spin of 59Co is and therefore for a given direction of applied magnetic field relative to the crystallite the NMR spectrum for a single Co site consists of 7 lines - a central line which corresponds to the transition and 6 satellites corresponding to the other transitions. The position of the central line is determined by the applied field and the values of the magnetic shift and second order quadrupolar perturbation.Abragam (1961) The distance between the two satellite lines and depends on the orientation of the external field with respect to the principal axis of EFG tensor described by the spherical angular coordinates and and can be expressed as:Abragam (1961)
| (3) |
III.2 Experimental techniques
The NMR measurements were done using a home-built coherent pulsed NMR spectrometer. NMR spectra were taken “point by point ”with a radio frequency (rf) pulse sequence by varying the magnetic field in equal steps. The minimum practical values used in our experiments was 7 . The usual pulse length was 2 .
Experimentally the value of the magnetic shift (in %) for a given point in the spectrum either in frequency domain or in the field domain can be calculated using:
| (4) |
where and are reference frequency and field values, respectively, which are connected by the relation . In this work 23Na shifts are given with respect to the 23Na resonance in a NaCl water solution. The reference for 59Co shift is given for the 10.054 MHz/T value.
III.3 Decomposition of the spectra in slow and fast relaxing components
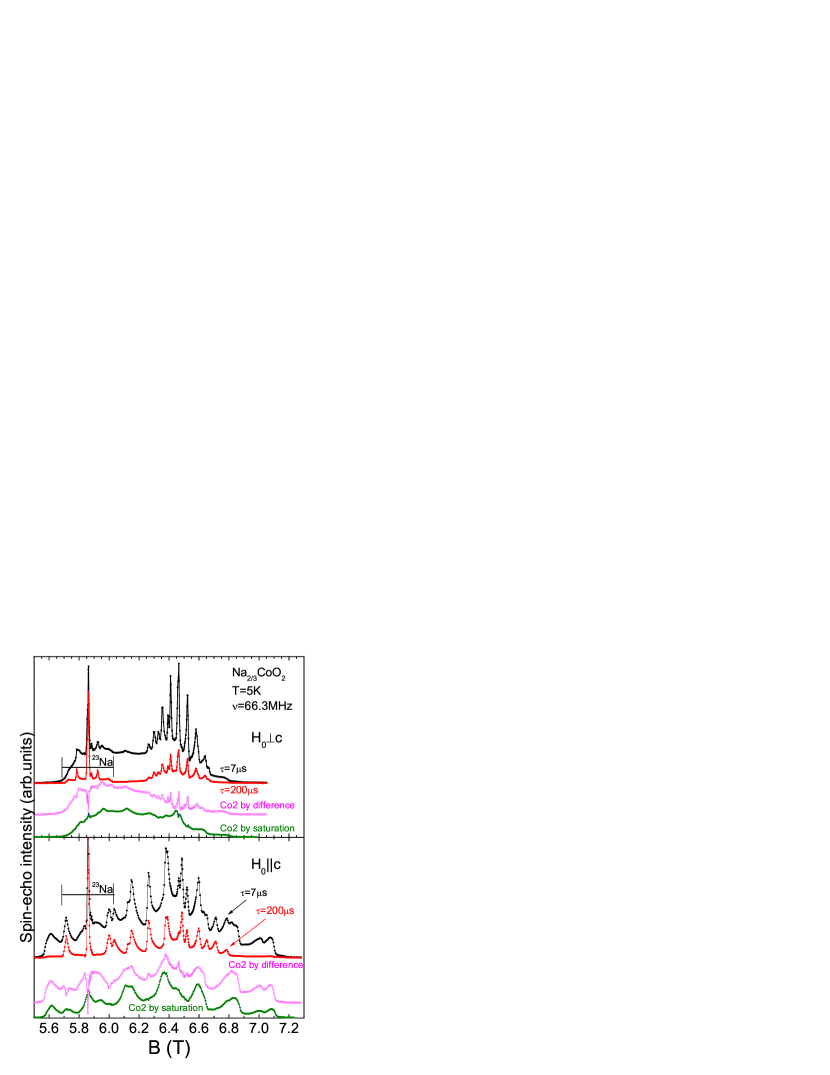
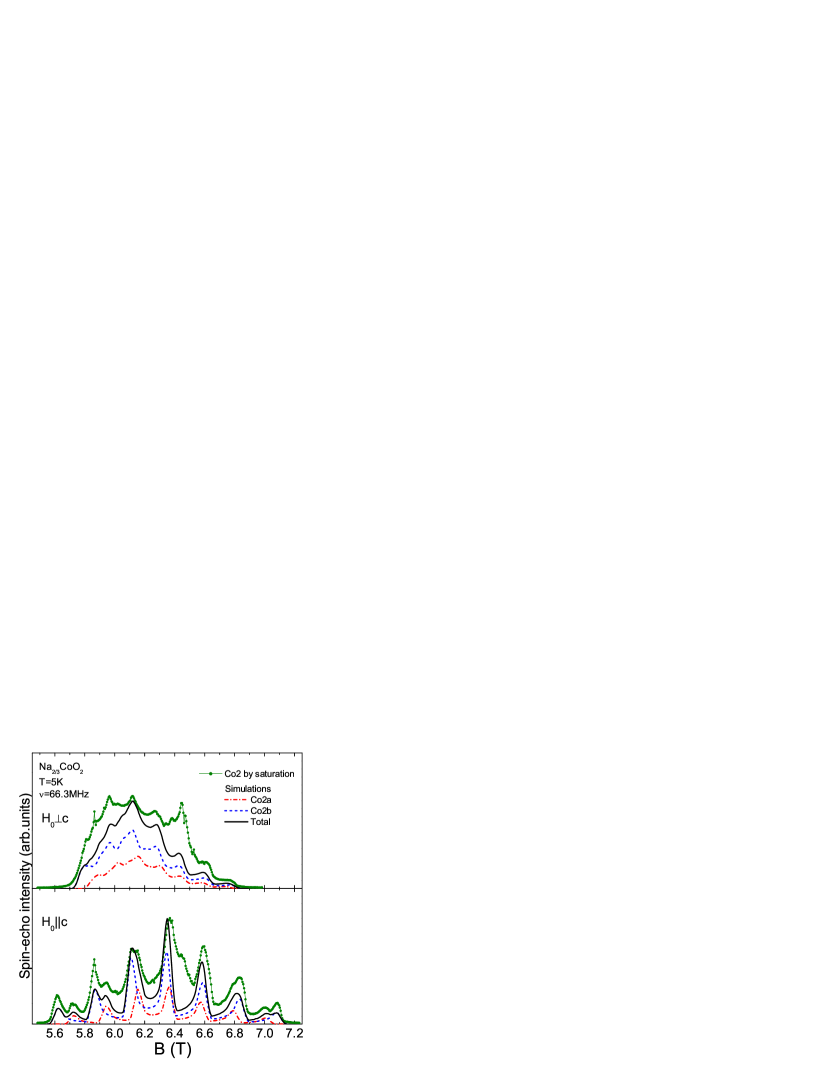
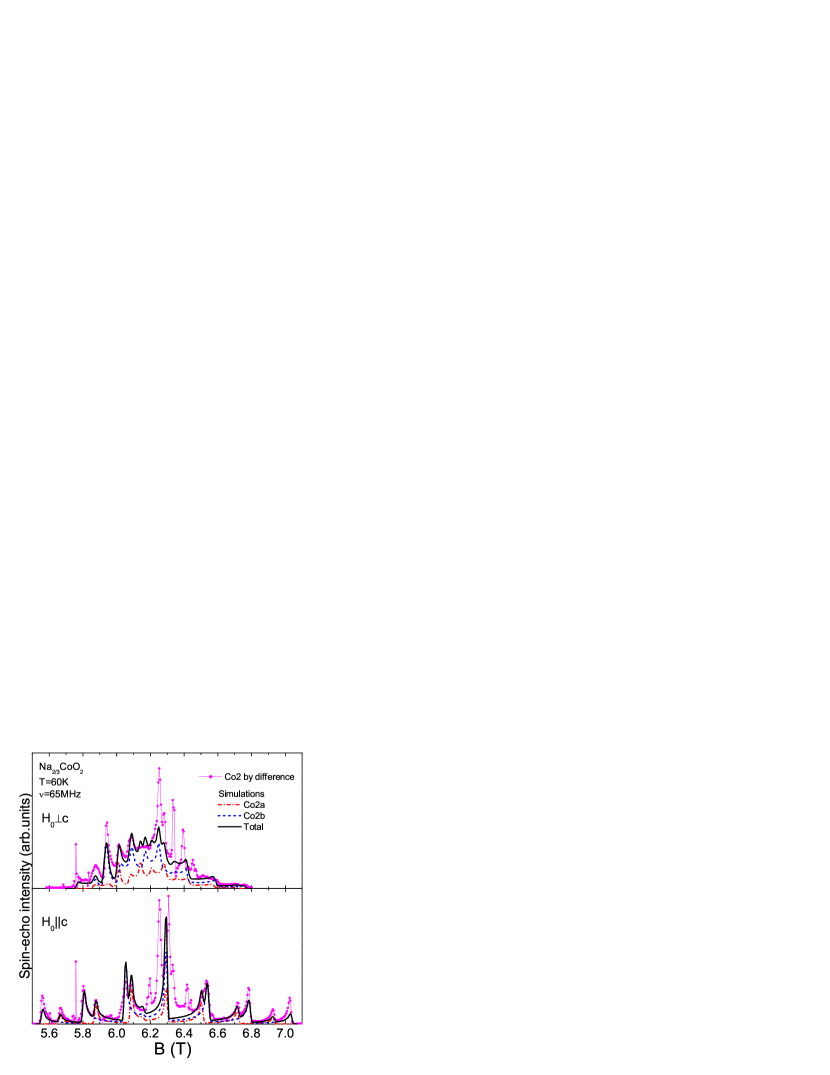
The raw 59Co NMR spectra in the Na2/3CoO2 compound are complicated - as an example we show in Fig. 2 the NMR spectra measured in a well oriented sample at 5 K for two directions of the applied magnetic field . Former 59Co NMR data Mukhamedshin et al. (2005) taken on this phase have already allowed us to evidence distinct Co NMR lines, but those NMR spectra were somewhat difficult to analyze fully, as one needs to determine altogether the EFG parameters and NMR shifts of the various sites. The experiments were furthermore complicated by the need of a quasi perfect alignment of the powder sample with respect to the applied magnetic field.
We foundMukhamedshin et al. (2005); Platova et al. (2009) that some Co sites have both very short nuclear spin-spin () and spin-lattice () relaxation times - we denote them as Co2 type. The Co sites which have much longer relaxation times could be also isolated - we call these cobalts as Co1 type.
In Fig. 2 we show a decomposition of the experimental spectra in the Co1 and Co2 contributions. The spectrum measured with between rf pulses contains contributions of the NMR signals of both type (Co1+Co2) of 59Co nuclei in the sample, whereas for the only remaining contribution to the signal is that from the slow relaxing 59Co1 nuclei. One can then obtain the spectrum of the fast-relaxing part Co2 - by subtracting the rescaled slow-relaxing part of the spectra from the short- spectra. The rescaling can be done empirically by trial and error, or using an estimation of the decay for the slow relaxing spectrum. In the Fig. 2 the spectrum obtained so for the fast-relaxing part Co2 is shown as ”Co2 by difference”.
Slow and fast-relaxing cobalts can be separated as well by the large difference in their spin-lattice relaxation times.Platova et al. (2009) It is possible to suppress (or more correctly, to saturate) the signals of 23Na and slow-relaxing Co1 type sites by using an additional pulse with some delay (usually 400-1000 ) before the pulse sequence. In the spectrum obtained after such a pulse sequence the intensities of the slow-relaxing cobalt lines is reduced and the lines of the fast-relaxing cobalts are better resolved. Spectra of Co2 obtained by this method are shown in Fig. 2 as ”Co2 by saturation”.
The shapes of the fast-relaxing Co2 NMR spectra obtained by the two methods are not exactly the same as one can see in the Fig. 2. The compliance between the two methods is much better when the external magnetic field is applied parallel to the axis of the sample. The main reason for the discrepancy is that the nuclear relaxation rates differ in the different parts of the NMR spectra. Therefore it is not so easy to subtract fully or to suppress fully the Co1 spectra, so that some remanent of the intense Co1 lines remains in the ”Co2 by difference” spectra. Also the overlap with the 23Na NMR signal creates additional difficulties - one can see the residual traces of the sodium signal in the obtained Co2 spectra.
III.4 Slow relaxing Co1 NMR spectra
Figures 3 and 4 show spectra of the slow relaxing Co1 at two temperatures, 5 K and 60 K, respectively. These experimental spectra are quite simple as in both directions of applied magnetic field and they are nearly symmetric with respect to the center of the spectra. The largest splitting between satellites for slow relaxing Co1 is observed when the applied magnetic field is parallel to the axis of the sample. This fact demonstrates that the main principal axis of the EFG tensor for Co1 in the Na2/3CoO2 compound is parallel to the crystallographic axis. The fact that the distance between outer singularities in both directions and scales as 1:2 shows that these cobalt sites have an axial EFG tensor with asymmetry parameter close to zero (see Eq. 3).
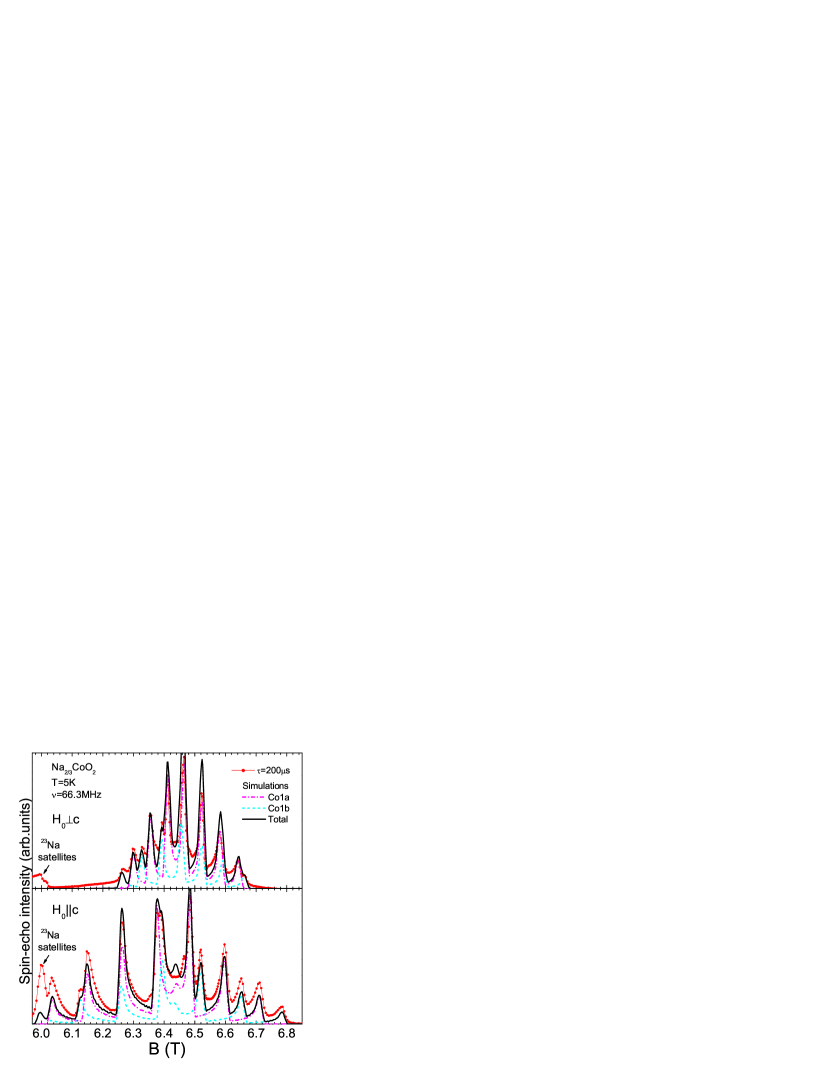
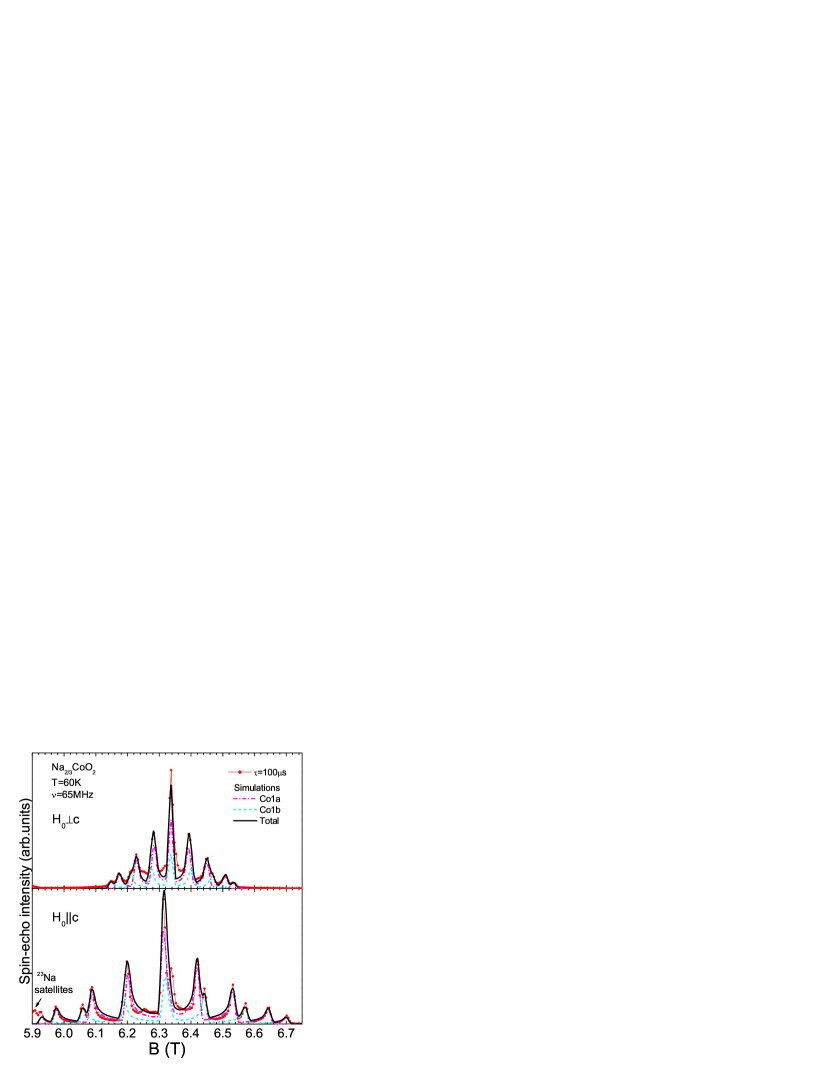
The 59Co NMR spectra of the slow relaxing Co1 can be described by only 2 unequivalent cobalt sites which we assign to the Co1a and Co1b sites of Fig. 1. In figures 3 and 4 we show computer simulations of the 59Co NMR spectra that we could perform. As one can see the agreement between the simulated spectra and the data is very good. These simulations of the NMR spectra allow us to deduce , and the magnetic shift of the central line for the two Co1 sites, which are summarized in the Table 1.
These results are in good agreement with the parameters deduced from 59Co NQR spectra which also display two slow relaxing sites.Platova et al. (2009) Moreover, the simulation of the 59Co NMR spectra also confirm the ratio 2:1 between the lines intensities corresponding to the Co1a and Co1b sites as can be seen in Fig. 3 and 4.
III.5 Details of the simulations of the NMR spectra
The simulation procedure used to reproduce the powder NMR spectra requires an averaging of computed signals for all possible orientations of the powder particles. In our samples the axes of the crystallites are aligned but the or axes are at random. To simulate a possible imperfect alignment of the powder particles, we introduced in our simulation a distribution of crystallite axes orientations which we described by a Lorentzian function. For well oriented samples (like in Fig. 2) the deviation of axis orientations was within . Such an angular distribution described very well the 23Na NMR spectra (see Appendix B) and has been used then in the simulations taken for all cobalt sites in a given sample (see figures 3-6).
Simulations of the spectra were done taking into account not only the splittings of the energy levels described by the Hamiltonian of Eq. 2 but also the transition probabilities due to the radio frequency field excitation using the algorithm described in Ref. Egorov et al., 2003. Also to simulate the broadening of the NMR lines we used a triangular filtering function with bandwidth 0.15 MHz for both Co1 and Co2 sites at =60 K. At =5 K the larger broadening of the Co2 site spectrum required an increase of this bandwidth to 0.5 MHz, while 0.15 MHz could be kept for the Co1 sites.
| Co1a | Co1b | Co2a | Co2b | ||
| 1.93 | 2.08 | 9.52 | 10.4 | ||
| 1.93 | 2.08 | 4.36 | 4.76 | ||
| NMR | 3.48 | 3.20 | 3.54 | 3.80 | |
| 111Since in the NMR the sign of the EFG cannot be determined, the sign of values of could be reversed. | 1.19 | 1.386 | 2.276 | 2.591 | |
| 5 K | 0 | 0 | 0.362 | 0.358 | |
| 111Since in the NMR the sign of the EFG cannot be determined, the sign of values of could be reversed. | -0.595 | -0.693 | -0.73 | -0.83 | |
| 111Since in the NMR the sign of the EFG cannot be determined, the sign of values of could be reversed. | -0.595 | -0.693 | -1.55 | -1.76 | |
| 1.98 | 1.98 | 5.19 | 6.0 | ||
| NMR | 1.98 | 1.98 | 2.80 | 3.31 | |
| 2.67 | 2.72 | 2.67 | 3.72 | ||
| 60 K | 111Since in the NMR the sign of the EFG cannot be determined, the sign of values of could be reversed. | 1.165 | 1.340 | 2.19 | 2.55 |
| 0 | 0 | 0.362 | 0.358 | ||
| NQR | Platova et al. (2009) | 1.193(1) | 1.392(1) | 2.187(1) | 2.541(1) |
| 4.2 K | Platova et al. (2009) | 0.017 | 0.016 | 0.362(5) | 0.358(4) |
III.6 Fast relaxing Co2 NMR spectra
Figures 5 and 6 show the spectra of the fast relaxing Co2 at two temperatures, 5 K and 60 K, respectively. Despite the difficulties in obtaining fast relaxing Co2 NMR spectra, some facts can be settled. First of all the largest splitting between satellites for Co2 is observed for . Therefore for Co2 the main principal axis of the EFG tensor is parallel to the crystallographic axis in the Na2/3CoO2 compound.
The Co2 spectrum for at 60 K (see Fig. 6) is quite simple, well resolved and clearly evidences two inequivalent Co2 sites with different values of quadrupole frequency - we denote these sites as Co2a and Co2b. The relative intensities of the NMR signals of these sites corresponds to a ratio Co2a:Co2b close to 1:2. These facts are in very good agreement with the 59Co NQR spectra which also display two fast relaxing sites with a similar intensity ratio.Platova et al. (2009)
At low temperature 5 K the Co2 spectrum in the case (see Fig. 5) is less resolved due to the large magnetic broadening of the lines, but the satellites of the two sites could still be seen.
If we compare now the Co1 and Co2 NMR spectra measured in the it is easy to see that Co2 spectra are asymmetric with a larger intensity in the lower fields. At =60 K some lines are resolved with clear singularities but at 5 K it becomes nearly impossible to resolve the different lines and we could only detect very weak singularities. As the orientation procedure of our samples is such that the planes of different crystallites are randomly distributed then the experimental spectra in the direction are powder spectra. This explains why they are less resolved than the spectra. However some singularities could still be perceived even in the broadened spectrum at 5 K (Fig. 5). Such a complexity is apparent as well in the data taken by many others groups in sodium cobaltates with sodium content .Ihara et al. (2004); Gavilano et al. (2006) Comparing our oriented powder NMR spectra with NMR data taken on single crystals Ning et al. (2004); Julien et al. (2008) allows us to conclude that twinning of the plane is quite common in those single crystals.
Therefore the analysis of a single spectrum of Co2 appears quite difficult. Independently of the method used to isolate the fast relaxing Co2 spectra we do however find that the positions of the different singularities in the Co2 spectra are the same as one can see in Fig. 2. As usual such singularities in a powder NMR spectrum appear at positions where the two principal axes and of the EFG and magnetic shift tensor in the plane correspond to extremal positions of the NMR signal for randomly distributed crystallites. Furthermore, as was shown in Ref. Mukhamedshin et al., 2005 the sodium and cobalt sites in the Na2/3CoO2 compound feels a common dependence of the spin susceptibility, which we could determine directly by measuring the 23Na magnetic shift .Mukhamedshin et al. (2004) We did then study the evolution of the positions of the singularities in the Co2 spectrum versus temperature. By plotting these singularities versus the spin susceptibility as monitored by , the temperature being then an implicit parameter, we could sort out those singularities which correspond to Co2 central lines and those which can be assigned to quadrupolar satellites, as detailed in Appendix C.
This allowed us to resolve then fully the EFG and shift tensors of Co2a and Co2b sites and to understand that not only the EFG tensor but also the shift tensors are highly asymmetric. We could then succeed to perform a full simulation of the 59Co NMR spectra of the fast relaxing cobalts in the two field directions, as shown in figures 5 and 6, with the parameters collected in the Table 1. There we also reported the parameters measured for the Co1a and Co1b sites, as obtained from the simulations done in Fig. 3 and Fig. 4. As one can see the obtained values of the quadrupole frequency and of the asymmetry parameter for all sites are in good agreement with the values obtained by NQR.Platova et al. (2009)
IV dependence of the cobalt magnetic shifts
The principal components of the magnetic shift tensor for the cobalt site in a direction consist on three parts
| (5) |
Here is the chemical shift due to the diamagnetic susceptibility of the inner shell electrons, reflects the on site orbital effect of the valence electrons, proportional to the orbital part of the electronic susceptibility which is usually temperature independent. The last term, the spin shift , is proportional to the local electronic spin susceptibility .
The remarkable feature of the Na2/3CoO2 phase of the sodium cobaltates is the large low variation of this last term, which, as already pointed out above, allowed us to resolve the Co NMR spectra.Alloul et al. (2008) The 23Na NMR has negligible chemical and orbital NMR shifts and is largely dominated by the dependent spin term which has been found nearly isotropic.Mukhamedshin et al. (2004) So the comparison of with the isotropic contribution also allowed us to separate the orbital and spin contributions to the cobalt magnetic shift, as detailed below.
IV.1 Co1 shifts
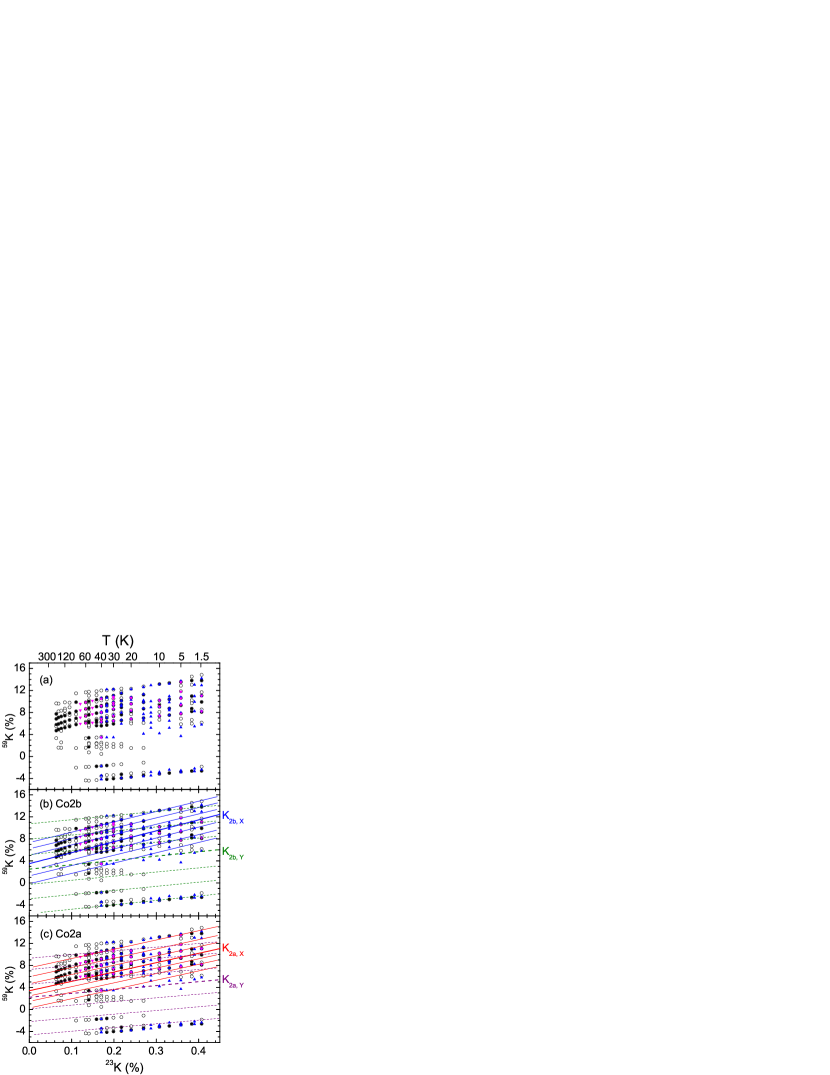
In Fig. 7a we show the dependence of the magnetic shifts of Co1a and Co1b sites which are plotted in Fig. 7b versus the NMR shift of 23Na. For Co1a and Co1b sites the -components of the magnetic shift are quite similar, with a substantial dependence which is proportional to at temperatures below 150 K.
The in-plane and components of the shift are indistinguishable for Co1a and Co1b sites, and their shift value does not change from 150 K down to 40 K. Below this temperature some small difference in the in-plane shifts for Co1a and Co1b sites appears. This was also seen by others, Gavilano et al. (2006) which points out that this effect is somewhat characteristic of this phase of Na cobaltates. But as one can see in Fig. 7, these distinct variations of NMR shifts of Co1a and Co1b are quite small when compared with the variations of the NMR shifts of both Co1 sites for . So we can consider so far that the in plane shift of the Co1 sites is practically independent below 150 K.
Using Fig. 7b one can get the slopes of the linear fits of versus which give the relative magnitudes of the spin contributions , while the =0 intercepts give the estimates of the independent contribution to the 59Co NMR shift. The values found here, reported in Table 2, are much larger than those expected for the chemical shift . They are obviously dominated here by the Co orbital NMR shift , so that we have neglected in all our analyzes.
But, as seen in Fig. 7, significant increases of with respect to the low linear dependence are observed for K, that is for . Those increases are associated with the onset of Na motion which has been detected at 200 K from 23Na data in Ref. Alloul et al., 2008. There we have discussed that this Na motion induces a significant Co1-Co2 site exchange which induces such an increase of Co1 NMR shifts, while the charge disproportionation already occurs above room temperature.
IV.2 Co2 shifts
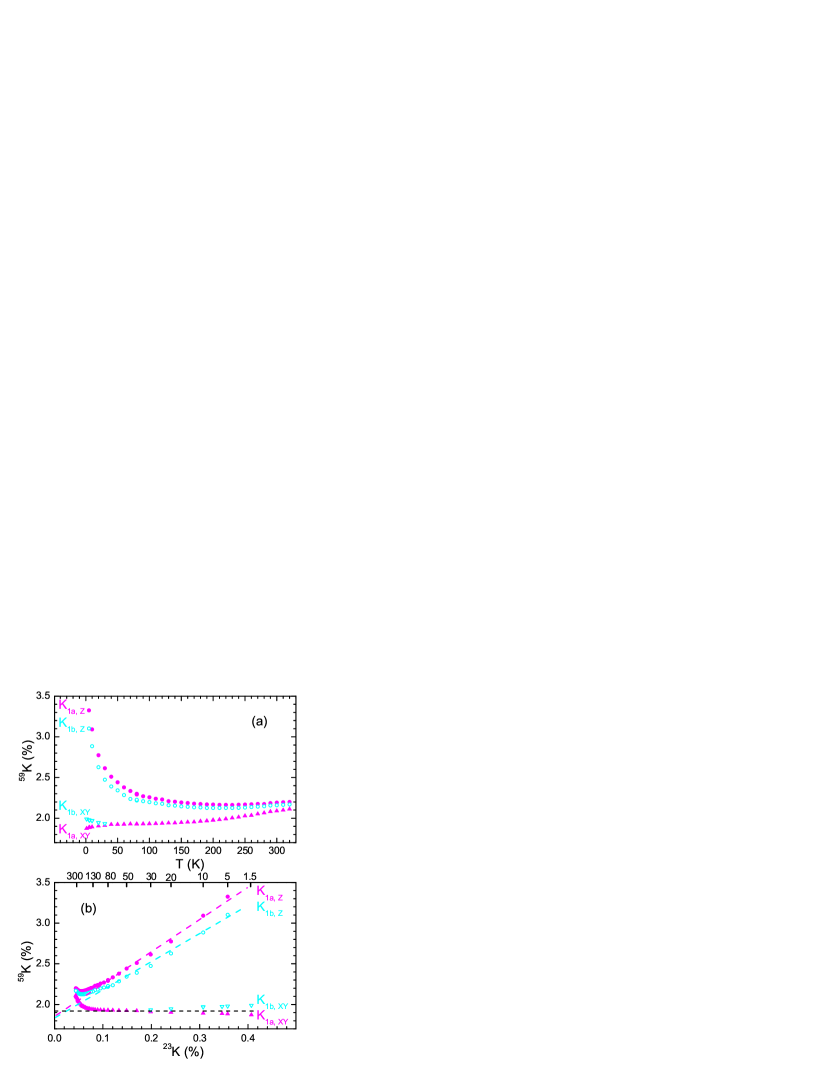
In Fig. 8a we show the dependencies of the magnetic shifts of Co2a and Co2b sites and in Fig. 8b they are shown versus . In this figure we put some experimental points which were determined accurately at specific temperatures, but due to the relatively small number of Co2a sites the intensity of its NMR signal is weak. For this site we plot lines corresponding to the and components of its shift obtained from the analysis detailed in Appendix B.
As one can see in Fig. 8b a linear dependence is found for all components of the magnetic shift for both Co2a and Co2b sites below 120 K in a range where no sign of Na motion could be seen. So this figure in combination with Fig. 7b confirm that all 4 cobalt sites pertain indeed to a unique sodium cobaltate phase in which a single variation characterizes the local . We collected in Table 2 the relative magnitude of the spin contributions and for all three components of the magnetic shift for the Co2a and Co2b sites together with those of the Co1 sites.
While the magnetic shift tensors are axial for the Co1a and Co1b sites, we see in Table 2 that both Co2a and Co2b sites demonstrate strong in-plane anisotropy of both the orbital shift and the spin hyperfine coupling. This totally unexpected anisotropy is a quite important observation achieved in the present investigation. In our previous paper concerning the 59Co NMR in this phase Mukhamedshin et al. (2005) as well as in all the existing publications Ihara et al. (2004); Gavilano et al. (2006); Julien et al. (2008); Ning et al. (2004) such anisotropy was not anticipated. This had consequently led us to invoke a third group of axial cobalt sites Co3 with large shift values. In appendix B we detail why imperfect alignment of the sample powder had led us as well to overlook initially this anisotropy.

| Site | Co1a | Co1b | Co2a | Co2b |
|---|---|---|---|---|
| -0.2(2) | 0.2(2) | 17.9(4) | 19.9(4) | |
| -0.2(2) | 0.2(2) | 7.1(3) | 7.9(3) | |
| 4.0(2) | 3.5(2) | 4.6(2) | 5.2(2) | |
| (%) | 1.92(2) | 1.92(2) | 3.1(2) | 3.3(2) |
| (%) | 1.92(2) | 1.92(2) | 2.1(2) | 2.3(2) |
| (%) | 1.86(5) | 1.86(5) | 1.92(5) | 1.95(4) |
V 59Co spin lattice relaxation
When thermal equilibrium of the nuclear spins is disturbed by rf pulses, the equilibrium nuclear magnetization is recovered by various relaxation processes which reflect the interactions in the spin system and the magnetic and electronic properties of the materials. The recovery of the nuclear magnetization along the applied field operates through nuclear spin lattice relaxation (NSLR) processes characterized by the spin-lattice relaxation time or by the nuclear spin-lattice relaxation rate .
In systems with unpaired spins the dominant process is due to local field fluctuations induced by the dynamics of the local electronic magnetization. Theoretically, the spin contributions to may be written using the imaginary part of the Co dynamical electron spin-susceptibility as
| (6) |
where is the wave-vector q dependent hyperfine form factor which depends on the hyperfine interaction between the observed Co nuclear and electron spins at the same site and the hyperfine interaction with electron spins at nearest neighbor Co sites .Moriya (1963)
Our measurements of the 23Na NSLR temperature dependence allowed us to establish that in sodium cobaltates with sodium content the dominant correlations in the electron spin system are ferromagnetic, while for lower sodium contents antiferromagnetic correlations take over.Alloul et al. (2008); Lang et al. (2008)
Equation 6 applied to different nuclei tells us that NSLR data should be similar for all nuclei in the absence of any cancelation at some specific vector due to the form factor associated with the geometrical position of the nuclear site with respect to the magnetic atoms. So the comparison of 59Co and 23Na NSLR could help us to better characterize the dynamic susceptibility. We report then here the results of a detailed study of the 59Co NSLR in this Na2/3CoO2 phase. First we demonstrate the consistency and validity of our measurements, and then compare the results for the different Co sites. We follow as well the procedure used for the shift measurements and compare directly the Co and Na data.
V.1 Experimental techniques
To study the nuclear spin-lattice relaxation process of the 59Co we have used the usual magnetization inversion recovery method with three pulses: . In this sequence the first pulse rotates the magnetization by 180o and the longitudinal magnetization recovered after time is measured with a spin echo sequence with interval . The dependence of the spin-echo intensity on delay time allows to monitor the recovery of the nuclear magnetization associated with a given NMR transition:
| (7) |
Here is the thermal equilibrium value of magnetization and the parameter characterizes the actual magnetization after the first pulse at (the imperfection of the experimental conditions gave typical values 1.8 rather than expected for a perfect pulse).
The shape of the relaxation function depends on the nuclear transition sampled. For a two-level nuclear system (like the NQR case) this process is exponential and allows a simple experimental determination of .Slichter (1990) But generally for the nuclear energy levels are differentiated by the quadrupole interaction with the crystalline electric field (Eq. 1). For very broad NMR spectra as those considered here, the applied first pulse only inverts the populations of some levels which, for a given frequency, can be selected by properly choosing the applied field. Consequently the difference in population between adjacent levels which are probed by the rf pulses depends on the populations of the levels which are not hit by the rf pulses. Therefore the magnetization recovery becomes multi-exponential
| (8) |
but is still characterized by a single value.
The spin-lattice relaxation could be driven either by magnetic or quadrupolar fluctuations which correspond to distinct transition probabilities and values. However in the sodium cobaltates the magnetic relaxation mechanism dominates at least at low .Platova et al. (2009) Using Ref. Andrew and Tunstall, 1961; Mcdowell, 1995 we have calculated for our values of the and parameters for the theoretical relaxation functions for the case of magnetic relaxation by weak fluctuating magnetic fields for the different 59Co transitions - see Table 3.
| 28 | 21 | 15 | 10 | 6 | 3 | 1 | |
|---|---|---|---|---|---|---|---|
| Transition | |||||||
| 0.714 | 0 | 0.206 | 0 | 0.068 | 0 | 0.012 | |
| 0.457 | 0.371 | 0.001 | 0.117 | 0.030 | 0.012 | 0.012 | |
| 0.114 | 0.371 | 0.366 | 0.081 | 0.008 | 0.048 | 0.012 | |
| 0.009 | 0.068 | 0.206 | 0.325 | 0.273 | 0.107 | 0.012 |
V.2 59Co spin lattice relaxation results
We have already seen by NQR that data are identical for the Co1a and Co1b sites. They are identical as well for Co2a and Co2b sites but much shorter than on the Co1 sites, which allowed us to confirm that the Co2 sites were indeed the magnetic sites.Platova et al. (2009)
Due to the close values of the magnetic shift for all 4 cobalt sites in the direction (see Table 2), to avoid cross-relaxation between sites it is of course better to take data on quadrupolar satellite transitions of different sites which are quite separated in frequency (or field). So we have measured the spin-lattice relaxation curves on the outer satellites for the sites with larger signal intensity, that is Co1a for the slow relaxing sites and Co2b for the fast relaxing sites. In Fig. 9, we display such examples of experimental spin-lattice relaxation curves for Co1a and Co2b sites. One can see there that they can be fitted quite well by the function 8 with the coefficients from Table 3. It can also be seen in Figure 9a that the same value is deduced from the data for the and transitions for the Co1a nucleus, demonstrating convincingly that the data analysis is reliable and that the relaxation is indeed magnetic.
We could also evidence in Fig. 9b that the data depend of the orientation of the applied field for Co2, contrary to the isotropic results found for the Co1 sites in Fig. 9a.
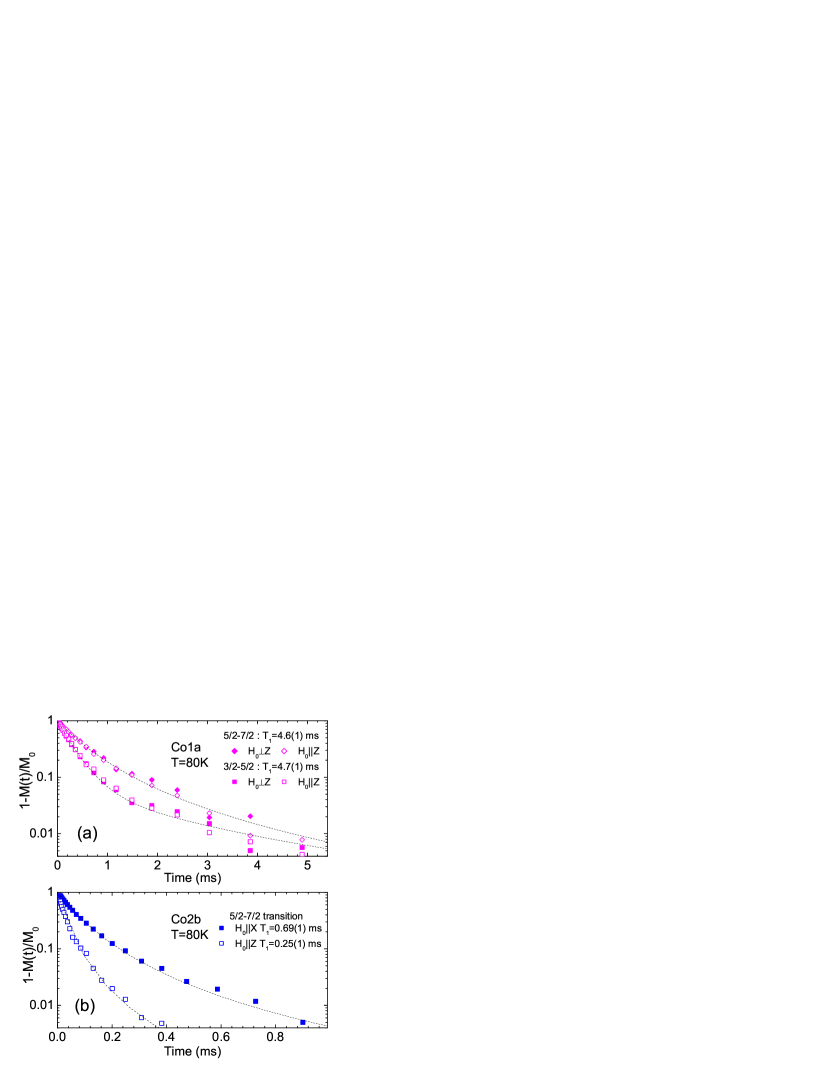
Similarly, in Fig. 10a we plotted then the variation of the Co2b data measured in two distinct applied fields, showing that values measured are identical, which confirms the reliability of the measurements, in view of the large spectral changes which occur with increasing field. We also compare there the data taken on Co1a with those on Co2b. The T1 values differ by a factor as large as 20 which confirms the strong differentiation already found in previous observations done by NQR at low .Platova et al. (2009)

Generally, as given in Eq. 6 the electron spin contribution to the spin-lattice relaxation rate is governed by the fluctuations of the transverse components of the effective magnetic field induced at the nucleus by the electronic magnetization. In NMR the quantization axis is given by the external magnetic field and for the 59Co the dominant term is the fluctuating hyperfine field whose magnitude is proportional to the hyperfine field and local spin susceptibility . The NMR shift and data taken on 23Na have given evidence that these electronic susceptibilities are nearly isotropic,Mukhamedshin et al. (2004); Alloul et al. (2008) so the spin contributions to on all nuclei are expected to scale with each other and the anisotropies should be governed by those of the hyperfine couplings . For instance
Therefore as the spin component of the magnetic shift for Co2 is much larger than that for Co1 (see Table 2) it is quite natural to find much shorter values for Co2 than for Co1. Also, as the components of the magnetic shift tensors for Co2 sites are highly anisotropic, with a dominant value for , the transverse fluctuating local fields are expected much larger for than for in qualitative agreement with the anisotropy of the data displayed in Fig. 9b.
However, for Co1 a distinct situation occurs. As one can see in Fig. 9a for Co1a the spin-lattice relaxation is isotropic while the spin component to the shift is strongly anisotropic - is much larger than the in plane components which are vanishingly small - see Fig. 7 and Table 2.
To explain that, we are lead to consider whether the spin components of the electronic dynamic susceptibility do dominate the relaxation, or is there another independent contribution to , such as for instance an orbital contribution to the spin lattice relaxation? Indeed, usually for transition metals two additive contributions to are expected
| (9) |
So we tried to separate such components similarly to what we had done before for the cobalt shifts - see Section IV. Indeed, as was shown in Ref. Alloul et al., 2008 in the Na2/3CoO2 compound the 23Na spin-lattice relaxation is largely dominated by the dependent spin term while any orbital contribution is negligible on that nuclear site. So we can plot the values of of 59Co versus values of 23Na, as done in Fig. 10b. Good linear relations are found for both sites, that is
for Co1a and
for Co2b. This analysis allows indeed to separate in the data the spin part from an orbital = constant part.Obata (1963) Let us notice that the ratio of the spin contributions for Co2 and Co1 is about . Such a large ratio compatible with that obtained by NQRPlatova et al. (2009) is quite expected as the spin part of the Co1 shift in the and directions is practically zero - see Table 2.
As for the orbital contribution, one can see in Fig. 10 that it is small with respect to the spin contribution for the Co2 site while it becomes dominant for the Co1 site. For instance at =80 K the is totally dominated by the orbital term for the Co1 site, which perfectly justifies the absence of detected anisotropy on the Co1 site at this temperature. Let us point out however that the orbital term is still one order of magnitude larger for Co2 than for Co1.
Overall these data are totally compatible with the anisotropy of the Co2 shifts reported in Sec. IV.2. We shall discuss further the implication of these results on the electronic properties of this Na2/3CoO2 phase in the following discussion section.
VI Discussion
We have reached now a rather complete experimental determination of the NMR parameters for the four Co sites formerly detected by NQR,Platova et al. (2009) which, together with the 23Na NMR spectra allowed us to determine the atomic structure of this Na2/3CoO2 phase.Alloul et al. (2009) The analysis of the NMR shifts and of the magnitude of the EFGs will allow us to confirm here the importance of cobalt charge disproportionation between the non-magnetic and magnetic sites, that is of the charge order induced in the structure. We shall discuss hereafter how this electronic kagomé differentiation is reflected on the orbitals involved at the Fermi level at the different sites of the Co plane. The anisotropy of the EFG and NMR spin shifts will be seen to be related with the hole orbital ordering which governs the electronic properties of this phase.
VI.1 Site differentiation
The data of Table 1 allowed us to evidence that for the Co1a and Co1b sites the symmetry of the magnetic shift tensor is axial (=), as found before for the EFG tensor ( or =). The local symmetry of these sites had been a key argument used to resolve the crystal structure.Alloul et al. (2009) We also fully confirm here that the electronic properties are quasi identical for Co1a and Co1b sites which are slow relaxing and weakly sensitive to the magnetism.
The knowledge of this actual atomic structure has allowed us also to resolve fully the difficulties connected with the imperfect alignment of the powder grains for some samples, which had initially lead us to conclude that the two other Co sites displayed quite distinct nearly axial NMR shifts.Mukhamedshin et al. (2005) The analysis of the extensive set of 59Co NMR spectra done for the two fast relaxing sites Co2a and Co2b allow us to establish that these sites have nearly identical spin shifts tensors which are unexpectedly totally non-axial, the larger NMR spin shifts being in a privileged direction in plane. The large anisotropy of the spin contribution to the data agrees perfectly with this NMR shift anisotropy, as is found shorter than .
We therefore established here that these fast relaxing Co2a and Co2b sites have similar anisotropic orbital and spin shifts and almost identical values,Alloul et al. (2009); Platova et al. (2009) confirming that they contribute identically to the electronic properties and are dominantly responsible for the magnetic properties of this compound.
This allows us then to conclude that although the local environment of Na+ charges shown in Fig. 1 are quite distinct for the two Co1 sites (or the two Co2 sites), the electronic and magnetic properties only marginally differ within each group of two sites. This establishes that, when dealing with the electronic properties, one might only consider a two site structure, with Co2 on a kagomé planar structure, and Co1 on the complementary triangular structure.
VI.2 Charge ordering
This differentiation of sites had clearly led us to suggest that the ionic characters of the Co1 and Co2 sites are not the same.Alloul et al. (2009) We have suggested for long that the Co1 sites had an isotropic NMR orbital shift which is a strong signature that the Co1 sites are themselves nearly Co3+, the orbital shift magnitude being furthermore nearly identical to that found in the band insulator phase Na1CoO2,Lang et al. (2005); de Vaulx et al. (2005) in which all Co sites are non-magnetic Co3+. More accurately, as we are dealing with a metallic system the filling of the bands involving the Co orbitals at the Fermi level is quite different on the Co1 and Co2 sites, and we can expect that the hole filling of the orbitals is small on the Co1 site. Let us assume that the hole content on Co2 sites is . As the number of holes per CoO2 formula unit is 1/3, the charge neutrality for the kagomé structure implies then , that is
VI.2.1 (a) Isotropic spin susceptibilities and data
The dependent NMR shifts of the Co sites, which scale with that of 23Na give a measure of the spin susceptibilities on the Co sites. If we consider in Table 2 the isotropic shifts on the Co sites, we immediately find that the average values for the two Co1 sites Co1 is an order of magnitude smaller than that for the Co2 sites Co2, which indicates that the unpaired spins are dominantly on the Co2 sites. Similarly, both from NMR and low NQR data we did find a ratio 70 between the spin contributions to for the two sites. Assuming similar hyperfine couplings for the two sites, one could anticipate from these results a ratio of of the local spin susceptibilities on the two sites, that is . This corresponds to an upper limit of 0.06 for epsilon.
VI.2.2 (b) Isotropic orbital susceptibilities and orbital contribution to
Let us consider the difference found for the orbital shifts between the Co1 and Co2 sites. While for Co1 sites was found isotropic already in Ref. Mukhamedshin et al., 2005, we do confirm here that is anisotropic in plane for the Co2 sites with a sizable increase of . We can therefore consider that the contribution of the hole orbitals to the orbital susceptibility is responsible for the deviation of with respect to 1.91(3)% found in Na1CoO2.Lang et al. (2005) In a rough order of magnitude comparison we might consider then that the hole density on the Co sites is proportional to , as we already suggested in Ref. Mukhamedshin et al., 2005. We do find then, from the results of Table 2 that Co, while Co. This would give again an upper estimate of . Similarly knowing Lang et al. (2005) that for Co3+ in insulating Na1CoO2 the spin lattice relaxation rate is very weak, one could anticipate that the metallic orbital contributions to would be linked to the hole doping on the corresponding site. So there is no surprise to find out that is much larger for Co2 than for Co1.
So the data lead us to consider that we may neglect as a first approximation and keep , although only accurate band calculations could tell exactly whether the partly filled bands at the Fermi level do not include any partial Co1 hole orbital in the kagomé structure.
VI.2.3 (c) EFG induced by charge order
Let us consider now the quadrupole frequencies , which are directly proportional to the EFG on the nuclear site probe. The latter arises from a non-symmetric distribution of electric charges around it. These charges can originate from non-bonding electrons, electrons in the bonds and charges of neighboring atoms or ions. The components of the EFG tensor can be written as the sum of two terms, the lattice and electron contributions:
| (10) |
where parameters and are the Sternheimer antishielding factors, which characterize the enhancement by the core electrons of the atom of the EFG on the bare nucleus with respect to the EFG due to the outer electron distributions.
The first contribution arises from all ion charges outside the ion under consideration and can be calculated in an approximation assuming point charges
| (11) |
where is the charge of ion , located at distance of the probe nucleus, in a direction at an angle from the Z axis of the EFG tensor.
The second term in Eq. 10 arises from unfilled electron shells of the orbitals of the considered site and of the distortions of the inner electron orbitals that they induce, embedded in the known value of (.
We have then to understand the relative weight of these two contributions in the measured EFG in this particular case of cobaltates. For a fully filled multiplet such as the Co3+ low spin state, the ionic structure is isotropic and the second term in Eq. 10 should contribute negligibly to the on site EFG.
Let us then point out that we can deduce significant indications about the respective weights of these two terms by considering the point charge calculations done in Ref. Platova et al., 2009. There we deduced average values for the Co1a and Co1b sites of MHz and a similar value MHz for the average of the Co2a and Co2b sites. Experimentally the corresponding respective values 1.29 MHz and 2.36 MHz differ significantly. This leads us to suggest then that the excess contribution of about 0.9 MHz on the Co2 sites is due to the on site hole orbitals. Furthermore, although we cannot rely fully on the numerical values of the point charge calculation, the agreement found with the Co1 data is indeed quite compatible with a negligible contribution of the on site orbitals on the Co1 sites, that is with a very small value.
To check the consistency of this analysis we may compare the data with that obtained for , for which we found that the Co sites are uniformly charged.Mukhamedshin et al. (2005) In that case, assuming a simple ordered distribution of Na2 sites and , the point charge calculations give values of 2.5 MHz for all Co sites, whatever their location with respect to the Na sites, while the NMR data of Ref. Mukhamedshin et al., 2005 corresponds to 4.1 MHz. So this much larger value would indicate that a 1.6 MHz on site contribution should be associated to hole per Co site. Such a contribution to of 2.4 MHz/hole would correspond to 1.1 MHz for 0.44 holes on the Co2 sites in the phase, remarkably close to the 0.9 MHz value estimated above.
So, although these point charge estimates are certainly not fully reliable, they indicate that the excess EFG found on the Co2 sites has the right order of magnitude and is compatible with the poor hole occupancy of the Co1 sites, as obtained here-above from the analyzes of and .
VI.3 In plane anisotropies and orbital order
The simple consideration of the atomic kagomé structure displayed in Fig. 11 allows one to expect an asymmetry of the local properties at the Co2 site, and to locate the two orthogonal axes () which should be the Co2 site in plane local principal axes.
Concerning the electronic structure, it is quite well known that the metallic bands of cobaltates are built from the Co orbitals which subdivide in the orbital which is axial and perpendicular to the plane and two subsets of in plane orbitals. From LDA calculations of the band structure, done so far for uniformly charged cobaltate planes (see for instance Ref. Pillay et al., 2008), one usually expected a Fermi surface containing an sheet at the Fermi level centered at the point and pockets at the zone corners.Singh (2000) Only the larger electron pocket has been observed so far by ARPES experiments, and that whatever the hole content.Yang et al. (2005); Nicolaou et al. (2010) It has often been considered that, even in such simple uniform representations of the CoO2 plane, the electronic correlations could largely influence the electronic structure by narrowing the bands and possibly pushing the hole orbitals below the Fermi level.Liebsch and Ishida (2008)
All that might not be relevant to the Na ordered and charge disproportionated structures, which would give a smaller Brillouin zone and a larger number of possible bands at the Fermi level. But surprisingly here we find no experimental sign for multiband behaviour. In any case the dominant magnetic Curie-Weiss behaviour is governed by a single band in which correlations are important. So far the nature of the Co orbitals which participate in this correlated electronic band are not readily available from the data. It remains then important to try to determine experimentally what are the respective weights of the and orbitals involved at the Fermi level in the actual electronic structure of the 2/3 phase.
We consider that the non axial NMR parameters determined here may help to answer this question. Assuming that Co1 is in a completely filled shell Co3+ ionic state (that is =0), if the electronic structure only results from hole orbitals on the Co2 sites, the non axial NMR parameters would only be induced by the absence of transfer integral between Co2 and Co1 sites. But if a fraction of the hole density on Co2 resides on orbitals, the local asymmetry of the transfer integrals would induce distinct occupancies of the two orbitals on the Co2 sites. One could expect a larger hole occupancy of the orbital pointing in the direction in Fig. 11, which would correspond to an ordering of the in plane hole orbitals on the Co2 sites. In any case such an unbalanced population of the orbitals would induce an on site anisotropy of the NMR parameters on Co2 sites. We shall here try to estimate the and hole populations by considering first the asymmetry of the EFG and then that of the NMR shifts.
VI.3.1 In plane EFG anisotropy on Co2 sites
Both asymmetries of the distributions of Na ions and Co charges located in the plane do introduce an in plane EFG asymmetry on the Co2 sites. We could evaluate the part of this asymmetry due to ionic charges from the point charge calculations of the first term of Eq. 10 done in Ref. Platova et al., 2009. We indeed found that the distribution of Na+ charges induces a slight tilt of the principal axis of the EFG with respect to the axis on both Co2 sites. The overall ionic charge distribution also results in and principal axes of the EFG which are distinct on the Co2a and Co2b sites and which were found markedly modified if we displace the Na atoms with respect to their ideal positions as suggested by the x-ray Rietveldt data analysis of Ref. Platova et al., 2009. However in all cases considered, the computed values of was found to correspond to a difference of NQR frequencies in a range between 0.4 and 0.9 MHz. This appears on the average significantly smaller than the 0.8 and 0.9 MHz values deduced from the experimental asymmetry parameter found for both Co2a and Co2b sites (see Table 1).
We may then suggest that some of the non axial charge distribution is linked with the on site term. As the orbital is axial, any on site non axial contribution to the EFG of the Co2 could only result from an unbalance in the populations of the orbitals.Lepetit ; Soret . The fact that the asymmetry parameter and EFG on the two Co2 sites are quite similar further supports the existence of a sizable on site hole orbital contribution to the EFG. Unfortunately the large sensitivity of the point charge calculations of the EFG to the actual atomic structure does not allow us to subtract reliably this EFG contribution from the experimental data, and to deduce then the principal axes and magnitude of the on site contribution to the EFG. It is clear then that more accurate EFG determinations based on ab initio band calculations are then needed to relate the EFG data to the relative populations of the and orbitals.
VI.3.2 In plane Knight shift anisotropies
While the anisotropy of Na charge distribution contributes to the EFG anisotropy, the Na ions are not involved directly in the magnetic properties, which are fully associated with the CoO2 layers. So, the anisotropies of the NMR shifts of the Co2 sites should give much better indications on the anisotropy of the in plane electronic structure. The non axial values of the Co2 shifts summarized in Table 2 are indeed pointing out the existence of an in plane electronic anisotropy. One can notice there that both and are much larger in the direction than in the direction. Let us note that these experimental directions are those identified from the EFG tensor, with the usual convention , so that the smallest quadrupole frequency occurs in the planar direction for which the NMR shifts are largest, as seen directly in the spectra. However so far we do not know for sure how relate to the axes defined in Fig. 11.
We did find as well an anisotropy of the spin contributions to which correlates with the anisotropy of hyperfine couplings, so that no really new information is embedded in this result, especially on the in plane anisotropy.
Orbital shift in plane anisotropy
SQUID data had allowed us to evidence that the macroscopic susceptibility is larger along the plane than in the direction. This data allowed us to establish that the dependence of the susceptibility, which is determined by the spin contribution is nearly isotropic, which has been confirmed as well from 23Na NMR data.Mukhamedshin et al. (2004) So the susceptibility anisotropy is dominated by that of and is sufficiently large to be practical to align the single crystal grains in the applied field at room temperature. But these SQUID data on powder crystallite samples do not give any indication about the in plane anisotropy of orbital susceptibility. The present NMR data in Table 2 establishes a planar anisotropy of on the Co2 sites, for which .
Let us point out that can be a purely ionic term, as is the case for Co3+, but states at the Fermi level might also give a specific contribution. This is indeed expected as we found such a metallic band orbital contribution to for both Co1 and Co2 sites. In fact is unmodified with respect to that on Co3+, so that the extra contributions found for and could be mainly due to such band contributions, as is suggested by the correlation between the spin and orbital in plane anisotropies found in Table 2. One could notice however hereagain that if the hole orbitals were purely , one would not expect any in plane anisotropy of , so that heregain band calculations of might help to determine the populations of the and orbitals.
These observations on the Na and Co sites are reminiscent of the respective situations found for the NMR of the 89Y and of the 63Cu nuclei of the CuO2 planes of the YBCO cuprates. In that case, as for Na NMR here, the 89Y NMR shift which is only coupled to spin magnetism was found nearly isotropicAlloul et al. (1993) while the anisotropy of orbital shift of 63Cu was due to that of , though in that case the orbital contribution due to the in plane hole orbitalTakigawa et al. (1989) does not display any anisotropy in the CuO2 plane.
Spin shift in plane anisotropy
As the spin susceptibility is nearly isotropic from SQUID and Na NMR shift data, the large in plane anisotropy of the Co2 NMR spin shift data has to be associated with an anisotropy of hyperfine couplings, which are linked with the occupancy of the electronic orbitals involved at the Fermi level.
Further comparison with the cuprates could help us to better understand the in plane anisotropy of 59Co NMR spin shifts detected here. Quite generally the spin shift tensor is slightly more complicated than indicated in Eq. 5 as nuclear spins at site can be coupled both to the on site magnetism and to that of their near neighbour sites, so that
| (12) |
where is the anisotropic on-site hyperfine coupling tensor and is the transferred hyperfine coupling through oxygen orbitals with the nearest neighbors. In YBCO there is no hole occupancy on the Y site and therefore no on site hyperfine coupling so that the hyperfine coupling of 89Y to the Cu site magnetism is only due to the transferred which has been found isotropic.Alloul et al. (1993) On the contrary the anisotropy of on site coupling is responsible for the large measured anisotropy of the 63Cu spin shift. Even in this simple case with a single Cu axial site it took sometime to understand that a rather large isotropic value of was required to explain the data.Mila and Rice (1989) Here, we shall benefit of this approach to perform a tentative preliminary analysis of the Co1 and Co2 data summarized in Table 2.
For the axial Co1 sites, only a shift anisotropy is detected. If =0, then Co1 sites are non-magnetic Co3+ ions which bear no on site magnetic spin susceptibility. As the Y ions in the cuprates they would be inert magnetically and would sense the magnetism of the Co2 orbitals only through transferred hyperfine couplings with the Co2 magnetism. The anisotropy should then be associated with an anisotropy of the coupling of the Co1 with its first Co2 nearest neighbours. A dipolar coupling of Co1 with its six Co2 neighbours would correspond to a larger negative contribution to the shift for , contrary to observation. A non zero value with a small filling of the hole orbital on the Co1 would better explain the sign of the anisotropy with a maximum shift contribution for .
But of course the most intriguing experimental information resides in the totally non-axial spin shift values found here for the Co2 sites, given in Table 2. Averaging the data for the Co2a and Co2b sites results in ; and .
These large anisotropic contributions to the shift might be dominated by on site hyperfine couplings with the and orbitals. We can note hereagin, as for the discussion of the EFG, that the axial symmetry of the which points along the axis would only yield axial shift contributions and would not differentiate and directions, contrary to the orbitals. So the large difference between and can only be attributed to the in plane order of orbitals associated with the kagomé structure. If one considers the transfer integral paths of orbitals between Co2 neighbouring sites, one would be inclined to associate the direction, with the largest shift value with the direction sketched in Fig. 11.
Let us note however that nothing forbids as well to consider here that the term itself is anisotropic. Detailed consideration of the Wannier orbitals constructed for the full atomic structure of this ordered phase could help to explain these measured anisotropies and would allow altogether to determine the relative populations of and hole orbitals on the Co2 sites at the Fermi level.
VII Conclusion
In this experiment we have completely determined experimentally the NMR parameters of the four Co sites of the atomic structure of this Na2/3CoO2 phase, which allows us to confirm that its electronic structure differentiates in fact two sites in the CoO2 plane: Co1 with a charge and Co2 with a charge . The data for the EFG, the orbital NMR shifts and orbital are compatible with a hole content at most of on the Co1 site as we had already anticipated.
From our NMR data we confirm as well that a single band dominates the anomalous electronic properties of this phase at the Fermi level. A totally unexpected aspect revealed by these data is the existence of large in plane anisotropies of the EFG and NMR shifts on the Co2 site. We have shown that this implies that the hole orbitals on those sites are not exclusively on orbitals and that parts of the holes reside in the in plane orbitals which should then play an important role in the delocalization of the holes.
So the single hole band hybridizes those orbitals and the kagomé like electronic structure that we evidenced then displays not only a charge disproportionation between Co1 and Co2 sites, but as well an in plane charge order of the orbitals on the Co2 sites. Quantum chemistry calculations taking into account the full structure might permit to go beyond the qualitative arguments developed here and should provide quantitative data for the energy levels from the values obtained experimentally for the EFG, hyperfine couplings and orbital shift parameters.
One would like then to understand the respective roles of the Na order and of the electronic correlations in driving this electronic structure. In principle LDA calculations including the Na order should allow to understand whether the Na potential is sufficient to shift down the Co1 energy levels and to induce the Co3+ filling of the Co1 orbitals. Preliminary calculations along this line seem to indicate that this is not the case and therefore that it is essential to better take into account the electronic interactions.Lechermann In such a case the kagomé like organization of the electronic structure would be an intrinsic disproportionation in the Co planes which would lock the Na order.Boehnke and Lechermann (2010)
Our work evidences that the resulting situation is quite simple in this Na2/3CoO2 phase, and resumes in a simple two site charge disproportionated CoO2 plane which could be introduced in a simplified model. This would allow one to perform then cluster DMFT calculations to establish the role of correlations which are of course essential to explain the large Curie-Weiss like dependence found for the susceptibility as well as the 2D ferromagnetic correlations deduced from our spin lattice relaxation data.Alloul et al. (2008)
In any case we have shown that the NaxCoO2 compounds display stable Na ordered phases in which charge ordered states of the CoO2 planes occur so that the real atomic structure has much larger 2D unit cells than that of the CoO2 plane. We might anticipate then that most ARPES experiments, which isolate a specific surface after cleaving do not sample the electronic properties of the actual 3D ordered state but are affected by the unavoidable Na disorder in such experimental conditions, although in some cases specific local Na orderings have been observed by STM experiments on cleaved surfaces.Pai et al. (2008)
An interesting case is that of some misfit cobaltates Maignan et al. (2003) for which the multilayer structure is obtained by stacking rocksalt structures with CoO2 planes. In that case cleaving is done in the middle of the rocksalt structure, as in High cuprates, and an ARPES experiment Nicolaou et al. (2010) has evidenced that in the specific case of BaBiCoO2 the electronic structure displays a reconstruction which could result from a charge order analogous to that seen in the NaxCoO2 phases. Unfortunately in that case it has so far not been possible to perform NMR experiments allowing to resolve the sites,Bobroff et al. (2007) so that detailed comparisons are not possible.
Finally we have established here on a specific case the importance of charge disproportionation and orbital ordering in this compound. No doubt that for all hole dopings for similar effects do occur as diverse Na orderings are anticipated and observed and result in very distinct correlated electronic states.Mendels et al. (2005); Shu et al. (2007); Alloul et al. (2008); Lang et al. (2008) We think that the present NMR studies allow us to reach for the first time a very detailed description of such effects in multiorbital transition oxides.
Acknowledgements.
We would like to thank here A.V. Dooglav and T.A. Platova for the stimulations provided by the NQR experiments, J. Bobroff and P. Mendels for their help on the experimental NMR techniques and for constant interest and stimulating discussions, and A.N. Lavrov for helpful discussions on material properties aspects. We acknowledge as well G. Collin for his initial unvaluable help on sample characterization and x-ray analysis. We benefited from enlightening discussions with M.B. Lepetit and J. Soret about the quantum chemistry of these systems and with F. Lechermann about the EFG and the band structure of the cobaltates. I.R.M. thanks for partial support of this work the Russian Foundation for Basic Research (project no.10-02-01005a), Ministry of Education and Science of the Russian Federation (project no.2010-218-01-192 and theme no.1.44.11) and Université Paris-Sud for associate professor visiting positions. This work has been done within the Triangle de la Physique and H.A. thanks its initial funding by ANR grant Oxyfonda NT05-4 41913.Appendix A Oxygen vacancies
A recent publication Shu et al. (2010) is dedicated to discredit our results Alloul et al. (2009); Platova et al. (2009) and in support of structural models of the Na cobaltates that this group has been proposing for many years for large values.
(i) In this paper the authors suggest that our samples, being synthesized at high , are not Na2/3CoO2 but rather Na2/3CoO1.98. We can hardly discard solely from our NMR data the presence of such a low content of oxygen vacancies. As each Co has six near neighbor oxygen, only about 6% of the Co would have such near neighbor vacancies. If those sites would get well defined NMR shift and EFG they should be detected either in NMR or NQR. But as soon as some disorder is expected in the corresponding parameters due to long distance interactions between defects, we would not be able to detect them. We may however easily exclude that vacancies could induce perturbations beyond their first nearest neighbors. Those would yield a broad background signal involving then a large Co NMR intensity. So, if present, such oxygen vacancies should just play a similar role to that of Na atoms and give delocalized carriers on the kagomé structure, independently of the Co1 sites Co3+ signal which are connected with the ordered Na sites.
To conclude on that point, there is so far no microscopic experimental evidence for the existence of such oxygen vacancies neither in Ref. Shu et al., 2010 nor in our NMR/NQR data.
(ii) Beyond this materials research aspect, Shu et al. speculate, heragain without any microscopic evidence, that the Na order in our samples (putatively Na2/3CoO1.98) might be a structure built from a succession of planes with Na trivacancies and Na tetravacancies,Shu et al. (2009) which they have proposed for their sample with an assumed composition of Na0.71CoO2.
We claim that this is definitely contradicted by all our former NMR, NQR and x-ray data Alloul et al. (2009); Platova et al. (2009) and by the present 59Co NMR data. It is easy to establish that this structure corresponds to Na crystallographic sites (with relative intensities 3/6/3/2/3), and Co sites (with relative intensities 1/1/1/3/3/3/3/9). This is well beyond the three Na sites we have detected by NMR Mukhamedshin et al. (2004) and the four Co sites we have detected both by NQR Alloul et al. (2009); Platova et al. (2009) and here by NMR. Finally the structure we have proposed from the analysis of our NMR/NQR data in Ref. Alloul et al., 2009 has been confirmed by the perfect fit obtained with the Rietveldt x-ray data analysis performed on our samples.Platova et al. (2009)
So the self consistency of our data on our Na2/3CoO2 samples cannot be put into question. Whether the structure proposed by Shu et al. for their Na0.71CoO2 samples is the actual one remains a question which might be resolved in the future by performing independent NMR/NQR investigations on their samples.
Appendix B Check of the powder alignment by NMR
The alignment of the sodium cobaltates powders being dependent on the microstructure of the grains, some of our samples were indeed not well oriented. We demonstrate here how we could use the NMR spectra to distinguish poorly oriented samples from well oriented ones.
In Fig. 12 we show a 23Na NMR spectra measured in two samples of Na2/3CoO2 compound. One of them is well oriented sample - Sample A - and we show there the spectra measured in two directions of the applied magnetic field - and . As evidenced before Mukhamedshin et al. (2004); Platova et al. (2009) in the Na2/3CoO2 phase there are three unequvalent sodium sites - Na1, Na2a, Na2b. We found that although the central lines and satellites singularities of the 23Na spectrum can be easily located, the overall shape of the NMR spectrum is very sensitive to the degree of orientation of the powder sample. In Fig. 12 we also show results of the computer simulations of the 23Na NMR spectra using the parameters of Eq. 2 from Ref. Mukhamedshin et al., 2004. Here we have optimized the particles axis angular orientation distribution to fit accurately the spectrum (Lorentzian distribution of width). It’s important to mention that we used exactly the same angular distribution parameters for the 59Co simulations shown in Figs. 3-6. As one can see the agreement between experimental and simulated spectra are very good.
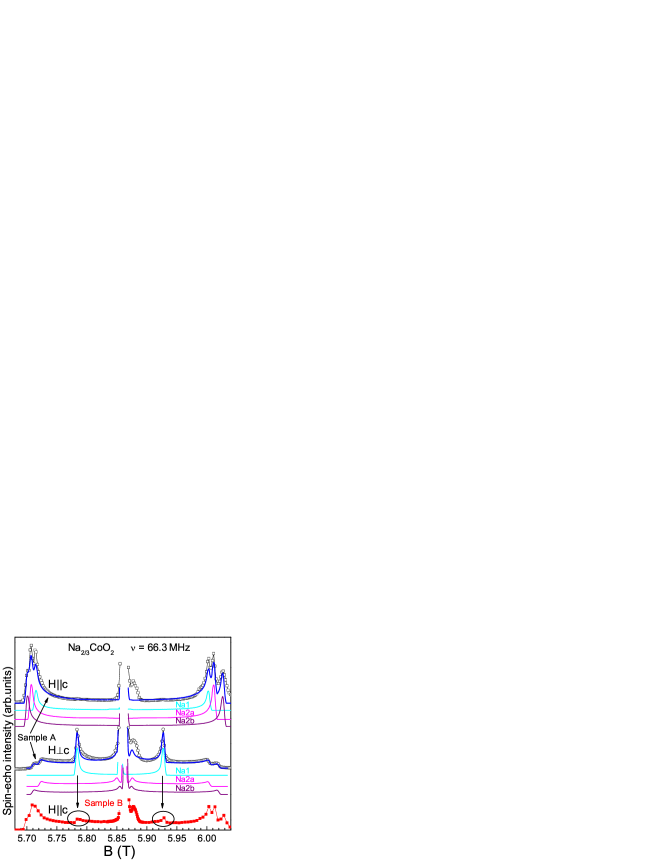
At the bottom of Fig. 12 we show a 23Na NMR spectrum measured in sample B of Na2/3CoO which happened to be less well oriented. Comparing this spectrum with that measured in Sample A it is easy to see for , the presence of Na1 singularities specific to the direction of applied magnetic field. That is due to a fraction of particles which remained randomly oriented as they were either not single crystallites, or were too much packed or agglomerated and could not orient. Also a less prominent, but still detectable feature of this less oriented sample is the poor resolution of the quadrupolar satellites.
In Fig. 13 we demonstrate the distinction between the 59Co NMR spectra measured in these two samples as well. The comparison can summarized as follows
1) First of all in the sample B spectrum measured for one can see an extra line, circled as (1) which corresponds to the central lines of Co1a and Co1b sites in the direction - marked by arrow in Fig. 13.
2) Also one can see that for the well oriented sample A that the NMR spectrum measured for is rather symmetric whereas the spectrum for is asymmetric with a higher signal intensity for the lower field values which could be assigned to fast relaxing cobalts. In sample B even in the spectrum some asymmetry could be seen and is here again associated with the contribution from grains which did not orient in the field. This extra intensity, circled as (2), had mislead us by suggesting that a Co site labeled as Co3 could have a large purely axial shift (see Fig. 2c in Ref. Mukhamedshin et al. (2005)).
3) Again in the sample B spectrum the quadrupolar satellites are less resolved as one can see in Fig. 13, on the part circled as (3).

Appendix C Determination of from full analyzes of the 59Co NMR spectra
The 59Co NMR of the slow relaxing Co1 sites in the Na≈0.7CoO2 compounds are easy to observe and were seen even by continuous wave NMR.Ray et al. (1999) In the Na2/3CoO2 compound even small details for the Co1a and Co1b sites could be detected and have been reported.Gavilano et al. (2006) The axial symmetry of these sites symmetrizes the magnetic shift and quadrupolar tensors which makes the NMR lines of 59Co in these positions rather narrow and intense.
The case is more complicated for the fast relaxing Co2 sites in the Na≈0.7CoO2 compounds. Even in the single crystals the NMR spectra of these sites are broad and not well resolved.Ning et al. (2004) The same situation occurs in our oriented powder samples - see Fig. 2 as an example. As in our samples the -axis of different crystallites are aligned along one can distinguish in the spectrum the two sets of 7 lines which correspond to the different transitions for the two cobalt sites Co2a and Co2b. For , the NMR spectrum of the fast relaxing cobalts is found broad and non-resolved, as the particles in our samples have a powder distribution of axes for . This experimental fact immediately tells that the local symmetry for the Co2 sites is lower than for the Co1 sites.
To clarify the spectra of the Co2 sites for we used various facts:
1) The position of the different singularities in the fast relaxing Co2 spectra are the same whatever the sample and whatever the sample preparation method, as one can see in the Fig. 2. The positions of the singularities in the NMR spectra depend on both the quadrupole splitting (which could be considered practically as temperature independent) and the magnetic shift which scales with the susceptibility .
2) The main feature of the Na2/3CoO2 phase is a large temperature dependence of the spin susceptibility. As we have shown that the local fields are quite similar for the three detected Na sites Mukhamedshin et al. (2004), the first moment (center of gravity) of the 23Na NMR spectrum allows us to follow the spin susceptibility of the cobalts up to room . Therefore using as a reference we tried to follow the corresponding variation of the Co shift tensor.
We measured then the 59Co NMR spectra at different temperatures in swept field mode and at each temperature pointed the positions (field values) of all singularities in the spectra of fast relaxing Co2. After that we converted them into field shift values using Eq. 4 and plotted them versus taken at the measurement temperature. Each spectrum taken at a given then allows to report all the data points on a vertical line in Fig. 14a.
As one can see, some singularities for the fast relaxing Co2 appear well organized around extremal values of the shift, with 3+3 satellites spaced by the quadrupole splitting - in Fig. 14b we show two such sets of singularities by lines. Initially we assumed that these two sets of singularities correspond to the two cobalt sites: one with a large shift in direction and the other a small shift, but this assumption did not allow us to explain all the data.
Unexpectedly we found that the values of quadrupole splitting for these two sets of singularities correspond to the and values of the Co2b site (the corresponding and values were determined by NQR with high presicionPlatova et al. (2009)). Therefore the main conclusion of Fig. 14b is that we have a large anisotropy of in-plane magnetic shift for the dominant Co2b site with distinct values of and .
As the number of Co2a sites in the unit cell of the Na2/3CoO2 phase is twice smaller than that of Co2b sites, the intensity of their NMR signal is also twice smaller. This makes more difficult to resolve the Co2a site in the spectra. As one can see in Fig. 14b many singularities are located in between the identified Co2b singularities. Using them and the values of and for Co2a sites,Platova et al. (2009) one can suggest two sets of singularities for the Co2a sites - see Fig. 14c. And in fact the Co2a sites exhibit the same in-plane magnetic shift anisotropy as the Co2b sites - just with slightly smaller values of the magnetic shifts and quadrupole splittings.
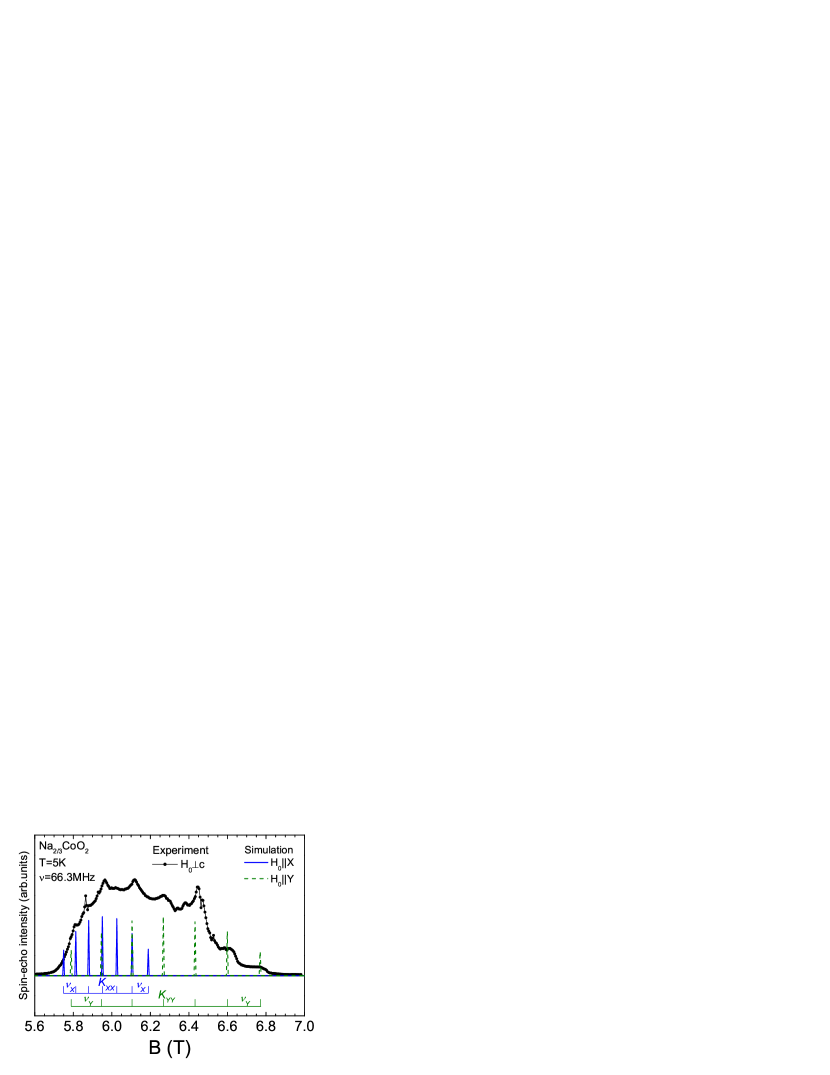
Therefore the fast relaxing cobalt spectra can be finally explained in a simple manner. In Fig.15 we show the simulated set of NMR lines of Co2b for the two outermost cases for which and . These two spectra form the main singularities in the cobalt spectra while most of its intensity comes from the particles with intermediate orientations. The large difference in the and values makes the cobalt spectra totally asymmetric.
References
- Terasaki et al. (1997) I. Terasaki, Y. Sasago, and K. Uchinokura, Phys. Rev. B, 56, R12685 (1997).
- Mendels et al. (2005) P. Mendels, D. Bono, J. Bobroff, G. Collin, D. Colson, N. Blanchard, H. Alloul, I. Mukhamedshin, F. Bert, A. Amato, and A. D. Hillier, Phys. Rev. Lett., 94, 136403 (2005).
- Foo et al. (2004) M. Foo, Y. Wang, S. Watauchi, H. W. Zandbergen, T. He, R. J. Cava, and N. P. Ong, Phys. Rev. Lett., 92, 247001 (2004).
- Takada et al. (2003) K. Takada, H. Sakurai, E. Takayama-Muromachi, F. Izumi, R. A. Dilanian, and T. Sasaki, Nature, 422, 53 (2003).
- Singh (2000) D. J. Singh, Phys. Rev. B, 61, 13397 (2000).
- Abbamonte et al. (2005) P. Abbamonte, A. Rusydi, S. Smadici, G. D. Gu, G. A. Sawatzky, and D. L. Feng, Nature Physics, 1, 155 (2005).
- Ando et al. (2002) Y. Ando, K. Segawa, S. Komiya, and A. N. Lavrov, Phys. Rev. Lett., 88, 137005 (2002).
- Zandbergen et al. (2004) H. W. Zandbergen, M. Foo, Q. Xu, V. Kumar, and R. J. Cava, Phys. Rev. B, 70, 024101 (2004).
- Mukhamedshin et al. (2004) I. R. Mukhamedshin, H. Alloul, G. Collin, and N. Blanchard, Phys. Rev. Lett., 93, 167601 (2004).
- Alloul et al. (2008) H. Alloul, I. R. Mukhamedshin, G. Collin, and N. Blanchard, EPL (Europhysics Letters), 82, 17002 (2008).
- Roger et al. (2006) M. Roger, D. J. P. Morris, D. A. Tennant, M. J. Gutmann, J. P. Goff, J.-U. Hoffmann, R. Feyerherm, E. Dudzik, D. Prabhakaran, A. T. Boothroyd, N. Shannon, B. Lake, and P. P. Deen, Nature, 445, 631 (2006).
- Shu et al. (2007) G. J. Shu, A. Prodi, S. Y. Chu, Y. S. Lee, H. S. Sheu, and F. C. Chou, Phys. Rev. B, 76, 184115 (2007).
- Huang et al. (2009) F.-T. Huang, M.-W. Chu, G. J. Shu, H. S. Sheu, C. H. Chen, L.-K. Liu, P. A. Lee, and F. C. Chou, Phys. Rev. B, 79, 014413 (2009).
- Mukhamedshin et al. (2005) I. R. Mukhamedshin, H. Alloul, G. Collin, and N. Blanchard, Phys. Rev. Lett., 94, 247602 (2005).
- Lang et al. (2008) G. Lang, J. Bobroff, H. Alloul, G. Collin, and N. Blanchard, Phys. Rev. B, 78, 155116 (2008).
- Julien et al. (2008) M.-H. Julien, C. de Vaulx, H. Mayaffre, C. Berthier, M. Horvatić, V. Simonet, J. Wooldridge, G. Balakrishnan, M. R. Lees, D. P. Chen, C. T. Lin, and P. Lejay, Phys. Rev. Lett., 100, 096405 (2008).
- Bobroff et al. (2006) J. Bobroff, G. Lang, H. Alloul, N. Blanchard, and G. Collin, Phys. Rev. Lett., 96, 107201 (2006).
- Ning et al. (2008) F. L. Ning, S. M. Golin, K. Ahilan, T. Imai, G. J. Shu, and F. C. Chou, Phys. Rev. Lett., 100, 086405 (2008).
- Alloul et al. (2009) H. Alloul, I. R. Mukhamedshin, T. A. Platova, and A. V. Dooglav, EPL (Europhysics Letters), 85, 47006 (2009).
- Hinuma et al. (2008) Y. Hinuma, Y. S. Meng, and G. Ceder, Phys. Rev. B, 77, 224111 (2008).
- Platova et al. (2009) T. A. Platova, I. R. Mukhamedshin, H. Alloul, A. V. Dooglav, and G. Collin, Phys. Rev. B, 80, 224106 (2009).
- Shu et al. (2010) G. J. Shu, W. L. Lee, F.-T. Huang, M.-W. Chu, P. A. Lee, and F. C. Chou, Phys. Rev. B, 82, 054106 (2010).
- Ning et al. (2004) F. L. Ning, T. Imai, B. W. Statt, and F. C. Chou, Phys. Rev. Lett., 93, 237201 (2004).
- Wang et al. (2003) Y. Wang, N. S. Rogado, R. J. Cava, and N. P. Ong, Nature, 423, 425 (2003).
- Egorov et al. (1990) A. Egorov, O. Bakharev, A. Volodin, S. Korableva, M. Tagirov, and M. Teplov, Sov. Phys. JETP, 70, 658 (1990).
- Platova et al. (2010) T. A. Platova, I. R. Mukhamedshin, A. V. Dooglav, and H. Alloul, JETP Lett., 91, 421 (2010).
- Abragam (1961) A. Abragam, The Principles of nuclear magnetism (Oxford: Clarendon Press, London, 1961).
- Slichter (1990) C. P. Slichter, Principles of Magnetic Resonance, 3rd ed. (Springer-Verlag, Berlin, New York, 1990).
- Egorov et al. (2003) A. V. Egorov, I. R. Mukhamedshin, and H. Suzuki, Physica B: Condensed Matter, 329-333, 1397 (2003).
- Ihara et al. (2004) Y. Ihara, K. Ishida, C. Michioka, M. Kato, K. Yoshimura, H. Sakurai, and E. Takayama-Muromachi, Journal of the Physical Society of Japan, 73, 2963 (2004).
- Gavilano et al. (2006) J. L. Gavilano, B. Pedrini, K. Magishi, J. Hinderer, M. Weller, H. R. Ott, S. M. Kazakov, and J. Karpinski, Phys. Rev. B, 74, 064410 (2006).
- Moriya (1963) T. Moriya, Journal of the Physical Society of Japan, 18, 516 (1963).
- Andrew and Tunstall (1961) E. Andrew and D. Tunstall, Proc. Phys. Soc., 78, 1 (1961).
- Mcdowell (1995) A. F. Mcdowell, Journal of Magnetic Resonance, Series A, 113, 242 (1995).
- Obata (1963) Y. Obata, Journal of the Physical Society of Japan, 18, 1020 (1963).
- Lang et al. (2005) G. Lang, J. Bobroff, H. Alloul, P. Mendels, N. Blanchard, and G. Collin, Phys. Rev. B, 72, 094404 (2005).
- de Vaulx et al. (2005) C. de Vaulx, M.-H. Julien, C. Berthier, M. Horvatić, P. Bordet, V. Simonet, D. P. Chen, and C. T. Lin, Phys. Rev. Lett., 95, 186405 (2005).
- Pillay et al. (2008) D. Pillay, M. D. Johannes, I. I. Mazin, and O. K. Andersen, Phys. Rev. B, 78, 012501 (2008).
- Yang et al. (2005) H.-B. Yang, Z.-H. Pan, A. K. P. Sekharan, T. Sato, S. Souma, T. Takahashi, R. Jin, B. C. Sales, D. Mandrus, A. V. Fedorov, Z. Wang, and H. Ding, Phys. Rev. Lett., 95, 146401 (2005).
- Nicolaou et al. (2010) A. Nicolaou, V. Brouet, M. Zacchigna, I. Vobornik, A. Tejeda, A. Taleb-Ibrahimi, P. L. Fèvre, F. Bertran, C. Chambon, S. Kubsky, S. Hébert, H. Muguerra, and D. Grebille, EPL (Europhysics Letters), 89, 37010 (2010).
- Liebsch and Ishida (2008) A. Liebsch and H. Ishida, European Physical Journal B, 61, 405 (2008).
- (42) M. B. Lepetit, private communication.
- (43) J. Soret, PhD thesis, unpublished.
- Alloul et al. (1993) H. Alloul, A. Mahajan, H. Casalta, and O. Klein, Phys. Rev. Lett., 70, 1171 (1993).
- Takigawa et al. (1989) M. Takigawa, P. C. Hammel, R. H. Heffner, and Z. Fisk, Phys. Rev. B, 39, 7371 (1989).
- Mila and Rice (1989) F. Mila and T. Rice, Physica C: Superconductivity, 157, 561 (1989).
- (47) F. Lechermann, private communication.
- Boehnke and Lechermann (2010) L. Boehnke and F. Lechermann, ArXiv e-prints (2010), arXiv:1012.5943 [cond-mat.str-el] .
- Pai et al. (2008) W. W. Pai, S. H. Huang, Y. S. Meng, Y. C. Chao, C. H. Lin, H. L. Liu, and F. C. Chou, Phys. Rev. Lett., 100, 206404 (2008).
- Maignan et al. (2003) A. Maignan, S. Hébert, M. Hervieu, C. Michel, D. Pelloquin, and D. Khomskii, Journal of Physics: Condensed Matter, 15, 2711 (2003).
- Bobroff et al. (2007) J. Bobroff, S. Hébert, G. Lang, P. Mendels, D. Pelloquin, and A. Maignan, Phys. Rev. B, 76, 100407 (2007).
- Shu et al. (2009) G. J. Shu, F.-T. Huang, M.-W. Chu, J.-Y. Lin, P. A. Lee, and F. C. Chou, Phys. Rev. B, 80, 014117 (2009).
- Ray et al. (1999) R. Ray, A. Ghoshray, K. Ghoshray, and S. Nakamura, Phys. Rev. B, 59, 9454 (1999).