First Principles Phase Diagram Calculations for the Octahedral-Interstitial System ZrOX,
Abstract
First principles based phase diagram calculations were performed for the octahedral-interstitial solid solution system (; [ ]=Vacancy; ). The cluster expansion method was used to do a ground state analysis, and to calculate the phase diagram. The predicted diagram has four ordered ground-states in the range , but one of these, at X=5/12, is predicted to disproportionate at T, well below the experimentally investigated range T. Thus, at T, the first-principles based calculation predicts three ordered phases rather than the four that have been reported by experimentalists.
Key words:
ZrOX; Zr suboxides; Zircalloy; First Principles;
Phase diagram calculation; vacancy-interstitial ordering; order-disorder;
alloy theory.
I Introduction
Zircalloy is used as nuclear fuel-rod cladding in light water reactors, but it is metastable with respect to oxidation by the UO2 fuel.Cronenberg1978 ; Hoffman1984a ; Hoffman1984b ; Hoffman1985
Oxidation of zircalloy transforms it from the high-temperature (high-T), oxygen-poor, bcc solution (ZrX) into the low-T, oxygen-rich, hcp-based solution (ZrOX). At temperatures between about 1173K and 573K various ordered phases have been reported. Holmberg1961 ; Yamaguchi1968 ; Fehlmann1969 ; Yamaguchi1970 ; Hirabayashi1972 ; Hirabayashi1974 ; Hashimoto1974 ; Arai1976 ; Sugizaki1985
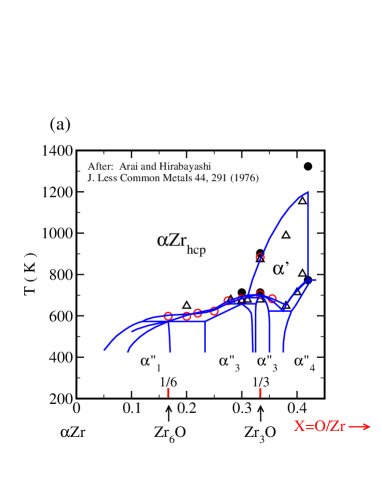
Octahedral interstitial ordering of oxygen (O), and vacancies ([ ]) in (, ) increases microhardness Dubertret1966 and brittleness Cronenberg1978 , and therefore, promotes stress corrosion cracking. Order-disorder transitions were studied via heat capacity measurements: Arai and Hirabayashi Arai1976 studied alloys with O/Zr ratios of 0.16 and 0.24 at 473K-973K; Tsuji and Amaya Tsuji1995 made similar measurements on alloys with O/Zr ratios of 0.0, 0.10, 0.13, and 0.24, at 325K-905K.
Arai and Hirabayashi Arai1976 achieved a high degree of long-range ordering in samples that were cooled from 623K to 523K, during a period of about one month, which indicates a high mobility of oxygen in , even at such modest temperatures; hence a system that is highly reactive even at such moderate temperatures.
A recent computational study Ruban2010 reported ground-state structures and order-disorder transition temperatures for Zr6O and Zr3O, but did not present a calculated phase diagram, or report if the calculated order-disorder transitions in Zr6O and Zr3O are first-order, as experiment indicates, or continuous.
The results presented below are mostly consistent with experimental studies with respect to the comparison between computationally predicted ground-state (GS) structures and reported (experimental) low-temperature () ordered phases. with the exception that in the range the calculations predict only two ordered phases at , rather than the three called and in Arai and Hirabayashi (1976).Arai1976
Experimental values for the maximum solubility of O in Zr, Xmax, range from: 29 at. % Domagala1954 ; Yamaguchi1968 ; to 35 at. % Abriata1986 ; and 40 at. % Hirabayashi1974 ; Arai1976 ; Sugizaki1985 . The first-principles results presented here support a higher value; i.e. X. This may reflect an insufficiently negative calculated value for the formation energy of monoclinic ZrO2.
II Methodology
II.1 Total Energy Calculations
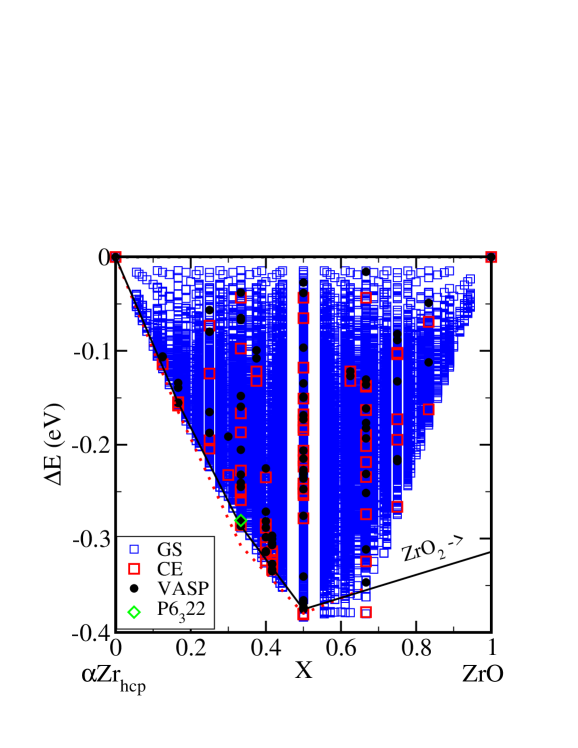
Formation energies, (Fig. 1) were calculated for fully relaxed hcp Zr, hcp ZrO (hcp Zr with all octahedral interstices occupied by O), and 96 supercells of intermediate composition. All calculations were performed with the density functional theory (DFT) based Vienna simulation program (VASP, version 445 Disclaimer ; Kresse1993 ) using projector-augmented plane-wave pseudopotentials, and the generalized gradient approximation for exchange and correlation energies. Electronic degrees of freedom were optimized with a conjugate gradient algorithm, and both cell constant and ionic positions were fully relaxed. Pseudopotential valence electron configurations were: Zrsv: 4s4p5s4d; Os: 3s23p4.
Total energy calculations were converged with respect to k-point meshes by increasing the density of k-points for each structure until convergence. A 500 eV energy cutoff was used, in the ”high precision” option which guarantees that absolute energies are converged to within a few meV/site (a few tenths of a kJ/site of exchangeable species; O, [ ]). Residual forces were typically 0.02 eV or less.
Calculated formation energies, , relative to a mechanical mixture of Zr + ZrO, for the 96 supercells are plotted as solid circles in Fig. 1. Values of are,
| (1) |
where: is the total energy of the supercell; is the energy/atom of ; is the energy/atom of .
II.2 The Cluster Expansion Hamiltonian
The cluster expansion, CE Sanchez1984 , is a compact representation of the configurational total energy. In the system, the solid solution configuration is described by pseudospin occupation variables , which take values when site- is occupied by [ ] and when site- is occupied by O.
The CE parameterizes the configurational energy, per exchangeable cation, as a polynomial in pseudospin occupation variables:
| (2) |
Cluster is defined as a set of lattice sites. The sum is taken over all clusters that are not symmetrically equivalent in the high-T structure space group, and the average is taken over all clusters that are symmetrically equivalent to . Coefficients are called effective cluster interactions, ECI, and the multiplicity of a cluster, , is the number of symmetrically equivalent clusters, divided by the number of cation sites. The ECI are obtained by fitting a set of VASP FP calculated structure energies, . The resulting CE can be improved as necessary by increasing the number of clusters and/or the number of used in the fit.
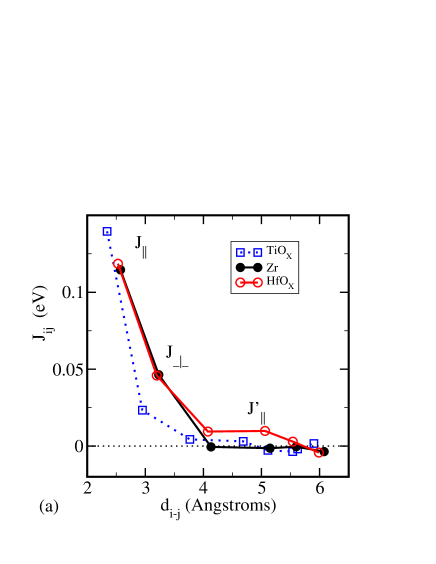
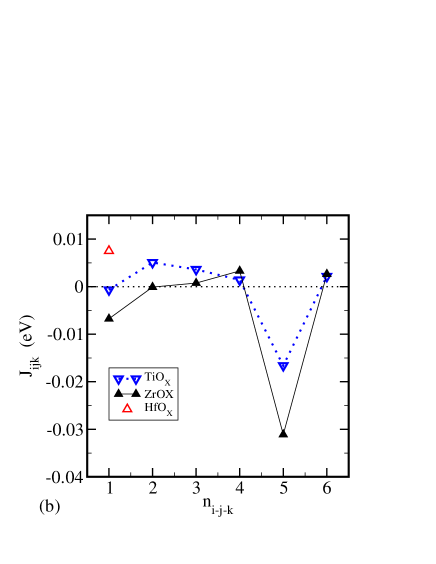
Fitting was performed with the Alloy Theoretic Automated Toolkit (ATAT) Axel2002a ; Axel2002b ; Axel2002c ; Disclaimer which automates most of the tasks associated with the construction of a CE Hamiltonian. A complete description of the algorithms underlying the code can be found in Axel2002b . The zero- and point-cluster values were -0.421118 eV and 0.006221 eV, respectively. The six pair and six 3-body ECI that comprise the complete CE Hamiltonian are plotted in Figs. 2a and 2b, respectively. ECI for the isostructural TiOX (open symbols, blue online) and HfOX (open symbols, red online) systems are also plotted for comparison. As expected, nearest neighbor (nn) O-O pairs are highly energetic, and therefore strongly avoided; hence nn-pair ECI are strongly (ECI , for O-[ ] nn pairs); but beyond nn-pairs, the O-[ ] pairwise ECI are close to zero. The ratio of magnitudes for nn-pair ECIs that are parallel- () and perpendicular () to cHex, respectively, is . Note that the 4’th nn-pair ECI is the second-nn parallel to cHex, () and .
These results are similar to those presented in Ruban et al. Ruban2010 although their effective pair interactions and ours are not identically defined.
Long-period superstructure (LPSS) phases were reported Fehlmann1969 ; Yamaguchi1970 in samples with with bulk compositions close to Zr3O (essentially the field in Arai and Hirabayashi Arai1976 , their Fig. 9). Hence, it is reasonable to speculate that the CE-Hamiltonian might be like that in an axial next nearest neighbor Ising model (ANNNI-model), Bak1980 in which one expecs and to be opposite in sign,and of comparable magnitudes ( Bak1980 ); however, (Figs. 2).
III Results
III.1 Ground-States
The CE was used for a ground-state (GS) analysis that included all configurations of [ ] and O in systems of 18 or fewer Zr-atoms (octahedral interstitial sites); a total of structures (reduced by symmetry). Five GS were identified in the range, , i.e. at X = 0, 1/6, 1/3, 5/12 and 1/2; solid circles (black online) on the convex hull (solid line) in Fig. 1. The extension of the convex hull towards monoclinic zirconia () is also plotted in Fig. 1. The CE-results suggest that all four VASP-GS in the subsystem are also GS of the Zr-O binary, and that the maximum solubility of O in Zrhcp is X (higher than the experimental value, X 0.4). Note that, the predicted CE-GS at Zr3O2 is not a GS for the VASP calculations (not a VASP-GS); hence the VASP-predicted maximum solubility of O in Zr is X.
The larger open squares (red online) in Figure 1 are CE-calculated values for the that correspond to the VASP calculations, and the smaller open squares (blue online) are for the remaining 262,144-96=262048 structures in the GS analysis. The open diamond symbol (green online) indicates the calculated formation energy for the P6322 structure for Zr3O that was originally proposed by Holmberg and Dagerhamn Holmberg1961 ; this structure is also described in Table I. All space group determinations were performed with the FINDSYM program. Disclaimer ; FINDSYM
| System | X | Space Group | Calculated cell | Idealized |
| atomic | IT number | constants | Atomic | |
| fraction O | Pearson Symbol | () | Coordinates | |
| Zr6O | 1/6 | R | O: 1/6, 1/6, 1/6 | |
| 148 | Zr: 3/4, 1/12, 5/12 | |||
| 1/7 | hP7 | Zr: 11/12, 7/12, 1/4 | ||
| Zr: 1/12, 5/12, 3/4 | ||||
| Zr: 1/4, 11/12, 7/12 | ||||
| Zr: 5/12, 3/4, 1/12 | ||||
| Zr: 7/12, 1/4, 11/12 | ||||
| Zr3O | 1/3 | Rc | O: 1/6, 1/6, 1/6 | |
| 167 | O: 2/3, 2/3, 2/3 | |||
| 1/4 | hP8 | Zr: 3/4, 1/12, 5/12 | ||
| Zr: 11/12, 7/12, 1/4 | ||||
| Zr: 1/12, 5/12, 3/4 | ||||
| Zr: 1/4, 11/12, 7/12 | ||||
| Zr: 5/12, 3/4, 1/12 | ||||
| Zr: 7/12, 1/4, 11/12 | ||||
| Zr3O | 1/3 | P6322 | O: 1/3, 2/3, 0 | |
| 182 | O: 2/3, 1/3, 1/2 | |||
| 1/4 | hP8 | Zr: 1/3, 0, 0 | ||
| Zr: 0, 1/3, 0 | ||||
| Zr: 2/3, 2/3, 0 | ||||
| Zr: 2/3, 0, 1/2 | ||||
| Zr: 0, 2/3, 1/2 | ||||
| Zr: 1/3, 1/3, 1/2 | ||||
| Zr12O5 | 5/12 | R | O: 1/12, 1/12, 1/12 | |
| 148 | O: 1/4, 1/4, 1/4 | |||
| 5/17 | hP17 | O: 1/2, 1/2, 1/2 | ||
| O: 2/3, 2/3, 2/3 | ||||
| O: 11/12, 11/12, 11/12 | ||||
| Zr: 1/8, 11/24, 19/24 | ||||
| Zr: 1/24, 17/24, 3/8 | ||||
| Zr: 23/24, 7/24, 5/8 | ||||
| Zr: 21/24, 13/24, 5/24 | ||||
| Zr: 19/24, 1/8, 11/24 | ||||
| Zr: 17/24, 3/8, 1/24 | ||||
| Zr: 5/8, 23/24, 7/24 | ||||
| Zr: 13/24, 5/24, 21/24 | ||||
| Zr: 11/24, 19/24, 1/8 | ||||
| Zr: 3/8, 1/24, 17/24 | ||||
| Zr: 7/24, 5/8, 23/24 | ||||
| Zr: 5/24, 7/8, 13/24 | ||||
| Zr2O | 1/2 | P1m | 0, 0, 0 | |
| 162 | O: 1/3, 2/3, 1/2 | |||
| 1/3 | hP9 | O: 2/3, 1/3, 1/2 | ||
| Zr: 0, 1/3, 3/4 | ||||
| Zr: 1/3, 1/3, 1/4 | ||||
| Zr: 1/3, 0, 3/4 | ||||
| Zr: 2/3, 0, 1/4 | ||||
| Zr: 2/3, 2/3, 3/4 | ||||
| Zr: 0, 2/3, 1/4 |
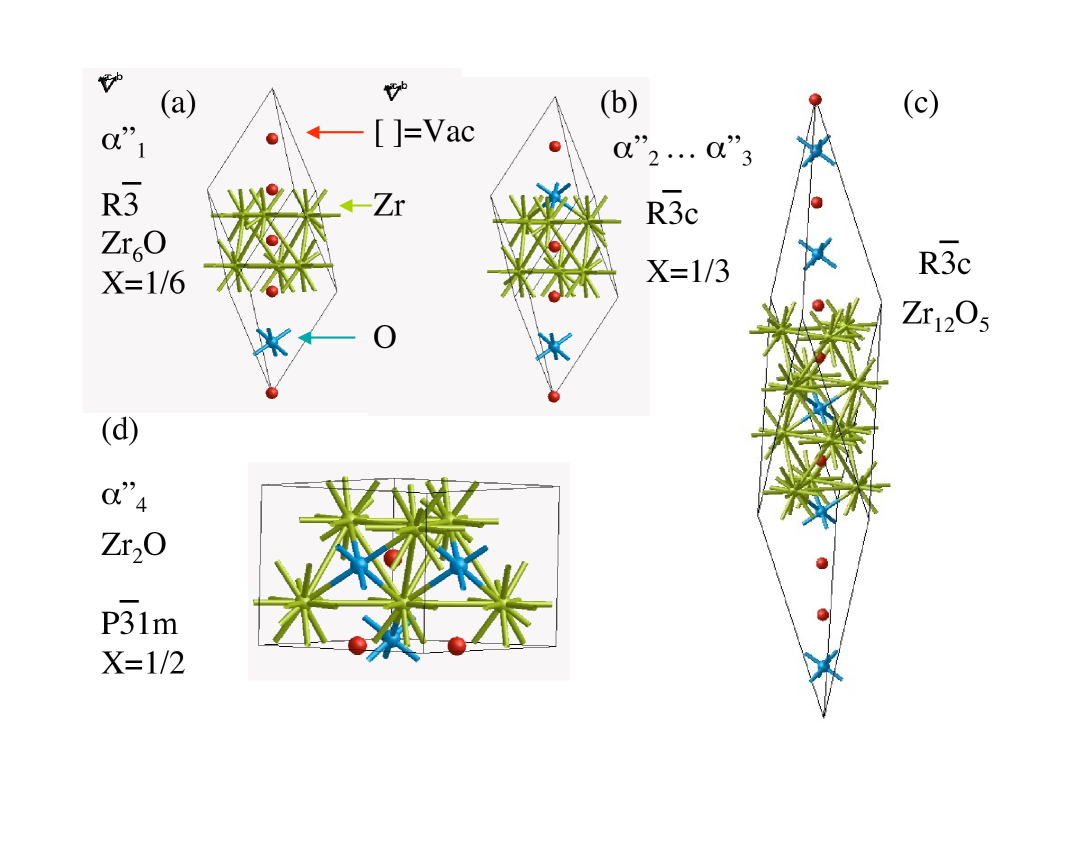
Crystal structures of the VASP- and CE-GS in Zr-ZrO are described in Table I and their idealized structures are drawn in Figures 3 a-d: Zr is represented by spheres connected with bond-sticks (yellowish-green online); O is represented by isolated spheres with bond-sticks (blue online); and [ ] are represented by isolated spheres (red online).
Various low-T ordered structures have been reported, Yamaguchi1968 ; Yamaguchi1970 ; Hirabayashi1972 ; Hirabayashi1974 ; Hashimoto1974 ; Arai1976 ; Sugizaki1985 with the most recent review by Sugizaki et al. Sugizaki1985 ; who used neutron diffraction to study short-range order in ZrO0.3 solid solutions. Their Figs. 1a-c presented representations of three ordering schemes that were observed within different homogeneity ranges: (a) ZrOx at X (P321); (b) ZrOy at 1/3 (P6322); (c) ZrOz near the solubility limit X (P). Space groups for these idealized structures were not reported by Sugizaki et al. Sugizaki1985 ; they were determined in this work with the FINDSYM program. FINDSYM Comparing structures (a)-(c) above to the results of this work: (a) VASP calculations indicate that this structure is clearly not a GS; (b) is the P6322 structure shown as an open diamond (green online) in Fig. 1, its formation energy is very close, but higher than, the VASP-GS at X=1/3; (c) is the same P structure as the VASP-GS at X=1/2.
III.1.1 Zr6O, X=1/6,
The structure of Zr6O is thought to be isomorphic to that of Hf6O and Ti6O Arai1976 ; Abriata1986 : a; cc0; Z=3 (a0 and c0 are the cell constants of the disordered P63mmc alloy).Hirabayashi1972 This is also the VASP-GS at X=1/6, Fig. 3(a) and Table 1.
III.1.2 Zr3O, X=1/3,
Based on X-ray diffraction studies, Holmberg and Dagerhamn Holmberg1961 proposed a P6322 structure (open diamond, green online, in Fig. 1) with a and c for a sample with X. Based on single crystal neutron diffraction studies Yamaguchi Yamaguchi1968 reported X-ray, electron and neutron diffraction data on samples in the range ZrO0.18-ZrO0.30 (1/5) and listed atomic coordinates for a ”P3c1” structure with , c. Yamaguchi Yamaguchi1968 also reported confirmation of the P6322 structure in the composition range 0.33 (1/2 ). The FP results presented here suggest that the VASP-GS at X=1/3 is the Rc structure depicted in Figure 3 (b). The calculated energy-difference between these two structures is only 0.006 eV, and this difference is probably within DFT error, but the precision of these calculations is sufficient to recognize the Rc structure as the VASP-GS.
III.1.3 Zr, X=5/17
This structure does not correspond to any reported phase, and because it is predicted to disproportionate at TK. It is not expected to be observed experimentally.
III.1.4 Zr2O, X=1/2,
The only Zr2O structure listed in Pearson Pearson is cubic, and the apparent solubility limit of X 0.4, rather than X=1/2, which suggests that the VASP calculations may underestimate the stability of monoclinic ZrO2, and therefore finds the GS tieline between the P1m GS at X=1/2 and monoclinic ZrO2, rather than between the Rc GS at X=1/3 and monoclinic ZrO2. Another possibility is that the experimentally measured low-temperature equilibrium between Zr-suboxides and monoclinic ZrO2 was measured at too low a fugacity of oxygen to stabilize the P1m phase at X=1/2. As one expects from the ECI (Fig. 2), there are no O-O nn pairs in the VASP-GS P1m structure, or in any of the four structures with formation energies within 0.01 eV (right panel Fig. 1).
III.2 The Phase Diagram
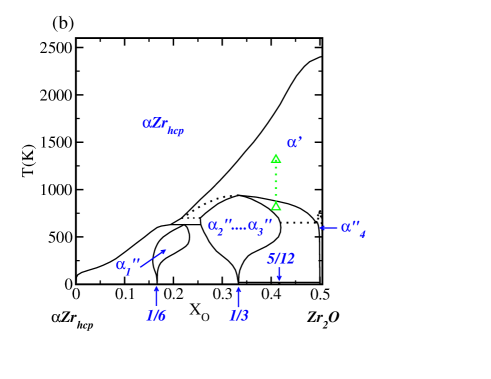
A first principles phase diagram (FPPD) calculation was performed with grand canonical Monte Carlo (MC) simulations using the emc2 code which is part of the ATAT package Axel2002a ; Axel2002b ; Axel2002c . Input parameters for emc2 were: a simulation box with at least 1568 octahedral sites (15x15x6 supercell); 2000 equilibration passes; 2000 Monte Carlo passes. The predicted phase diagram is shown in Figure 4. Most phase boundaries were determined by following order-parameters of the various ordered phases as functions of X and T; here order parameters are defined such that they are unity in a specified GS-phase, zero in the disordered phase, and typically some non-zero value in ordered phases other than their specified GS. Dotted boundaries are used to acknowledge uncertainties in phase boundary determinations.
III.3 The Intermeadiate Temperature -Phase
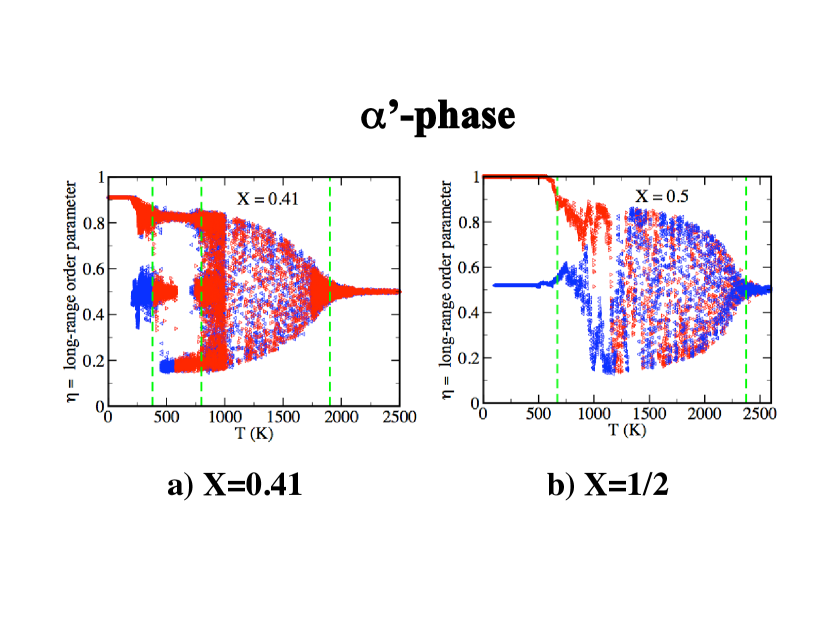
As observed experimentally in samples with X=0.41, Hirabayashi1974 (up-pointing triangles, green online, Fig. 4) a two-step order-disorder process is predicted for Figures 5. The data reported in Hirabayashi et al. Hirabayashi1974 appear to indicate that both order-disorder transitions are second-order (continuous) in character, at least at X=0.41, but the calculations reported here suggest that the lower-T transition is strongly first-order (at least at X=1/2) while the higher-T transition is continuous.
The simulated intermediate-temperature -phase
crystal structure was determined by symmetry analysis, using
the ISODISTORT program Disclaimer ; ISODISTORT . There are
two plausible transition paths from the P63/mmc high-T disordered phase
to the P1m GS:
-
•
(1) P63/mmc P63/mcm P1m, irrecucible representation, (-1,-2,0),(2,1,0),(0,0,1) basis;
-
•
(2) P63/mmc Pm1 P1m, irreducible representation, (0,-1,0),(1,1,0),(0,0,1) basis.
Path (1) can be ruled out because it requires a first-order P63/mmc P63/mcm transition, with unit-cell expansion along both axes, which neither experiment nor computation supports.
structue: ; ; ∗ X=O/Zr.
| Atom | Wyckoff site | x | y | z | occupancy |
|---|---|---|---|---|---|
| Zr | 2d | 1/3 | 2/3 | 1 | |
| O1 | 1a | 0 | 0 | 0 | |
| O2 | 1b | 0 | 0 | 1/2 |
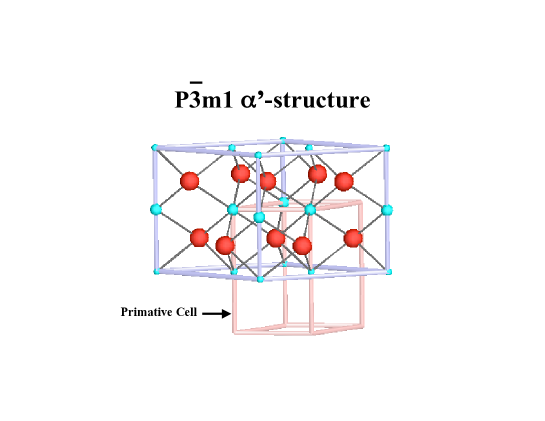
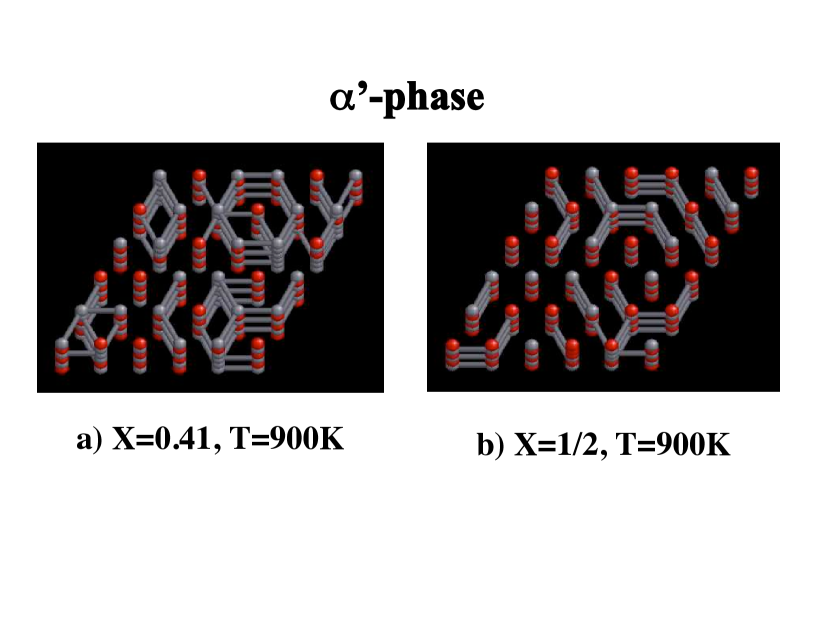
Path (2) permits a continuous P63/mmc Pm1 transition, as observed experimentally and supported computationally. The , Pm1 structure is described in Table 2 and depicted in Fig. 6; where O:[ ]-sites are represented by relatively smaller and larger spheres (blue online). The precise occupations of sites O1 and O2 can be written as and , respectively; where is the O-occupancy of site O1, and X=O/Zr; i.e. at X=0.41 and then . With respect to space-group determination, the only requirement is that the occupancy of O1 must be different from that of O2. The Pm1 structure is clearly consistent with the computational results shown in Figures 7a and 7b. The O:[ ]-distributions (online O=red, [ ]=gray) in these figures were simulated on reduced (6x6x3) supercells by cooling from 1000K to 900K. For clarity Zr-atoms are omitted to highlight the strong preference for O:[ ]-ordering along ; i.e. strong O-O nn avoidance along . In the Pm1 structure this leads to alternating nn-layers, that are relatively O-rich and O-poor ([ ]-rich). Visually, this statistical difference is obscured in the simulation snapshots (Figures 7a and 7b) because one has: discrete O and [ ]; O:[ ]-disorder; and antiphase boundaries.
IV Discussion
IV.1 Comparison of Calculated and Experimental Phase Diagrams
The main differences between the FPPD presented here and the ”tentative phase diagram” in Arai and Hirabayashi Arai1976 (Fig. 4a; their Fig. 9) are with respect to their representations of broad homogeneity ranges for three ordered phases in the range and . In this range, Arai and Hirabayashi report three low-T ordered phases, , , and ; whereas the FPPD has only two; note that the predicted GS at X=5/12 disproportionates at T. Also, the FPPD-predicted -phase field is significantly larger than the corresponding field in Fig. 4a, and at X=0.41 the - transition is predicted to occur higher than experiment suggests, Fig. 5a. Typically, FPPD calculations overestimate order-disorder transition temperatures especially when, as here, the excess vibrational contribution to the free energy VIB is ignored; so it is not surprising that agreement between experiment and theory is not close for the order-disorder transition. Note however, that the maximum temperatures for stabilities of phases other than are roughly equal to those shown in Fig. 4a.
IV.2 Long-Period Superstructures at X1/3
Based on X-ray, neutron, and electron scattering data, Fehlmann et al. Fehlmann1969 and Yamaguchi and Hirabayashi Yamaguchi1970 reported a variety of long-period superstructures (LPSS) in samples with bulk compositions X1/3 (the field, Fig. 4a) that were subjected to various heat treatments. The FPPD calculation presented here does not predict LPSS fields, but a similar calculation for HfOX appears to predict Devil’s Staircases of ordered phases at Hf3O and Hf2O. Burton2011 In an ANNI-model like Hamiltonian, one expects, , however, the 12-pair fit which includes yields and with the same sign and . Physically, the fitted values for and are easy to rationalize in terms of O-O nn-repulsion, and this argues against stable LPSS phases, unless they are stabilized by competition between higher-order interactions; e.g. 3’rd and further nn-pair-ECI or multiplet interactions. In fact, FPPD calculations for the HfOX system, which has a CE Hamiltonian very similar to that for ZrOX, indicate a Devis’s Staircase of LPSS phases at Hf. Burton2011
V Conclusions
Ground-State ordered phases are predicted at X=0, 1/6, 1/3, 5/12 and 1/2, but the one at X=5/12 is predicted to disproportionate at T, hence it is not expected to be observed experimentally. In the range , in which Arai and Hirabayashi Arai1976 report three phases ( and ) only two are predicted; i.e. the phase fields that Arai and Hirabayashi Arai1976 draw for and are predicted to be a single-phase solid solution. Figure 1a clearly indicates that a zeroth order model for octahedral interstitial O:[ ]-ordering is one in which first- and second-nn pairwise interactions ( and , respectively) strongly favor O-[ ] nn-pairs; i.e. O-O nn-pairs are highly unfavorable, and . Including in the ECI fit does not yield an ANNNI-like Bak1980 CE-Hamiltonian; however, recent FPPD calculations for the HfOX system, Burton2011 (the HfOX-CE is very similar to the ZrOX-CE) predict Devis’s Staircases of LPSS phases at Hf3O and Hf2O.
The most probable transition path (on cooling) for O-rich solutions, is P63/mmc Pm1 P1m; hence the average -structure has Pm1 symmetry with alternating O-rich and [ ]-rich layers .
References
- (1) A. W. Cronenberg, M. S. El-Genk J Nuc. Materials 78, 390 (1978).
- (2) P. Hoffman and D. Kerwin-Peck J. Nuc. Materials 124, 80 (1984).
- (3) P. Hoffman, D. Kerwin-Peck and P. Nikolopoulos J. Nuc. Materials 124, 114 (1984).
- (4) P. Hoffman and J. Spino J. Nuc. Materials 127, 127 (1985).
- (5) B. Holmberg and T. Dagerhamn Acta Chem. Scand 15 919 (1961).
- (6) S. Yamiguchi J. Phys. Soc. Japan 24[4], 855 (1968).
- (7) M. Fehlmann, A. Jostsons and J. G. Napier Z. Kristallogr. 129 318 (1969).
- (8) S. Yamiguchi and M. Hirabayashi J. Appl. Cryst. 3, 319 (1970).
- (9) M. S. Hirabayashi, S. Yamaguchi, T. Arai, J. Phys. Soc. Japan 35[2], 473 (1972).
- (10) M. S. Hirabayashi, T. Yamaguchi, T. Arai, H. Asano and S. Hashimoto Phys. Stat. Sol. (a) 23, 331 (1974).
- (11) S. Hashimoto, H. Iwasaki, S. Ogawa, S. Yamaguchi and M. Hirabayashi J. Appl. Cryst. 7, 67 (1974).
- (12) T. Arai and M. Hirabayashi J. :ess common Met. 44, 291 (1976).
- (13) Y. Sugizaki, S. Yamiguchi, S. Hashimoto, M. Hyrabashi and Y. Ishikawa J. Phys. Soc. Japan 54(7), 2543 (1985).
- (14) A. Dubertret and P. Lehr Compt. Rendus Acad. Sc. Paris, t. 262 1147 (1966).
- (15) T. Tsuji and M. Amaya J. Nuc. Matter. 33, 223 (1995).
- (16) A. V. Ruban, V. I. Baykov, B. Johansson,i V. V. Dmitriev and M. S. Blanter B 82, 134110 (2010).
- (17) R. F. Domagala and D. J. McPherson J. Metals 200 238 (1954).
- (18) Bull. Alloy Phase Diagrams 7[2], 116 (1986).
- (19) Disclaimer: the use of a specific software package should not be misinterpreted as implying a NIST endorsement of that package.
- (20) Kresse, G. and Hafner, J., Phys. Rev. B47: 558-561 (1993); Kresse, G. Thesis, Technische Universität Wien (1993); Phys. Rev. B49: 14 251 (1994). Kresse, G. and Furthmüller, J. (1996) Comput. Mat. Sci. 6: 15-50; Phys. Rev. B54: 11169 (1996); cf. http://tph.tuwien.ac.at/ vasp/guide/vasp.html.
- (21) Sanchez, J.M., Ducastelle, F. and Gratias, D., Physica 128A, 334 (1984).
- (22) van de Walle, A., Asta, M. and Ceder, G. The alloy theoretic automated toolkit: A user guide. CALPHAD Journal 26 p. 539 (2002).
- (23) van de Walle A. and Ceder, G., Journal of Phase Equilibria, 23 p. 348 (2002).
- (24) A. van de Walle and M. Asta, Modelling Simul. Mater. Sci. Eng. 10, 521 (2002).
- (25) P. Bak and J. von Boehm, Phys. Rev. B 21, 5297 (1980).
- (26) H. T. Stokes and D. M. Hatch, J. Appl. Cryst. 38, 237-238 (2005). http://stokes.byu.edu/findsym.html
- (27) P. Villars and L. D. Calvert, ”Pearson’s Handbook of Crystallographic Data for Intermetallic Phases” Vol. 1, American Society for Metals, Metals Park, OH 44073 (1985).
- (28) B. J. Campbell, H. T. Stokes, D. E. +Tanner, and D. M. Hatch, J. Appl. Cryst. 39, 607-614 (2006) http://stokes.byu.edu/isodistort.html.
- (29) A. van de Walle and G. Ceder Rev. Mod. Phys. 74, 11 (2002a); Journal of Phase Equilibria, 23, 348 (2002b). A. van de Walle, M. Asta, and G. Ceder. CALPHAD Journal, 26, 539 (2002c). A. van de Walle and M. Asta, Modelling Simul. Mater. Sci. Eng., 10, 521 (2002d).
- (30) B. P. Burton and A. van de Walle unpublished.