Very Large Array monitoring of 1720 MHz OH masers toward the Galactic center
Abstract
We present the first variability study of the 1720 MHz OH masers located in the Galactic Center. Most of these masers are associated with the interaction between the supernova remnant Sgr A East and the interstellar medium, but a few masers are associated with the Circumnuclear Disk (CND). The monitoring program covered five epochs and a timescale of 20-195 days, during which no masers disappeared and no new masers appeared. All masers have previously been detected in a single epoch observation about one year prior to the start of the monitoring experiment, implying relatively stable conditions for the 1720 MHz OH masers. No extreme variability was detected. The masers associated with the northeastern interaction region between the supernova remnant and the km s-1 molecular cloud show the highest level of variability. This can be explained with the km s-1 molecular cloud being located behind the supernova remnant and with a region of high OH absorbing column density along the line of sight. Possibly the supernova remnant provides additional turbulence to the gas in this region, through which the maser emission must travel. The masers in the southern interaction region are located on the outermost edge of Sgr A East which line of sight is not covered by either absorbing OH gas or a supernova remnant, in agreement with the much lower variability level observed. Similarly, the masers associated with the CND show little variability, consistent with them arising through collisions between relatively large clumps of gas in the CND and no significant amount of turbulent gas along the line of sight.
Subject headings:
ISM: supernova remnants — Galaxy: center — Masers — supernovae: individual(Sgr A East)1. Introduction
Masers observed in the 1720 MHz satellite line of OH are considered signposts of regions of shocked gas, since they often are associated with supernova remnants (SNRs) (e.g., Frail et al., 1994; Green et al., 1997). The 1720 MHz masers are not exclusively found in SNRs but are also detected in star forming regions (e.g., MacLeod, 1997; Szymczak & Gérard, 2004; Niezurawska et al., 2004), demonstrating that 1720 MHz masers may occur under different pumping conditions and OH column densities than those present in SNRs (Gray et al., 1991, 1992). Concentrating on the SNRs, the masers originate in the shocked region where the expanding SNR collides with the surrounding interstellar medium (ISM). Consistent with this model, a large number of 1720 MHz masers are found in the Galactic center (GC) where the Sgr A East SNR plows into the ISM, notably into the km s-1 molecular cloud (e.g., Sjouwerman & Pihlström, 2008, hereafter Paper I). The majority of these masers are observed along a circular pattern outlined by the expansion of the SNR, displaying a relatively small range of line of sight velocities between km s-1 (e.g., Yusef-Zadeh et al., 1996; Karlsson et al., 2003; Sjouwerman & Pihlström, 2008). In addition, two separate groups of masers are located near the Circumnuclear Disk (CND) that are not directly explained by the SNR/ISM interaction model. These two groups of masers have velocities that are offset from the Sgr A East masers; km s-1 and km s-1 respectively (Paper I). In Paper I we argue that these masers are unlikely to be pumped by a shock produced by Sgr A East. Other plausible pumping scenarios include local shocks produced by random motions of clumps or turbulence, supported by the presence of strong H2 (1-0) emission (Yusef-Zadeh et al., 2001), or by infrared (IR) pumping similar to conditions observed in star forming regions (Gray et al., 1992).
The environment in the CND is likely to be different from that in a SNR/ISM post-shock region. Variability studies of masers can be used to probe the environment and could further shed light on the differences in excitation mechanisms and conditions for CND versus SNR/ISM masers. In the CND, the pumping may include IR pumping routes, since local IR peaks are observed within the CND (Latvakoski et al., 1999). This would be in contrast to the ’standard’ SNR masers, which are pumped by collisions only. Also, differences in collision rate along the line of sight, due to clumpiness of the medium, could result in a different maser flux variability of the CND masers as compared to the SNR/ISM masers (Pihlström et al., 2008, 2001).
| Day of | Config. | Beam size | Channel rms | Obs. time |
|---|---|---|---|---|
| Year | ″″ | mJy beam-1 | hours | |
| 1 47 | A | 2.71.2 | 5.2 | 5 |
| 2 144 | BnA | 3.92.8 | 6.3 | 4 |
| 3 164 | BnA | 5.73.3 | 7.2 | 4 |
| 4 196 | B | 7.73.8 | 8.0 | 4 |
| 5 242 | B | 7.63.4 | 6.6 | 4 |
Variability of other OH maser transitions has been observed. For example, the 1612, 1665 and 1667 MHz circumstellar OH masers in variable stars frequently exhibit variability that is correlated with the stellar cycle (e.g., Jewell et al., 1979; Etoka & Le Squeren, 2000). Thus, this variability can be directly coupled to the infrared pumping mechanism of 1612, 1665 and 1667 MHz masers. For 1720 MHz masers in star forming regions, variability over two epochs have been reported by Caswell (2004), and variability on 15-20 minute timescale is seen for the masers in the star forming region W3(OH) (Ramachandran et al., 2006). However, the pumping of 1720 MHz masers in star forming regions include radiative pumping routes via IR emission from the central star (Gray et al., 1991, 1992). Such radiative pumping scheme is not available in the SNRs, which are completely collisionally pumped (Elitzur, 1976; Lockett et al., 1999; Wardle, 1999; Pihlström et al., 2008). Since these masers are excited by the SNR shock, it is less likely that any observed variability would be induced by pumping variations. Instead we expect that variations in the amplification path length would be the most direct method to produce amplitude variations in SNR/ISM 1720 MHz masers.
As little is known about the 1720 MHz maser variability in SNRs, we here present a five-epoch variability study of the 1720 MHz masers in the GC with the Very Large Array (VLA).
2. Observations
During 2006, five observations of the 1720 MHz OH masers in the GC were performed using the VLA under the project code AP500. Each observation had an observing time of typically four hours and used a single pointing centered on Sgr A* (J2000 coordinates RA 17 45 40.038, Dec 29 00 28.07). Observations were made over a total period of 195 days, with successive irregular intervals ranging from 20 to 97 days (Table 1). The observations were done with dual circular polarization using two IF pairs of 1.562 MHz bandwidth each. The two IFs were centered at offset velocities in order to cover a large, total velocity range (243 km s km s-1). With 128 channels and no on-line smoothing applied, the resulting velocity resolution was 2.6 km s-1. The data were calibrated using VLARUN, a pipeline VLA data reduction procedure available in AIPS. After continuum subtraction in the u,v–plane the data was imaged with natural weighting using standard AIPS procedures. Phase-only self-calibration was performed against the brightest maser feature with a peak flux density of 5.2 Jy at 66 km s-1. Full spectral line cubes were made using the AIPS task IMAGR. Depending on the VLA configuration, the resulting data cubes had slightly different synthesized beam sizes, listed in Table 1 along with the typical rms channel noise in each cube. All data was averaged over the length of the observing run. Shorter averaging times are not considered in this paper since the increased signal to noise ratio would prevent many masers from being reliably detected.
The amplitude scale was calibrated using 3C286 as the absolute flux calibrator, and then bootstrapped to the phase calibrator 1751253. The mean flux density of 1751253 over Epoch 1-5 was 998 mJy and varied less than 3%. The flux density bootstrapping procedure resulted in average amplitude corrections of 1.030.09, corresponding to an amplitude uncertainty of 9%, thus dominating the flux errors.
To identify masers, the AIPS task SQASH was used to produce maps of the maximum intensity over the velocity axis, for each sky pixel. In each of those resulting ’maxmaps’ (Sjouwerman et al., 1998), a feature was considered a detection if the flux density exceeded 8. A weaker feature can be considered a detection, if it occurred at a position already known to harbor a maser (e.g., in Paper I), or if it would occur in at least three of the five epochs. We acknowledge that this potentially would bias toward non-(diss)appearing sources, but we have not found this to be a problem in this data. To calculate the integrated flux given in Table 2 channels with emission down to three times the rms noise were included.
3. Results
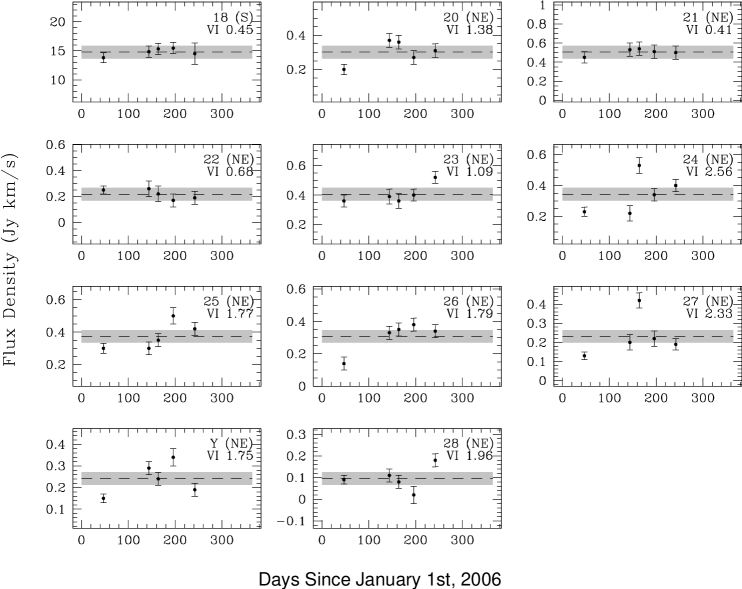
We use same notation of masers previously detected as in Paper I, in order of increasing RA (see Table 2). In total 27 masers were detected, out of which one was new111This maser is among a few potential detections that did not meet the strict 10 detection criteria in Paper I (it was a 7.8 peak detection there, consistent with ). (maser “Y”). Maser are listed as a single maser, as it was unresolved and seen as a single maser in the last epoch. Table 2 presents the properties of each maser feature in each epoch, including velocity integrated flux, the number of channels with flux density exceeding 3 times the rms noise, the variability index and the maser region. We define as:
| (1) |
where is the number of epochs, the integrated flux at epoch , the average integrated flux and where is the average flux error over all epochs. This variability index is a measure of average variability about the mean, in units of the rms flux error. We consider a maser variable if , i.e. if the flux on average varies more than the average error in the flux.
| No | Integrated fluxaaThe error in the integrated flux is estimated from the rms noise in the image and the uncertainty in the line width which is assumed to be 25 of the channel width. and number of channelsbbThe number of channels for which the flux density exceeded 3. | VI | Region | |||||||||
|---|---|---|---|---|---|---|---|---|---|---|---|---|
| (Jy km s-1) | ||||||||||||
| Epoch 1 | Nch | Epoch 2 | Nch | Epoch 3 | Nch | Epoch 4 | Nch | Epoch 5 | Nch | |||
| 1 | 0.230.03 | 2 | 0.220.03 | 2 | 0.200.03 | 2 | 0.210.03 | 2 | 0.220.03 | 2 | 0.31 | CND |
| 2 | 0.080.02 | 1 | 0.060.02 | 1 | 0.050.02 | 1 | 0.080.03 | 1 | 0.070.02 | 1 | 0.43 | CND |
| 3 | 0.200.03 | 3 | 0.210.03 | 2 | 0.240.04 | 2 | 0.240.04 | 2 | 0.230.04 | 2 | 0.46 | CND |
| 5 | 1.680.21 | 2 | 1.750.22 | 2 | 1.760.22 | 2 | 1.780.22 | 2 | 1.740.22 | 1 | 0.11 | NW |
| 6ccThis maser is probably not directly associated with the SNR/ISM interaction, see Paper I | 0.220.03 | 3 | 0.230.03 | 2 | 0.270.04 | 3 | 0.200.03 | 2 | 0.180.05 | 1 | 0.75 | |
| ddThis maser is actually two, but in Epoch 5 they were not resolved and are treated as one feature in this paper | 5.540.35 | 4 | 5.660.28 | 5 | 5.670.29 | 5 | 5.650.29 | 5 | 5.420.34 | 4 | 0.28 | CND |
| 8 | 0.490.05 | 3 | 0.480.04 | 2 | 0.440.06 | 2 | 0.470.05 | 3 | 0.470.06 | 2 | 0.23 | NW |
| 10 | 0.930.06 | 4 | 1.100.07 | 4 | 1.040.09 | 3 | 1.170.10 | 4 | 0.960.12 | 2 | 0.87 | S |
| 11 | 0.210.03 | 3 | 0.270.04 | 4 | 0.150.03 | 1 | 0.460.04 | 5 | 0.280.03 | 3 | 2.26 | NW |
| 12 | 0.240.03 | 2 | 0.250.03 | 2 | 0.230.04 | 2 | 0.240.04 | 2 | 0.270.04 | 2 | 0.33 | S |
| 13 | 0.190.03 | 2 | 0.140.03 | 1 | 0.170.05 | 1 | 0.160.04 | 1 | 0.170.05 | 1 | 0.39 | S |
| 14 | 0.200.03 | 2 | 0.260.03 | 2 | 0.260.04 | 2 | 0.400.04 | 3 | 0.340.05 | 2 | 1.62 | S |
| 15 | 0.780.10 | 2 | 0.830.11 | 2 | 0.790.10 | 2 | 0.830.11 | 2 | 0.850.11 | 2 | 0.25 | S |
| 16 | 0.530.07 | 2 | 0.590.08 | 2 | 0.620.08 | 2 | 0.620.08 | 2 | 0.610.08 | 3 | 0.40 | S |
| 17 | 1.630.14 | 3 | 1.300.11 | 3 | 1.340.12 | 3 | 1.330.12 | 3 | 1.260.11 | 3 | 0.88 | S |
| 18 | 13.820.86 | 4 | 14.850.93 | 4 | 15.330.96 | 4 | 15.470.97 | 4 | 14.521.82 | 2 | 0.45 | S |
| 20 | 0.200.03 | 2 | 0.370.04 | 3 | 0.360.04 | 3 | 0.270.04 | 2 | 0.310.04 | 2 | 1.38 | NE |
| 21 | 0.450.06 | 2 | 0.530.07 | 2 | 0.540.07 | 2 | 0.510.07 | 2 | 0.500.07 | 2 | 0.44 | NE |
| 22 | 0.250.03 | 2 | 0.260.03 | 2 | 0.220.06 | 1 | 0.170.05 | 1 | 0.190.05 | 1 | 0.65 | NE |
| 23 | 0.360.04 | 3 | 0.390.04 | 2 | 0.360.05 | 2 | 0.400.04 | 3 | 0.520.04 | 4 | 1.09 | NE |
| 24 | 0.230.03 | 3 | 0.220.04 | 4 | 0.530.05 | 7 | 0.340.04 | 3 | 0.400.04 | 4 | 2.56 | NE |
| 25 | 0.300.03 | 4 | 0.300.04 | 2 | 0.350.04 | 3 | 0.500.05 | 6 | 0.420.04 | 4 | 1.78 | NE |
| 26 | 0.140.04 | 1 | 0.330.04 | 3 | 0.350.04 | 4 | 0.380.04 | 3 | 0.340.04 | 3 | 1.79 | NE |
| 27 | 0.130.02 | 2 | 0.200.03 | 2 | 0.420.04 | 4 | 0.220.04 | 2 | 0.190.03 | 2 | 2.33 | NE |
| YeeNew maser (not listed in Paper I) at RA = 17 45 50.4, Dec = 59 13, km s-1. | 0.150.02 | 3 | 0.290.04 | 4 | 0.240.03 | 4 | 0.340.04 | 4 | 0.190.03 | 2 | 1.75 | NE |
| 28 | 0.090.02 | 1 | 0.110.02 | 1 | 0.080.03 | 1 | 0.180.03 | 2 | 1.96 | NE | ||
The individual maser positions do not vary significantly between the epochs (less than the measurement errors; 0.3 arcseconds), and we can therefore conclude they are the same features being observed in all epochs. Moreover, the positions and velocities here agree with the positions and velocities of the masers detected in Paper I. In Paper I two masers detected in archival data were included for completeness, even though they were not detected in the observations: #4 and #19. These two masers were not re-detected in our new observations and we conclude they are extinct. Overall our results indicate stable conditions over at least year-long term for the masers.
For the relatively short timescales and sparse sampling of maser amplitudes reported on here, it is difficult to find patterns such as periodicity, a steady flux increase or decrease. Future more densely sampled surveys of the maser amplitudes over timescales of years will be needed to address the question of whether variability patterns exist. In this paper we therefore discuss these masers in terms of showing variability or not. By a visual inspection of Fig. 1 and the in Table 2, we find that 10 out of 26 masers show variability with . No maser is showing extreme variability, with the highest observed .
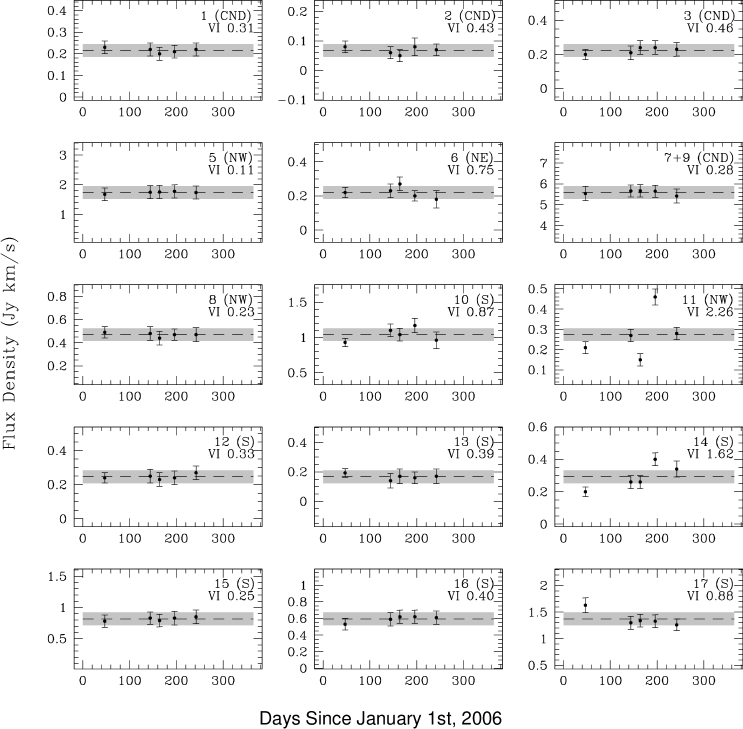
Maybe except for the weakest sources in Paper I (#11, #20 and #22) we do not see a correlation between high and weak flux, where measured flux errors may be a large fraction of the measured flux. We also do not see a correlation between flux and array configuration, where larger synthesized beams (at later dates) would be able to pick up more flux if the masers were angularly extended. There may be a bias in the flux if the measurements at individual epochs have used different numbers of channels. The effect is not entirely clear, and one could argue that varying maser emission, apart from varying in flux, may also vary in width of the spectral feature. The results obtained below seem to indicate that this potential dependence would only cause a minor adjustment to the numbers, but not the trend.
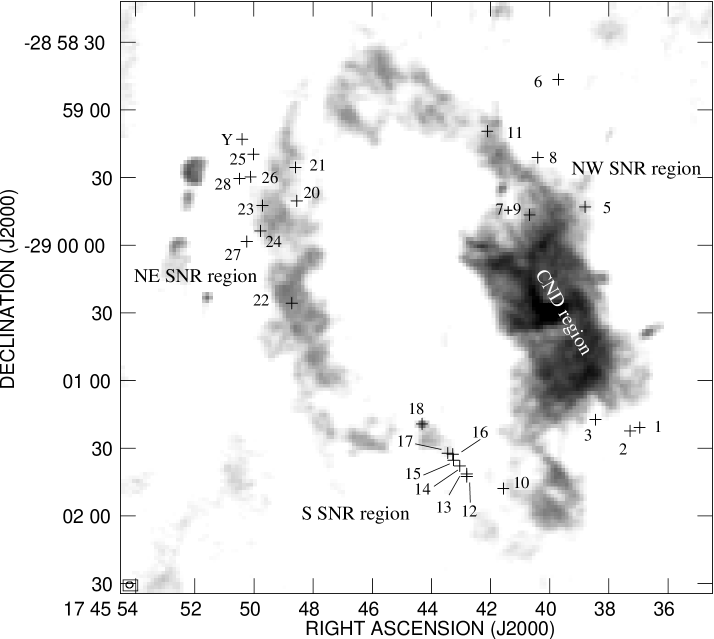
The most significant trend is that the region of SNR/ISM masers to the northeast has a much larger fraction of variable masers than in other regions. In the northeast, two out of 10 masers (80%) have with a median of . In contrast the southern SNR/ISM interaction region, the three scattered northwestern masers and the CND masers have two out of 15 masers (13%) that are variable with a median , while the majority of 13 masers (87%) are non-variable with a median of 0.40. Figure 2 displays the position of each maser feature, overlaid on the 1.7 GHz continuum flux density image. With this spatial distribution in mind, the origin of the maser variability is discussed in Sect. 4.
4. Discussion
During the 195 days over which our study took place the most significant result is that the northeastern masers associated with the SNR/ISM interaction show a higher degree of variability than the rest of the masers. Over the observed timescale no masers disappeared, and no new masers appeared. Compared to our observations in 2005 (Paper I) one new maser appeared (or more precisely, this time fulfilled our detection criteria). The two “archival” masers, included for completeness in Paper I, remain undetected. This indicates a quite stable environment for both SNR/ISM and CND masers during our monitoring campaign. In this section we first discuss how variability can be introduced by both external and intrinsic (Sect. 4.1) sources. Thereafter, we explore the nature of the variability of the SNR (Sect. 4.2) and CND (Sect. 4.3) masers respectively.
4.1. Maser variability
Observational errors such as a systematic incorrect value in the derived value of our flux calibrator in one of our epochs, pointing errors, etc., will have a predictable signature in the individual measurements. We have carefully looked for these in both our target and calibrator data and conclude that none of them contribute to the overall results. Flux variations can also be produced by interstellar scintillation (Narayan, 1992; Cordes & Rickett, 1998). This causes variations on timescales of a few minutes. Such short timescales are not considered in our study since in data averaged over a minute only a couple of masers would be bright enough to be reliably detected.
Assuming that the variability of the maser intensity is not due to observational effects, variability studies can be used to probe the maser environment. Changes in maser peak velocity could indicate acceleration, such as observed in outflows (Liljeström et al., 1989; Brand et al., 2003). In stellar masers, periodic maser variations may be related to periodicity found in the central object, in turn affecting the pumping conditions and/or the maser path length. SiO masers in the evolved Mira variables are examples of how the maser luminosity is a result of the phase of the central star (e.g. Wittkowski et al., 2007). Another example can be found in star forming regions (SFRs), where 22 GHz water masers are well-known to exhibit maser variability. The variability of these masers are characterized by large (sometimes several orders of magnitude) amplitude variations, and often with velocity drifts of a few km s-1 per year (Comoretto et al., 1990; Wouterloot et al., 1995; Claussen et al., 1996; Brand et al., 2003; Furuya et al., 2001, 2003). This occurs on timescales from a few hours to years. Water masers associated with SFRs are excited behind shocks, presumably caused by outflows or jets driven by the young stellar object (YSO), and much of the variation can be attributed to changes in the luminosity of the YSO, in turn affecting the pumping rate via changes in the outflows and jets (Elitzur et al., 1989; Felli et al., 1992).
OH masers associated with SFRs are predominantly observed in the radiatively pumped 1665 and 1667 MHz lines (sometimes accompanied by masers in the 1612 and 1720 MHz transitions), and variability of those masers have been investigated by multiple groups (Schwartz et al., 1974; Zuckerman et al., 1972; Rickard et al., 1975; Gruber & de Jager, 1976; Clegg & Cordes, 1991). The long term variability (weeks to months) can be attributed to changes in the number density of inverted OH molecules, or path length changes. In contrast, the short term variability is assumed to be related to sudden changes in the pumping mechanism, reflecting fluctuations in the host star luminosity. For OH masers in SNRs, the situation has been unknown. The 1720 MHz OH transition was for a long time the only transition observed near SNRs (Lockett et al., 1999; Wardle, 1999; Pihlström et al., 2008), although recent observations have shown Sgr A to harbor 36.2 and 44.1 GHz methanol masers (Sjouwerman et al., 2010; Pihlström et al., 2011). The 1720 MHz OH masers are usually assumed to originate in the post-shock region where the expanding SNR collides with the surrounding medium. No dedicated variability studies of 1720 MHz OH masers have been published to date, and we therefore know little about the stability of the maser environment in these sources. Here we have a shocked environment and since this is a large scale phenomena it must arise in the maser generating column density, or from the subsequent propagation of emission through the interstellar medium.
4.2. The SNR masers
The northeastern SNR masers clearly are variable on the timescales of weeks to months. These masers are the result of the SNR Sgr A East ramming into the km s-1 cloud and we expect the post-shock medium to display density variations due to turbulence in those regions, given that a shock has recently passed. Assuming that the masers can be considered as a series of velocity coherent regions of gas, bulk gas flow and turbulent motion in the source will move parts of the maser column in and out of velocity coherence along the line of sight. As a result, the maser will exhibit intensity variations. For the northeastern masers this cannot be the only source of the variability though, since much higher levels of variability are observed than toward other regions of Sgr A East. It is not clear whether it is the maser generating column density itself or the medium in front of the masers that is causing the variability. However, the km s-1 cloud is thought to be located behind Sgr A East (e.g., Coil & Ho, 2000, Paper I) and thus between the observer and the masers. When observing this group of masers we therefore probably look through a longer path length of turbulent gas than toward other regions of Sgr A East. This is supported by OH absorption observations showing this region harbors a much higher absorbing OH column density than the southern and northwestern interaction regions (Paper I, Karlsson et al. 2003). It is possible that the supernova covering the northeastern region contributes to the turbulence of this column density.
In contrast, the southern masers are occurring in a region where the two SNR Sgr A East and G359.020.09 are colliding. Here there is no clear evidence of large columns of gas in front of the masers, and no supernova crossing the line of sight.
4.3. The CND masers
The CND masers exhibit much less variability than the northeastern SNR masers, with no maser displaying variability with a . If the northeastern SNR/ISM maser variability is due to passage of the maser through a screen of hot turbulent gas, the (non-)variability of the CND masers is consistent with CND located in front of Sgr A East (Paper I).
Since variability could give insight into the maser environment, we consider whether the low variability is consistent with the presumed pumping and amplification conditions in the CND. Here the pumping cannot be due to a SNR/ISM shock, but the CND masers are thought to be pumped by collisions between clumps in the CND (Paper I). The number of clumps within the line of sight are probably only a few since once a clump has moved out of the line of sight, a maser is likely to disappear completely. Assuming an inclination of 65∘ (Latvakoski et al., 1999; Marr et al., 1993; Jackson et al., 1993; Christopher et al., 2005) and thus a rotational velocity of approximately 160 km s-1 of the maser emitting clouds in the CND, the motion in the plane of the sky over the 195 days is minimal; only pc (approximately 8 AU). This is much smaller than the high density cloud core sizes of pc that are estimated by molecular line observations (Christopher et al., 2005). Similarly, assuming typical relative clump velocities of 20-30 km s-1 in the sky-plane and 0.1 pc in size, a clump will pass by a compact maser in 3900 years. For a clump size of 1 AU the corresponding time is 2 months. If clump collisions and motions are involved in determining the path lengths for the CND masers, given the low variability levels observed the clumps must be much larger than 1 AU in size. More likely they are only a fraction of the size of the dense molecular clumps observed in HCN, perhaps corresponding to a high density region of the clump. For such clump sizes little variability can be expected due to path length changes.
A factor that could contribute to a more stable maser gain in the CND region is the pumping conditions. As measured in molecular line emission, HCN and HCO+ line intensity is stronger in the CND than in regions associated with, for example, the km s-1 cloud (Wright et al., 2001), implying higher densities. A higher density would result in a higher collision rate, thus keeping the pumping at a higher rate eventually resulting in more stable maser intensities. Note that Yusef-Zadeh et al. (2001) show that densities cm-3 are needed for clump-clump collisions to produce 1720 MHz pumping, which is slightly higher than the C-shock post-region density of cm-3 for the SNR masers (Lockett et al., 1999; Wardle, 1999).
What the exact pumping conditions and the pumping rate really are is difficult to calculate, and depends on the ortho-para ratio in the region. Both Lockett et al. (1999) and Pavlakis & Kylafis (1996) have found that collisions with para-H2 can strongly suppress the 1720 MHz inversion. Ortho- and para-H2 are thought to be formed on grains with a ratio of 3:1. At low temperatures ( K) proton exchange reaction convert ortho-H2 into para-H2, making the para-H2 being the dominant species. As the temperature increases, there is less of a difference, but still with para-H2 dominating (Offer & van Dishoeck, 1992). However, to create the 1720 MHz maser only a small amount of ortho-H2 is required, since the collision rate for ortho-H2 usually is larger by a factor of 2-3 than the para rates (Offer & van Dishoeck, 1992). The equilibrium ratio for ortho-para H2 is , which is equal to 1 for a temperature K, implying the temperature should be cooler than this value. This is consistent with a high density environment in the CND where the gas temperature is thermalized with the dust temperatures of 20-80 K (Becklin et al., 1982; Mezger et al., 1989), although molecular studies of the CND imply excitation temperatures anywhere between 50-200 K (Christopher et al., 2005; Jackson et al., 1993; Wright et al., 2001; Coil & Ho, 1999, 2000). Coil & Ho (2000) use NH3(2,2)/NH3)(1,1) ratios to derive rotational gas temperatures between 20-70 K, mostly in the outer regions of the CND. Perhaps, next to path-length geometry (Paper I), this is a reason that 1720 MHz masers are not seen all across the CND; if temperatures are too high the 1720 MHz emission will be suppressed.
5. Summary
We have presented the first flux monitoring study of 1720 MHz OH masers associated with an SNR. In total five epochs of the 1720 MHz OH masers in the GC were obtained, and used to estimate the maser flux in different regions of the GC. We find that the typical variability is very low, but that the northeastern SNR/ISM masers have a higher variability than the other masers. We speculate this is because the km s-1 cloud is located behind the SNR, and the maser emission travels through a longer path length of turbulent gas before reaching the observer. At other locations across the SNR the masers probably arise at the near side of the SNR with less material between the maser and the observer, and therefore show a much lower level of variability. Similarly low variability levels are found for the CND masers consistent with the CND being located in front of Sgr A East. The low variability of the CND maser agrees with a scenario where the pumping is provided by relatively large clumps (sizes AU).
References
- Becklin et al. (1982) Becklin, E. E., Gatley, I., & Werner, M. W. 1982, ApJ, 263, 624
- Brand et al. (2003) Brand, J., Cesaroni, R., Comoretto, G., Felli, M., Palagi, F., Palla, F. & Valdettaro, R. 2003, A&A, 407, 573
- Caswell (2004) Caswell, J. L. 2004, MNRAS, 349, 99
- Christopher et al. (2005) Christopher, M. H., Scoville, N. Z., Stolovy, S. R., & Yun, M. S. 2005, ApJ, 622, 346
- Claussen et al. (1996) Claussen, M. J., Wilking, B. A., Benson, P. J., Wootten, A., Myers, P. C. & Terebey, S. 1996, ApJS, 106, 111
- Clegg & Cordes (1991) Clegg, A. W. & Cordes, J. M. 1991, ApJ, 374, 150
- Coil & Ho (1999) Coil, A. L., & Ho, P. T. P. 1999, ApJ, 513, 752
- Coil & Ho (2000) Coil, A. L., & Ho, P. T. P. 2000, ApJ, 533, 245
- Comoretto et al. (1990) Comoretto, G. et al. 1990, A&AS, 84, 179
- Cordes & Rickett (1998) Cordes, J. M. & Rickett, B. J. 1998, ApJ, 507, 846
- Elitzur (1976) Elitzur, M. 1976, ApJ, 203, 124
- Elitzur et al. (1989) Elitzur, M., Hollenbach, D. J. & McKee, C. F. 1991, ApJ, 346, 983
- Etoka & Le Squeren (2000) Etoka, S., & Le Squeren, A. M. 2000, A&AS, 146, 179
- Felli et al. (1992) Felli, M., Palagi, F. & Tofani, G. 1992, A&A, 255, 293
- Frail et al. (1994) Frail, D. A., Goss, W. M., & Slysh, V. I. 1994, ApJ, 424, L111
- Furuya et al. (2001) Furuya, R. S., Kitamura, Y., Wootten, H. A., Claussen, M. J. & Kawabe, R. 2001, ApJ, 559, L143
- Furuya et al. (2003) Furuya, R. S., Kitamura, Y., Wootten, H. A., Claussen, M. J. & Kawabe, R. 2003, ApJS, 144, 71
- Goedhart et al. (2004) Goedhart, S., Gaylard, M. J., & van der Walt, D. J. 2004, MNRAS, 355, 553
- Gray et al. (1991) Gray, M. D., Doel, R. C., & Field, D. 1991, MNRAS, 252, 30
- Gray et al. (1992) Gray, M. D., Field, D., & Doel, R. C. 1992, A&A, 262, 555
- Green et al. (1997) Green, A. J., Frail, D. A., Goss, W. M., & Otrupcek, R. 1997, AJ, 114, 2058
- Gruber & de Jager (1976) Gruber, G. M. & de Jager, G. 1976, 50, 313
- Jackson et al. (1993) Jackson, J. M., Geis, N., Genzel, R., Harris, A. I., Madden, S., Poglitsch, A., Stacey, G. J., & Townes, C. H. 1993, ApJ, 402, 173
- Jewell et al. (1979) Jewell, P. R., Webber, J. C., Snyder, L. E., & Elitzur, M. 1979, ApJS, 41, 191
- Karlsson et al. (2003) Karlsson, R., Sjouwerman, L. O., Sandqvist, Aa., & Whiteoak, J. B. 2003, A&A, 403, 1011
- Latvakoski et al. (1999) Latvakoski, H. M., Stacey, G. J., Gull, G. E., & Hayward, T. L., 1999 ApJ, 511, 761
- Liljeström et al. (1989) Liljeström, T., Mattila, K., Toriseva, M. & Anttila, R. 1989, A&AS, 79, 19
- Lockett et al. (1999) Lockett, P., Gauthier, E., & Elitzur, M. 1999, ApJ, 511, L235
- MacLeod (1997) MacLeod, G. C. 1997, MNRAS, 285, 635
- Marr et al. (1993) Marr, J. M., Wright, M. C. H., & Backer, D. C. 1993, ApJ, 411, 667
- Mezger et al. (1989) Mezger, P. G., Zylka, R., Salter, C. J., Wink, J. E., Chini, R., Kreysa, E., & Tuffs, R. 1989, A&A, 209, 337
- Narayan (1992) Narayan, R. 1992, Proc. R. Soc. London A, 341, 151
- Niezurawska et al. (2004) Niezurawska, A., Szymczak, M., Cohen, R. J., & Richards, A. M. S. 2004, MNRAS, 350, 1409
- Offer & van Dishoeck (1992) Offer, A. R., & van Dishoeck, E. F. 1992, MNRAS, 257, 377
- Pavlakis & Kylafis (1996) Pavlakis, K. G., & Kylafis, N. D. 1996, ApJ, 467, 300
- Pihlström et al. (2001) Pihlström, Y. M., Conway, J. E., Booth, R. S., Diamond, P. J. & Polatidis, A. G. 2001, A&A, 377, 413
- Pihlström et al. (2008) Pihlström, Y. M., Fish, V. L., Sjouwerman, L. O., Zschaechner, L. K., Lockett, P. B., & Elitzur, M. 2008, ApJ, 676, 371
- Pihlström et al. (2011) Pihlström, Y. M., Sjouwerman, L. O., & Fish, V. L. 2011, ApJ, in press (EVLA special issue)
- Ramachandran et al. (2006) Ramachandran, R., Desphande, A. A., & Goss, W. M. 2006, ApJ, 653, 1314
- Rickard et al. (1975) Rickard, L. J., Palmer, P. & Zuckerman, B. 1975, ApJ, 200, 6
- Schwartz et al. (1974) Schwartz, P. R., Harvey, P. M. & Barrett, A. H. 1974, ApJ, 187, 491
- Sjouwerman & Pihlström (2008) Sjouwerman, L. O., & Pihlström, Y. M. 2008, ApJ, 681, 1287, Paper I
- Sjouwerman et al. (1998) Sjouwerman, L. O., van Langevelde, H. J., Winnberg, A., & Habing, H. J. 1998, A&AS, 128, 35
- Sjouwerman et al. (2010) Sjouwerman, L. O., Pihlström, Y. M., & Fish, V. L. 2010, ApJ, 710, L111
- Stetson (1996) Stetson, P. B. 1996, PASP, 108, 851
- Szymczak & Gérard (2004) Szymczak, M., & Gérard, E. 2004, A&A, 414, 235
- Wardle (1999) Wardle, M. 1999, ApJ, L101
- Wittkowski et al. (2007) Wittkowski, M., Boboltz, D. A., Ohnaka, K., Driebe, T. & Scholz, 2007, M. 2007, A&A, 470, 191
- Wouterloot et al. (1995) Wouterloot, J. G. A., Fiegle, K., Brand, J. & Winnewisser, G. 1995, A&A301, 236
- Wright et al. (2001) Wright, M. C. H., Coil, A. L., McGary, R. S., Ho, Paul T. P. & Harris, A. I. 2001, ApJ551, 254
- Yusef-Zadeh (2004) Yusef-Zadeh, F. 2004, in the proceedings of the Sgr A* at 30 workshop, http://www.aoc.nrao.edu/gcnews/GCconf/SgrAstar30
- Yusef-Zadeh et al. (2001) Yusef-Zadeh, F., Stolovy, S. R., Burton, M., Wardle, M., & Ashley, M. C. B. 2001, ApJ, 560, 7490
- Yusef-Zadeh et al. (1996) Yusef-Zadeh, F., Roberts, D. A., Goss, W. M., Frail, D. A., & Green, A. J. 1996, ApJ, 466, L25
- Zuckerman et al. (1972) Zuckerman, B., Yen, J. L., Gottlieb, C. A. & Palmer, P. 1972. ApJ, 177, 59