First-principles calculations of 17O NMR chemical
shielding
in Pb(Zr1/2Ti1/2)O3 and
Pb(Mg1/3Nb2/3)O3: linear dependence on
transition-metal/oxygen bond lengths
Abstract
First-principles density functional theory (DFT) oxygen chemical shift tensors were calculated for A(B,B′)O3 perovskite alloys Pb(Zr1/2Ti1/2)O3 (PZT) and Pb(Mg1/3Nb2/3)O3 (PMN). Quantum chemistry methods for embedded clusters and the GIPAW method [C. J. Pickard and F. Mauri, Phys. Rev. B 63 245101 (2001)] for periodic boundary conditions were used. Results from both methods are in good agreement for PZT and prototypical perovskites. PMN results were obtained using only GIPAW. Both isotropic and axial chemical shifts were found to vary approximately linearly as a function of the nearest-distance transition-metal/oxygen bond length, . Using these results, we argue against Ti clustering in PZT, as conjectured from recent 17O NMR magic-angle-spinning measurements. Our findings indicate that 17O NMR measurements, coupled with first-principles calculations, can be an important probe of local structure in complex perovskite solid solutions.
pacs:
76.60.Cq 77.84.-sI Introduction
High performance solid solution ferroelectrics, based on the ideal ABO3 perovskite structure, are widely used in technological applications such as ultrasonic transducers, sensors, actuators, and thin film applications. 2005-RMP-FE-thinfilms ; Ref:Scott_appl The strong electromechanical coupling in these materials is related to a balance of competing instabilities, such as cation off-centerings and oxygen octahedral rotations. The perovskite structure offers many ways to fine tune these interactions through chemical substitutions, such as alloying on the A and/or B sites, and through epitaxial control in layered and thin film geometries. 2005-RMP-FE-thinfilms
Solid state nuclear magnetic resonance (NMR) has increasingly been used to study the local structure and dynamics of these complex perovskites. ref:ZhouHoatsonVold-Pb ; ref:Baldwin05 ; ref:VijayakumarHoatsonVold-PMN ; ref:BT-ST-O_Blinc NMR spectra of a target nucleus are largely determined by the coupling of its magnetic dipole and electric quadrupole moments with the local magnetic field and electric field gradient, respectively. The interpretation of NMR spectra in complex solid solution perovskites is complicated by the presence of broad spectral features due to disorder. First-principles calculations of electric field gradient ref:mao014105 and chemical shielding ref:pechkis1 tensors can play an important role interpreting NMR spectra in these materials.
Previously we demonstrated a near linear dependence of the chemical shielding tensor on the oxygen nearest neighbor B-O bond distance for the prototypical perovskites BaTiO3 (BT), SrTiO3 (ST), PbTiO3 (PT), and PbZrO3 (PZ). ref:pechkis1 The linear dependence was shown to arise from large paramagnetic contributions to and principal values (our convention identifies the “” principal axis as that most nearly parallel to the B-O-B bond direction), due to virtual transitions between O(2p) and unoccupied B(d) states. This linear variation is confirmed here for two complex perovskite solid solutions, PZT and PMN.
First-principles chemical shielding calculations have traditionally been done with the embedded cluster approach, using standard quantum chemistry methods Gaussian98Abbrev ; Gaussian03Abbrev ; Gaussian09Abbrev with gaussian type orbitals (GTO). More recently, the planewave based GIPAW method with PBC has provided an alternative approach. Relatively few calculations for transition metal oxides have been reported using either technique. Here we use complementary calculations with both methods to cross validate convergence with respect to cluster size and termination effects, basis sets, and the accuracy of pseudopotentials (PSPs).
Quantum-chemistry methods can calculate chemical shielding tensors for embedded clusters, using a range of approximations, from Hartree Fock and density functional theory (DFT) with semilocal or hybrid exchange-correlation functionals, to explicitly correlated methods such Moller-Plesset perturbation theory and coupled cluster approaches. 1999-Helgaker ; 2004-bookkaupp ; 2007-Vaara The principal difficulties with the embedded cluster approach are controlling size and basis set convergence. Size effects can be monitored by studying increasingly larger clusters. Long-range electrostatic interactions can be handled by embedding the cluster in large arrays of point charges and eliminating depolarizing fields, as described in LABEL:ref:pechkis1. Achieving the basis set limit can be problematic in some cases, because atom-centered GTO’s do not form a complete orthogonal basis. Nevertheless, basis set convergence is generally well controlled through the use of standardized GTO basis sets. EMSL_BasisSets2007 The cluster approach becomes inefficient, however, for complex systems, because separate cluster calculations are usually required for each inequivalent target atom.
GIPAW calculations are naturally adapted to ordered crystalline solids, since size convergence is effectively achieved by using primitive unit cells with well-converged -point quadrature grids for Brillouin zone integrations. Disordered solids can be treated using supercells. Planewaves form a complete basis, so convergence to the basis set limit is straightforward. The method applies the projector-augmented-wave (PAW) reconstruction ref:PAWrecon to a conventional PSP calculation to obtain all-electron valence wave functions, which are required for accurate calculations of the chemical shielding. There are two principle issues with the GIPAW method. GIPAW PSPs are more difficult to construct than standard norm-conserving PSPs. To achieve good transferability, they may require multiple partial wave channels and large planewave cutoff energies for some target atoms. The construction of the PAW atomic-like augmentation basis also requires care. To date, GIPAW calculations have been carried out for only a limited number of transition metal oxide systems.ref:V-NMR-CASTEP ; ref:Middlemiss2010
PZT is a homovalent mixture of Ti4+ and Zr4+ transition metal cations, while PMN is a heterovalent 2:1 mixture of the Nb5+ transition metal cation and the Mg2+ alkaline earth cation. Both embedded cluster and GIPAW calculations were carried out for PZT, while PMN results were obtained only with the GIPAW method, using PBC. First-principles relaxed structural models were used to simulate PZT and PMN structures.
The remainder of the paper is organized as follows. The theoretical approaches are described in Sec. II. Results and discussion are presented in Secs. III and IV, respectively. We summarize and conclude in Sec. V.
| reference state | rc(au) | reference energies (Ry) | core correction radius (au) | |
|---|---|---|---|---|
| O | 2s2,2p6,3d,3s,3p | 1.2,1.2,1.5 | *,*,0.10,0.10,0.10 | 0.34 |
| Ti | 3s2,3p6,3d0,4s,4p,4d | 0.9,0.9,0.9 | *,*,*,-2.73,0.50,0.10 | 0.53 |
| Pb | 6s2,6p0,5d10,7s,7p,6d | 2.0,2.4,1.0 | *,*,*,-1.00,-0.20,-1.80 | 0.89 |
| Zr | 4s2,4p6,4d0,5s,5p,5d | 1.0,1.2,1.4 | *,*,*,-2.45,-2.00,-1.37 | 0.80 |
| Sr | 4s2,4p6,4d0,5s,5p | 1.2,1.3,1.7 | *,*,-1.00,-0.72 | 0.88 |
| Ba | 5s2,5p6,5d,6s,6p | 1.5,1.7,2.0 | *,*,-0.95,-0.90,-1.50 | 1.19 |
| Mg | 2s2,2p6,3d,3s,3p | 0.6,0.6,1.5 | *,*,0.3,-1.3,0.1 | 0.30 |
| Nb | 4s2,4p6,4d0,5s,5p,5d | 1.0,1.1,1.3 | *,*,*,-3.30,-2.70,-1.27 | 0.80 |
| K | 3s2,3p6,3d0,4s,4p | 1.4,1.5,1.5 | *,*,*,-1.50,-0.80 | 0.50 |
II Theoretical Methods
The chemical shielding tensor determines the total magnetic field at an atomic nucleus,
| (1) |
where is the external field. For the systems considered here, is calculated using embedded cluster and GIPAW-PBC methods. The symmetric Asymm-sigma1968 ; Asymm-sigma1991 tensor is determined by its principal axis components, with isotropic and anisotropic parts, conventionally defined as baugher1969
| (2) |
As mentioned, our convention for the perovskite structure identifies the “” principal axis as that most nearly parallel to the B-O-B bond direction. NMR measurements of are usually reported with respect to a reference material, where the chemical shift tensor is defined as 2004-bookkaupp
| (3) |
with corresponding definitions to those in Eq. 2. The experimental reference for oxygen is liquid H2O.
The theoretical oxygen reference value is determined from a linear regression of versus . ref:Charpentier ; ref:Middlemiss2010 This yields the relation
| (4) |
Rather than regarding the slope as an independent fitting parameter, we set , which leaves as the only independent parameter. Allowing to vary yields fits of similar overall quality, but somewhat distorts chemical shift differences between inequivalent oxygen sites within the same material. Constraining allows better cancellation of errors, due to systematic effects such as the choice of methodological approach or DFT exchange-correlation functional.
II.1 Embedded cluster calculations
A detailed discussion of this approach is given in Ref. ref:pechkis1, . We briefly summarize some of the key features of this method. With central O atoms, embedded clusters consisted of either 21“quantum” (QM) atoms, (A4B2O15)14-, or 65 QM atoms, (A4B10O51)51-. In these clusters, all cation atoms are fully coordinated with QM O atoms. The QM clusters are further surrounded by a large array of point charges, which reproduce the Madelung potential in the QM region. ref:ewald To alleviate artificial polarization of boundary O(2p) states, the nearest-neighbor (nn) and the next-nearest-neighbor cation point charges of boundary O atoms are replaced by “empty” PSPs (ePSPs). ref:pechkis1 ; ref:TIPs Finally, in non-centrosymmetric clusters, depolarizing electric fields are removed by applying an external electric field. ref:pechkis1
Calculations were performed with the GAUSSIAN computational package, Gaussian98Abbrev ; Gaussian09Abbrev and the chemical shielding tensor was determined using the continuous set of gauge transformations (CSGT) method. ref:CSGT ; cheeseman Calculations were done using the DFT hybrid B3LYP B3LYP , as well as generalized gradient approximations (GGA), using the PW91 ref:PW91 and PBE ref:pbe forms. Douglas-Kroll-Hess 2nd order scalar-relativistic calculations were performed on selected systems. Atom-centered GTO basis functions were associated with all the QM atoms. All-electron treatments were used for the O and Ti atoms, while the other QM atoms were represented using scalar-relativistic small core (scalar-RSC) PSPs [also called effective core potentials (ECPs)]. The well-converged GTO basis sets and ECPs used for these calculations are described in LABEL:ref:pechkis1 and were taken from the EMSL website. EMSL_BasisSets2007
II.2 GIPAW calculations
Calculations with PBC used the GIPAW functionality of the QuantumESPRESSO (QE) code.ref:QE These calculations are done in two steps. A standard ground state norm-conserving PSP calculation is first performed. This is followed by a linear response calculation in the presence of an external magnetic field. The linear response calculation uses all-electron like valence wave functions, which are represented by planewaves, modified near the nuclei by atomic-like PAW augmentation basis functions. The PAW basis functions are constructed when the PSP is generated, as further discussed below. Calculations reported below used well converged Monkhorst-Packref:MP Brillouin zone -point sampling, e.g. 666 for the prototypical perovskites ST, BT, and PT. Unless otherwise specified, the PBE GGA functional was used in all QE calculations.
All PSPs were constructed using the “ld1” PSP generation code (distributed with QE). All norm-conserving PSPs were scalar-relativistic Troullier-Martinsref:TM type. Table 1 shows the construction parameters used for all PSPs employed in this paper. The local channel is indicated by boldface type. States that are in italics were generated using a Hamann typeref:Hamann reference state. The ’s correspond to the , , and channels respectively. The next column shows the PSP reference energies for the , , and channels. The symbol ‘*’ indicates that the corresponding all-electron eigenvalue was used for this state. It should be noted that these parameters are for the PSP projectors used in the ground state self-consistent total-energy calculations. Parallel to the PSP construction, a second atomic calculation is performed to generate the required GIPAW augmentation basis functions, consisting of all-electron and pseudo partial wave radial functions. The number of GIPAW angular momentum channels was the same as for the PSPs. For all except Pb, O and K, the augmentation basis functions were generated using the corresponding all-electron eigenvalues (n.b., the Ti4+ 4 state is bound, for example), rather than the values in Table 1. For Pb, O and K, the values in Table 1 were used, except for the Pb 7, which used the all-electron eigenvalue. The final column shows the non-linear core-correction radius for each potential. A conservative 350 Ry energy cutoff was used. This could have been reduced by using larger rc’s for the metal PSPs. The 350 Ry energy cutoff, while high, was easily tractable for all systems studied in this paper. This cutoff yields chemical shieldings to within about 1 ppm, as indicated by test calculations with other settings.
| TiO2 (molecule) | ||||
| Gaussian | -1803 | -801 | 148 | -819 |
| GIPAW | -1826 | -811 | 146 | -830 |
| TiO2 (rutile) | ||||
| C-99 | -499 | -380 | -306 | -395 |
| GIPAW | -483 | -380 | -296 | -386 |
| SrTiO3 (cubic) | ||||
| C-21 | -353 | -353 | 46 | -220 |
| C-65 | -403 | -403 | 27 | -260 |
| GIPAW | -429 | -429 | 7 | -284 / -287111Ref. ref:Middlemiss2010, determined using the experimental structure |
| BaTiO3 (cubic) | ||||
| C-21 | -414 | -414 | 49 | -260 |
| C-65 | -483 | -483 | 22 | -315 |
| GIPAW | -529 | -529 | -31 | -363 / -379222Ref. ref:Middlemiss2010, determined using the relaxed structure |
| PbTiO3-axial O (P4mm) | ||||
| C-21 | -562 | -562 | 123 | -334 |
| C-65 | -599 | -599 | 67 | -377 |
| GIPAW | -630 | -630 | 77 | -394 |
| PbTiO3-equatorial O (P4mm) | ||||
| C-21 | -286 | -228 | -32 | -182 |
| C-65 | -365 | -277 | -35 | -226 |
| GIPAW | -398 | -284 | -23 | -235 |
| Expt111ST and BT experimental chemical shift values are from Ref. ref:BT-ST-O_Blinc, and the PT and PZ experimental chemical shift values are from Ref. ref:Baldwin05, . | Cluster | PBC-GIPAW | |||||||
| B3LYP | PW91 | present 666Used determined from linear regression on the same systems as the 65 QM atom cluster-PW91 results (see text). | present | other | |||||
| 21 | 65 | 21 | 65 | ||||||
| ST (cubic) | 491 | 477 | 494 | 491 | 491 | 496 | 503 222Ref. ref:Middlemiss2010, determined using the experimental structure | ||
| BT (cubic) | 536 | 537 | 534 | 547 | 570 | 575 | 595 333Ref. ref:Middlemiss2010, determined using the relaxed structure | ||
| BT (P4mm) | |||||||||
| Oax | 591 | 571 | 579 | 573 444The 17O experimental chemical shielding reference is liquid water, ppm ref:wasylishen / 611 555Max Dev = max(abs()) | |||||
| Oeq | 515 | 516 | 535 | 563 444The 17O experimental chemical shielding reference is liquid water, ppm ref:wasylishen / 531 555Max Dev = max(abs()) | |||||
| (Oax – Oeq) | 50 | 76 | 56 | 44 | 10 / 80 | ||||
| PT (P4mm) | |||||||||
| Oax | 644 | 644 | 608 | 609 | 601 | 606 | |||
| Oeq | 449 | 445 | 457 | 455 | 442 | 447 | |||
| (Oax – Oeq) | 204 | 195 | 199 | 152 | 154 | 159 | 159 | ||
| PZ (Pbam) | |||||||||
| O1-4g | 357 | 367 | 355 | ||||||
| O1′-4g | 346 | 356 | 336 | ||||||
| O2-8i | 355 | 364 | 349 | ||||||
| O3-4f | 324 | 336 | 309 | ||||||
| O4-4e | 392 | 399 | 415 | ||||||
| (O4 – O1) | 43 | 35 | 31 | 60 | |||||
| (O4 – O1′) | 57 | 47 | 43 | 79 | |||||
| O4 – O2) | 52 | 38 | 35 | 66 | |||||
| (O4 – O3) | 79 | 68 | 63 | 105 | |||||
| 288 555Max Dev = max(abs()) | 293 | 238 | 275 | 217 | 207 | 212 | 216 | ||
| RMS error | 12 | 7 | 16 | 23 | 28 | 20 | 26 | ||
| Max Dev 666Used determined from linear regression on the same systems as the 65 QM atom cluster-PW91 results (see text). | 24 | 10 | 39 | 38 | 46 | 41 | |||
.
II.3 Comparison of methods
Table 2 shows the comparison between the GIPAW and cluster approach for the TiO2 molecule, the rutile crystalline solid, as well as some results for prototypical perovskites. Where available, published GIPAW results from LABEL:ref:Middlemiss2010 are also given for comparison.
TiO2 molecule calculations were for a Ti-O bond length of 1.651 Å and a O-Ti-O angle of 114.2∘. With PBC-GIPAW, a 222428 Bohr supercell was used. The Gaussian calculation was for the isolated molecule and used a basis set of cc-pwCVQZ-DK and IGLO-III for Ti and O, respectively. The experimental rutile structure was used for solid TiO2.ref:TiO2_rutile_lattice The PBC-GIPAW calculation used a k -point sampling of 446. The cluster method used a O77Ti22 QM cluster with cc-pwCVTZ-DK and 6-311G(2d,p) basis sets for the inner 3 and outer 19 Ti atoms, respectively; IGLO-III and IGLO-II basis sets were used for the inner 15 and outer 52 O atoms, respectively. (Embedding with ePSPs and point charges was done as described above.)
Calculations for the prototypical perovskites in Table 2 used the experimental structures as described in LABEL:ref:pechkis1. PBC-GIPAW used a k -point sampling of 666. Embedded clusters were constructed as above (Section II.1), and results are given for 21 and 65 QM atom clusters. The 21 QM atom cluster results are from non-relativistic calculations using the PW91 DFT functional. The 65 QM atom clusters are from scalar relativistic PBE calculations. Differences between PW91 and PBE (not shown in the Table) and relativistic effects are small, as expected. Tests on the 65 QM atom ST cluster show that non-relativistic PBE produced and values that are 6 and 1.5 ppm more positive, respectively, than PW91. Adding scalar-relativistic effects changed and by +12 and +3 ppm, respectively, independent of the GGA functional. These effects are negligible for the corresponding chemical shifts, as expected, due to cancellation of errors.
The ST and PT 65 QM atom relativistic PBE and are in good agreement with PBC values, differing at most by 33 and 20 ppm respectively. Isotropic values for both systems are within 24 ppm of PBC-GIPAW. A larger discrepancy is seen in BT, where the cluster values are rigidly shifted by about +50 ppm. Size effects between the 21 and 65 QM atom results are evident in the table. The 21 QM atom values are more shielded [i.e., more positive (see Eq. (1))] than either the 65 QM atom values or the PBC methods. Rigidly shifting all 21 QM atom brings these into better agreement, indicating good cancellation of errors. This is evident in the chemical shifts shown in Table 3 in the next section, where 21 and 65 QM atom clusters are seen to give nearly identical chemicals shifts.
These results demonstrate that the embedded cluster and PBC-GIPAW approaches produce comparable agreement with measured isotropic chemical shifts, regardless of cluster size and methodology. Differences due to cluster size, DFT functionals, relativistic effects, and PSPs largely cancel in the chemical shifts, i.e., they are absorbed in the constant chemical shielding reference value .
| Cluster | GIPAW | Cluster | GIPAW | Cluster | GIPAW | ||||||
| B3LYP | GGA | GGA | B3LYP | GGA | GGA | B3LYP | GGA | GGA | |||
| ST (cubic) | 491 [-3] | 494 (-2) | 496 | -144 [-11] | -133 (12) | -145 | – | – | – | ||
| BT (cubic) | 536 [2] | 534 (-41) | 575 | -170 [-16] | -154 (12) | -166 | – | – | – | ||
| BT (P4mm) | |||||||||||
| Oax (Ti-O–Ti) | 591 [20] | 571 (-8) | 579 | -207 [-24] | -183 (3) | -186 | – | – | – | ||
| Oeq (Ti–O–Ti) | 515 [-1] | 516 (-19) | 535 | -155 [-14] | -140 (7) | -147 | -24 [2] | -26 (15) | -41 | ||
| PT (P4mm) | |||||||||||
| Oax (Ti-O–Ti) | 644 [35] | 608 (2) | 606 | -257 [-29] | -228 (8) | -236 | – | – | – | ||
| Oeq (Ti–O–Ti) | 449 [-8] | 457 (10) | 447 | -85 [-10] | -75 (31) | -106 | -22 [7] | -29 (28) | -57 | ||
| PZ(Pbam) | |||||||||||
| O1-4g (Z–O–Z) | 357 [-10] | 367 (12) | 355 | -75 [-5] | -70 (20) | -90 | -33 [1] | -34 (12) | -46 | ||
| O1’-4g (Z–O–Z) | 346 [-10] | 356 (20) | 336 | -65 [-4] | -61 (21) | -81 | -14 [2] | -16 (11) | -27 | ||
| O2-8i (Z-O–Z) | 355 [-9] | 364 (16) | 349 | -81 [-4] | -77 (14) | -91 | -4 [1] | -5 (2) | -7 | ||
| O3-4f (Z–O–Z) | 324 [-11] | 336 (26) | 309 | -47 [-4] | -43 (9) | -52 | -15 [-1] | -14 (3) | -17 | ||
| O4-4e (Z–O–Z) | 392 [-6] | 399 (-16) | 415 | -137 [-7] | -130 (36) | -166 | -14 [1] | -15 (11) | -26 | ||
| PZT (P4mm) | |||||||||||
| O1(Zr–O–Zr) | 352 [-9] | 361 (33) | 328 | -72 [-6] | -66 (20) | -85 | -16 [-4] | -12 (-4) | -8 | ||
| O2(Zr-O–Ti) | 398 [7] | 391111This cluster-GGA calculation used a smaller Pb cc-pVDZ basis, rather than cc-pVTZ, due to convergence difficulty with the larger basis. (-19) | 410 | -126 [-8] | -118 (17) | -135 | – | – | – | ||
| O3(Ti–O–Ti) | 418 [-18] | 436 (9) | 427 | -76 [-11] | -65 (21) | -86 | -59 [4] | -63 (38) | -101 | ||
| O4 (Ti-O–Zr) | 679 [40] | 639 (13) | 626 | -266 [-34] | -232 (14) | -246 | – | – | – | ||
| PZT (P2mm) | |||||||||||
| O1(Zr–O–Zr) | 358 [-9] | 367 (19) | 348 | -80 [-6] | -74 (22) | -96 | -36 [2] | -38 (20) | -59 | ||
| O2(Zr-O–Zr) | 401 [-4] | 405 (-1) | 407 | -124 [-6] | -118 (18) | -137 | -34 [2] | -36 (9) | -44 | ||
| O3(Ti–O–Ti) | 408 [-11] | 419 (24) | 395 | -65 [-8] | -57 (17) | -74 | -6 [5] | -1 (26) | -27 | ||
| O4(Ti-O–Ti) | 668 [39] | 629 (12) | 617 | -264 [-32] | -232 (6) | -238 | -49 [3] | -46 (8) | -54 | ||
| O5(Ti-O–Zr) | 400 [-6] | 406 (21) | 385 | -81 [-9] | -72 (20) | -92 | -29 [-3] | -32 (22) | -55 | ||
| PZT (R3m) | |||||||||||
| O1(Zr-O–Ti) | 394 [-7] | 401 (0) | 401 | -90 [-6] | -84 (23) | -107 | -3 [1] | -2 (1) | -3 | ||
| O2(Ti-O–Zr) | 466 [-1] | 467 (11) | 456 | -127 [-13] | -114 (21) | -135 | -2 [1] | -1 (-1) | -1 | ||
III Results
In this section, we first describe the calculation of the theoretical oxygen chemical shielding reference [Eq. (4)]. As mentioned, this is done using linear regression of the calculated chemical shieldings with the corresponding measured chemical shifts, where available. ref:Charpentier ; ref:Middlemiss2010 We next present calculated 17O chemical shifts for two perovskite-based B-site alloys, PZT and PMN, using the derived values of .
III.1 Determination of the theoretical 17O chemical shielding reference
A linear regression was separately evaluated for the PBC and embedded cluster calculations. ref:Charpentier ; ref:Middlemiss2010 Additionally for the clusters, separate regressions were performed for different cluster sizes and DFT functionals. Table 3 shows derived values for each case, along with the rms error and maximum deviation in the isotropic chemical shifts. The table compares the resulting calculated isotropic chemical shifts to the measured values. As in LABEL:ref:pechkis1, experimental structures were used for all systems except PZ. For PZ, experimental lattice parameters from neutron scattering measurements were used together with internal coordinates determined from first-principles calculations. ref:Johannes
Calculated cluster results (21 an 65 QM atoms) with B3LYP and PW91 exchange-correlation are shown together with GIPAW-PBC with PBE exchange-correlation. The last column shows other GIPAW results, where available. For the 65 QM clusters, is derived from a more limited set of calculations, as shown in the Table. For comparison, the effect of this to be only a few ppm. B3LYP results are seen to give slightly better agreement with experiment. Using the same exchange-correlation treatment, both the 21 and 65 atom QM clusters are seen to give nearly identical chemicals shifts. The values of in Table 3 are used below to determine the theoretical chemical shifts for PZT and PMN in Tables 4 and 5. Given the small difference between the PW91 and PBE GGA functionals and cancellation effects in chemical shifts, both PW91 and PBE are labeled as GGA in all further results below.
III.2 Results for Pb(Zr1-xTix)O3 (PZT) and Pb(Mg1/3Nb2/3)O3 (PMN)
PZT is a homovalent mixture of Ti4+ and Zr4+ transition metal cations, while Pb(Mg1/3Nb2/3)O3 (PMN) is a heterovalent 2:1 mixture of the Nb5+ transition metal cation and the Mg2+ alkaline earth cation. Both embedded cluster and GIPAW calculations were carried out for PZT, while PMN results were obtained only with the GIPAW method, using PBC.
Disordered PZT 50/50 was modeled using first-principles relaxed structures ref:mao014105 with different imposed B-site ordering and symmetry: i) [001] ordering parallel to the ferroelectric polarization, with tetragonal P4mm symmetry (a a 2c; c/a = 1.045); ii) [001] ordering perpendicular to the [100] ferroelectric polarization, with orthorhombic P2mm symmetry (a′ a 2a; a′/a = 1.04); iii) [111] ordering (rocksalt B sublattice) parallel to the ferroelectric polarization, with R3m symmetry. Theoretical PZT isotropic, axial, and anisotropic chemical shifts are summarized in Table 4. [As mentioned, the axial and anisotropic components in Eq. (2) were calculated using the convention that the “” principal axis is that most nearly parallel to the B-O-B bond direction of the target O atom.] For comparison, results for ST, BT, PT and PZ are reproduced from Table 3. For each inequivalent target O atom in the above structural models, the corresponding 21 QM atom embedded cluster was used to calculate the chemical shielding tensor with both B3LYP and GGA exchange-correlation. Results from PBC-GIPAW with GGA exchange-correlation are also shown. Chemical shifts were determined using the corresponding values of in Table 3. The GGA 21 QM atom embedded cluster and PBC-GIPAW RMS errors differ by 4 ppm. As seen in Tables 3, the 21 QM atom embedded cluster chemical shifts are also in excellent agreement with those from the larger 65 QM atom cluster.
PMN PBC-GIPAW calculations were based on a low symmetry (3 2 2) 60-atom perovskite supercell structure with relaxed internal coordinates, ref:PMN with B-site cations arranged according to the random-site model. randomsite X-ray patterns of well-annealed PMN samples indicate a homogeneous average structure, which exhibits rocksalt-like 1:1 B-site ordering, which is well described by the random-site model. Locally, the random-site model corresponds to B-site [111] planes, alternating between pure Nb and mixed Nb/Mg layers. Thus there are twice as many Nb-O-Mg as Nb-O-Nb O-sites in the 60-atom supercell, since the Mg atoms all reside in the mixed [111] planes. Similarly, there are no Mg-O-Mg O-sites. Unlike earlier models, the random-site model satisfies charge neutrality locally. The previously accepted space-charge model was based on the apparent inability to fully anneal samples. randomsite The 60-atom perovskite supercell structure, ref:PMN used in the present calculations, is consistent with the random-site model. Grinberg et al. ref:PMN found good agreement between this relaxed 60-atom supercell structure and pair distribution functions (PDFs) obtained by neutron scattering experiments. PMN_PDF_1998 This indicates that this structural model reasonably represents the local structure in PMN. Calculations for PMN were done only with PBC-GIPAW, and the results are shown in Table 5.
IV Discussion
As previously noted in LABEL:ref:pechkis1, there is a large anisotropy between the and principal values in Table 2. The principal values are large and negative (deshielded), while values tend to be considerably smaller and positive (shielded). (As mentioned, the “” principal axis is identified as that most closely aligned with the B-O-B bond direction of the target O atom.) The present calculations show that this anisotropy is also found in PZT and PMN and is reflected in the large values (Eq. 2) in Tables 4 and 5.
As shown in LABEL:ref:pechkis1 for prototypical perovskites, the large values are due to paramagnetic contributions to from virtual transitions between O(2p) and unoccupied B(d) states. The p-d hybridization contributes predominantly to , due to O atoms having only two nearest neighbors in perovskites, with linearly arranged B-O-B structural units. As the B-O-B bond distances vary, large variations in the chemical shielding can occur, resulting in a strong dependence on . We find a similar dependence for the PZT and PMN alloy systems.
IV.1 PZT
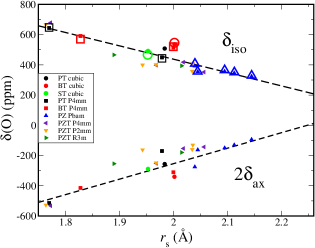
Figure 1 plots PZT isotropic and axial chemical shifts as a function of , the shortest B-O bond length of the targeted O atom. The B3LYP 21 QM atom cluster results from Table 4 are plotted. For comparison, results for ST, BT, PT, and PZ and from experiment are also shown. ref:pechkis1 The dashed straight lines are the linear fits to the calculated results for these prototypical perovskites, taken from LABEL:ref:pechkis1. A plot of PBC-GIPAW results from Table 4 (not shown) is very similar, which is consistent with the generally good agreement of the chemical shift results in the Table between the two calculational approaches. A nearly linear dependence on (with slope ppm/Å) is seen in both and , across all the systems studied. The axial shift is plotted as (Eq. 2) to emphasize that the linear dependence is largely due to , while has a much weaker dependence on , as previously noted for the prototypical perovskites. ref:pechkis1 As seen in the figure, the calculated PZT 50/50 results follow the same trends as in LABEL:ref:pechkis1.
Pb(Zr1-xTix)O3 NMR 17O magic angle spinning (MAS) central peak spectra were presented by Baldwin et al. ref:Baldwin05 for a range of concentrations . Tabulated chemical shifts were given only for the endpoint PT and PZ compounds (reproduced here in Table 3), whose spectra consist of well-defined narrow peaks. MAS removes broadening due to chemical shift anisotropy in powder samples, but only partly averages second-order quadrupolar broadening. The narrow peaks in the endpoint PT and PZ compounds indicate that electric field gradients (EFGs) at the 17O nuclei are small. ref:Baldwin05 This is consistent with first-principles calculations of O EFGs. ref:Johannes ; ref:mao014105 Indeed, the 17O peak positions are within a few ppm of the experimental isotropic chemical shifts. ref:Baldwin05 There are two inequivalent O atoms in PT, two “equatorial” Oeq (which has two equidistant nn Ti atom) and one “axial” Oax atom (which has one short and one long Ti-O bond). A narrow peak at ppm has twice the (integrated) relative intensity of the peak at ppm, and these were assigned to the Oeq and Oax atoms, respectively. These are in good agreement with the calculated results in Table 3. The B3LYP calculation accurately reproduces this splitting, while GGA underestimates it by ppm. In PZ, there are five inequivalent O sites, which corresponds to five MAS peaks, centered near 350 ppm, within ppm. Measured and calculated values in Table 3 are in good agreement.
| Nb-O | B′-O | ||||
| Å | Å | ||||
| Nb-O-Mg | |||||
| 2.11 | 2.09 | 235 | -6 | -5 | |
| 2.11 | 2.09 | 235 | -7 | -2 | |
| 2.06 | 2.08 | 280 | -26 | -47 | |
| 2.07 | 2.09 | 277 | -22 | -43 | |
| Nb-O–Mg | |||||
| 1.89 | 2.06 | 419 | -109 | -27 | |
| 1.90 | 2.07 | 405 | -97 | -11 | |
| 1.90 | 2.09 | 390 | -110 | -25 | |
| 1.90 | 2.11 | 387 | -110 | -31 | |
| 1.91 | 2.11 | 390 | -111 | -83 | |
| 1.93 | 2.08 | 362 | -91 | -7 | |
| 1.93 | 2.09 | 368 | -94 | -10 | |
| 1.93 | 2.10 | 374 | -100 | -83 | |
| 1.94 | 2.13 | 369 | -75 | -36 | |
| 1.94 | 2.18 | 390 | -75 | -17 | |
| 1.95 | 2.11 | 362 | -81 | -11 | |
| 1.95 | 2.18 | 385 | -67 | -18 | |
| 1.96 | 2.05 | 346 | -78 | -29 | |
| 1.96 | 2.12 | 348 | -61 | -44 | |
| 1.97 | 2.05 | 338 | -71 | -36 | |
| 1.97 | 2.10 | 343 | -64 | -11 | |
| 1.97 | 2.13 | 327 | -53 | -13 | |
| 1.98 | 2.06 | 340 | -51 | -47 | |
| 1.99 | 2.13 | 316 | -43 | -7 | |
| 2.01 | 2.06 | 310 | -36 | -39 | |
| Nb-O–Nb | |||||
| 1.86 | 2.23 | 436 | -130 | -21 | |
| 1.87 | 2.14 | 421 | -130 | -3 | |
| 1.87 | 2.14 | 421 | -129 | -8 | |
| 1.87 | 2.23 | 437 | -130 | -18 | |
| 1.89 | 2.20 | 416 | -114 | -27 | |
| 1.90 | 2.20 | 414 | -110 | -24 | |
| 1.91 | 2.11 | 394 | -111 | -23 | |
| 1.91 | 2.11 | 392 | -108 | -18 | |
| 1.94 | 2.03 | 401 | -122 | -8 | |
| 1.95 | 2.01 | 399 | -122 | -11 | |
| Nb-O-Nb | |||||
| 2.06 | 2.09 | 347 | -62 | -9 | |
| 2.08 | 2.08 | 340 | -56 | -11 |
At intermediate Ti and Zr concentrations, the spectra in Fig. 3 of LABEL:ref:Baldwin05 show that only a few of the narrow endpoint peaks persist. As Zr is added to PT, the narrow ppm PT peak decreases quickly in intensity. It can no longer be observed in the sample. A broad feature, between about 350 and 450 ppm is fully developed near , with narrower embedded features at 370 and 430 ppm. This broad feature distribution of inequivalent O-sites in the disordered PZT solid solution samples. The 430 ppm feature, which is close to the PT Oeq 447 ppm peak, is observed to persist down to 25% Ti concentration. Baldwin et al. ref:Baldwin05 assign the 430 ppm feature to a site similar to that of the PT Oeq atom, i.e. a locally Ti-Oeq-Ti (undimerized) chain-like configuration. They further suggest that this peak could indicate Ti clustering on a spatial scale of at least two unit cells in PZT.
Our results suggest an alternative explanation for the persistence of the observed 430 ppm feature. Our calculations show similar chemical shifts for a range of B-O-B′ environments, with ranging between Å in all the PZT 50/50 structural models, as seen in Table 4 and Fig. 1. Thus Ti clustering need not be invoked to explain the persistence of the 430 ppm feature in the measured spectra.
The apparent disappearance, at intermediate concentrations, of the 647 ppm peak does, however, indicate a reduced occurrence of a PT-like Oax site with a short 1.77 Å Ti-O bond. We find such a site only in the relaxed P4mm and P2mm PZT 50/50 simulations. The P4mm and P2mm models have [100] type B-site ordering. The absence of the 647 ppm peak in the measurements indicates that local occurrences of [100] type B-site ordering are rare. Instead, the lack of the 647 ppm peak in our R3m PZT 50/50 simulations suggests that local rocksalt-like B-site ordering is more prevalent in disordered PZT. This conclusion is also supported by the R3m structural model having the lowest total energy of all the structural models by 23 mRy. ref:mao014105 Moreover, the calculated Ti EFG’s for 50/50 R3m were significantly smaller and in better agreement with measured values, than the other B-site orderings. ref:mao014105
Baldwin et al. ref:Baldwin05 also remark a narrow 287 ppm peak that appears in their sample. This peak is broader in and samples and is absent in PZ. These authors note that is the composition corresponding to the morphotropic phase boundary (MPB) and conjecture that the 287 ppm peak evidences a new oxygen environment in a distinct crystalline monoclinic phase, which has been suggested to bridge the MPB. ref:Baldwin05 They suggest that the new environment at is a Ti-O-Zr site, which becomes ordered in the crystallographic sense as the long-range order of the monoclinic phase is established. As indicated by Fig. 1, isotropic chemicals shifts near 287 ppm are associated with large Å. As most Zr-O bond lengths are larger than those of Ti-O in the PZ and PZT 50/50 structural models, the 287 ppm feature could also be attributed to Zr-O-Zr sites with bond lengths distributed near Å.
IV.2 PMN
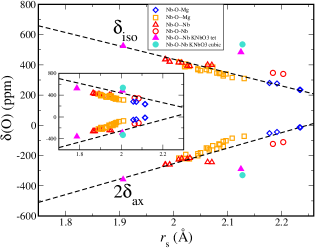
PMN, by contrast with PZT, is a heterovalent 2:1 mixture of the Nb5+ transition metal cation and the Mg2+ alkaline earth cation. Figure 2 plots Pb(Mg1/3Nb2/3)O3 (PMN) isotropic and axial chemical shifts (GIPAW results from Table 5) as a function of , the shortest B-O bond length of the targeted O atom. As plotted, the PMN values, have been increased by 0.12 Å for both and , as further discussed below. The unshifted values are plotted in the inset. The dashed lines are the same as that in Fig. 1. With the 0.12 Å rigid shift for all O-sites, the PMN chemical shifts are seen to follow the same linear trend as in the homovalent B-site systems in Fig. 1. For Nb-O-Mg coordinated O-atoms, is taken as the Nb-O bond length, since the hybridization mechanism does not apply to Mg, which has no low-lying unoccupied d-states. (As mentioned, the linear dependence is due to paramagnetic contributions to from virtual transitions between O(2p) and unoccupied B(d) states.) We are not aware of published NMR 17O spectra for PMN.
Although the linear dependence of and in Fig. 2 have the same slope as the homovalent B-site systems, a 0.12 Å offset is needed for the PMN values to fall on the same line. As mentioned, the linear dependence reflects variations in the magnitude of the paramagnetic O(2p)-Nb(4d) hybridization contributions to the principal values. This indicates that the effective is controlled by the spatial extent of the paramagnetic screening currents. The Nb5+ cation could be expected to modify the spatial extent of these currents, compared to the B4+ cations in the homovalent systems, due to the larger electrostatic attraction of the Nb5+ cation. The 0.12 Å offset in PMN renormalizes, in effect, the strength of the O(2p)-Nb(4d) hybridization. This observation would appear to indicate that for these systems the -dependence of is given by , where the slope is nearly the same for all transition-metal coordinated O atoms in perovskites, while the intercept depends on other factors, such as the ionic charge of the nearest neighbor cation. To further examine this, we performed GIPAW calculations for cubic and tetragonal KNbO3, ref:KNbO3structure which are also plotted in Fig. 2. While the tetragonal axial O values (short Nb-O ) are consistent with the linear trend, the KNbO3 tetragonal equatorial and cubic O results (two equidistant Nb-O bonds) show significant deviations. [Similar deviations occur in Fig. 1 for the tetragonal equatorial and cubic O BT results. We note that both K and Ba have larger crystalline ionic ShannonShannon1976 radii, 1.78 and 1.75 Å, respectively, than Sr or Pb, 1.58 and 1.63 Å, respectively.] Smaller deviations are also seen in the two largest values for the PMN oxygen atoms with two nearly equidistant Nb atoms, but for somewhat larger values of than in KNbO3. In the case of heterovalent B-site perovskites, the covalency of A-site atoms could also be important, as indicated by the smaller deviations, for long , in PMN compared to KNbO3. These observations warrant further investigation to clarify these issues.
PMN is an end-point of the solid-solution series PbTiO3Pb(Mg1/3Nb2/3)O3 (PMN-PT). In the 60-atom PMN structural model, there are no Nb-O bonds as small as the short Ti-Oax bond Å in PT, which is associated with its high degree of tetragonality (). This short bond corresponds to the large ppm, which is also seen in the P4mm and P2mm PZT structural models, both of which also show a high degree of tetragonality. The tetragonality of PMN-PT decreases as the Ti concentration is reduced from PT-rich compositions, and the average symmetry switches from tetragonal to rhombohedral at the morphotropic phase boundary (MPB) . The largest piezoelectric response is typically achieved at concentrations near the MPB. ref:Pa97 Polarization rotation has been proposed as the origin of the large piezoelectric response at the MPB, via intermediate monoclinic phases, ref:PZT-PhaseTrans ; ref:FC00 ; ref:Wu-Krakauer-03 where the tetragonality increases as the polarization rotates from [111] to [100] (pseudocubic) directions, with applied electric field along a pseudocubic axis. Increased tetragonality, compared to PT, has been seen in some other perovskite based solid solutions, such as some Bi based materials. tetragonality-PT-Bi-2005 ; tetragonality-PT-Bi The present calculations indicate that 17O NMR chemical shift measurements could be a useful probe in this regard, as increased tetragonality is accompanied by shortened transition-metal/oxygen bonds.
V Summary
First-principles oxygen NMR chemical shift tensors were calculated for PZT and PMN, which are representative, respectively, of homovalent and heterovalent perovskite-structure B-site alloys. Quantum chemistry methods for embedded clusters and the GIPAW method for periodic boundary conditions were used. Results from both methods are in good agreement for PZT and prototypical perovskites. PMN results were obtained using only GIPAW. Both isotropic and axial chemical shift components were found to vary approximately linearly as a function of the nearest-distance transition-metal/oxygen bond length, . Using these results, we argue against Ti clustering in PZT, as conjectured from recent 17O NMR measurements. Our findings indicate that 17O NMR measurements, coupled with first-principles calculations, can be an important probe of local structure in complex perovskite solid solutions.
VI Acknowledgments
This research was supported by Office of Naval Research grants N00014-08-1-1235 and N00014-09-1-0300. DLP acknowledges partial support from a Virginia Space Grant Consortium Graduate Research Fellowship. Support for computations was provided in part by National Science Foundation TeraGrid resources at the National Center for Supercomputing Applications (NCSA) under grant number TG-DMR100024. Additional computational resources were provided by the Center for Piezoelectric by Design. We acknowledge useful discussions with Gina Hoatson and Robert L. Vold.
References
- (1) M. Dawber, K. Rabe, and J. Scott Rev. Mod. Phys., vol. 77, no. 4, p. 1083, 2005.
- (2) J. Scott Science, vol. 315, p. 954, 2007.
- (3) D. H. Zhou, G. L. Hoatson, R. L. Vold, and F. Fayon Phys. Rev. B, vol. 69, p. 134104, 2004.
- (4) A. Baldwin, P. A. Thomas, and R. Dupree J. Phys.: Condens. Matter, vol. 17, p. 7159, 2005.
- (5) M. Vijayakumar, G. L. Hoatson, and R. L. Vold Phys. Rev. B, vol. 75, p. 104104, 2007.
- (6) R. Blinc, V. V. Laguta, B. Zalar, M. Itoh, and H. Krakauer J. Phys.: Condens. Matter, vol. 20, p. 085204, 2008.
- (7) D. Mao, E. J. Walter, H. Krakauer, and Z. Wu Phys. Rev. B, vol. 76, p. 014105, 2007.
- (8) D. L. Pechkis, E. J. Walter, and H. Krakauer J. Chem. Phys., vol. 131, no. 18, p. 184511, 2009.
- (9) M. J. Frisch, G. W. Trucks, H. B. Schlegel, and et al., “Gaussian 98, Revision A.11.4.” Gaussian, Inc., Pittsburgh PA, 2002.
- (10) M. J. Frisch, G. W. Trucks, H. B. Schlegel, and et al., “Gaussian 03, Revision C.02.” Gaussian, Inc., Wallingford, CT, 2004.
- (11) M. J. Frisch, G. W. Trucks, H. B. Schlegel, and et al., “Gaussian 09, Revision A.02,.” Gaussian, Wallingford CT, 2009.
- (12) T. Helgaker, M. Jaszunski, and K. Ruud Chem. Rev., vol. 99, no. 1, p. 293, 1999.
- (13) M. Kaupp, M. Bühl, and V. Malkin, Calculation of NMR and EPR Parameters: Theory and Applications. Wiley-VCH, Weinnheim, 2004.
- (14) J. Vaara Phys. Chem. Chem.l Phys., vol. 9, p. 5399, 2007.
- (15) K. L. Schuchardt, B. T. Didier, T. Elsethagen, L. Sun, V. Gurumoorthi, J. Chase, J. Li, and T. L. Windus, “Basis set exchange: A community database for computational sciences,” J. Chem. Inf. Model., vol. 47, no. 3, pp. 1045–1052, 2007.
- (16) C. G. V. de Walle and P. E. Blöchl Phys. Rev. B, vol. 47, p. 4244, 1993.
- (17) L. Truflandier, M. Paris, and F. Boucher Phys. Rev. B, vol. 76, p. 035102, 2007.
- (18) D. S. Middlemiss, F. Blanc, C. J. Pickard, and C. P. Grey J. Magn. Reson., vol. 204, p. 1, 2010.
- (19) R. F. Schneider J. Chem. Phys., vol. 48, p. 4905, 1968.
- (20) F. Anet and D. J. O’Leary Concepts in Magn. Reson, vol. 3, p. 193, 1991.
- (21) J. F. Baugher, P. C. Taylor, T. Oja, and P. J. Bray J. Chem. Phys., vol. 50, p. 4914, 1969.
- (22) T. Charpentier, S. Ispas, M. Profeta, F. Mauri, and C. J. Pickard J. Phys. Chem. B, vol. 108, p. 4147, 2004.
- (23) M. K. Klintenberg, S. E. Derenzo, and M. J. Weber Comput. Phys. Commun., vol. 131, p. 120, 2000.
- (24) N. W. Winter, R. M. Pitzer, and D. K. Temple J. Chem. Phys., vol. 86, p. 3549, 1987.
- (25) T. A. Keith and R. F. W. Bader Chem. Phys. Lett., vol. 210, p. 223, 1993.
- (26) J. R. Cheeseman, G. W. Trucks, T. A. Keith, and M. J. Frisch J. Chem. Phys., vol. 104, p. 5497, 1996.
- (27) A. D. Becke J.Chem. Phys, vol. 98, p. 5648, 1993.
- (28) K. Burke, J. P. Perdew, and Y. Wang, Electronic Density Functional Theory: Recent Progress and New Directions. Plenum, 1998.
- (29) J. P. Perdew, K. Burke, , and M. Ernzerhof Phys. Rev. Lett., vol. 77, p. 3865, 1996.
- (30) P. Giannozzi, S. Baroni, N. Bonini, M. Calandra, R. Car, C. Cavazzoni, D. Ceresoli, G. L. Chiarotti, M. Cococcioni, I. Dabo, A. Dal Corso, S. de Gironcoli, S. Fabris, G. Fratesi, R. Gebauer, U. Gerstmann, C. Gougoussis, A. Kokalj, M. Lazzeri, L. Martin-Samos, N. Marzari, F. Mauri, R. Mazzarello, S. Paolini, A. Pasquarello, L. Paulatto, C. Sbraccia, S. Scandolo, G. Sclauzero, A. P. Seitsonen, A. Smogunov, P. Umari, and R. M. Wentzcovitch J. Phys.: Condens. Matter, vol. 21, p. 395502, 2009.
- (31) H. J. Monkhorst and J. D. Pack Phys. Rev. B, vol. 13, p. 5188, 1976.
- (32) N. Troullier and J. L. Martins Phys. Rev. B, vol. 43, p. 1993, 1991.
- (33) D. R. Hamann Phys. Rev. B, vol. 40, p. 2980, 1989.
- (34) R. E. Wasylishen and D. Bryce J. Chem. Phys., vol. 117, p. 10061, 2002.
- (35) S. C. Abrahams and J. L. Bernstein J. Chem. Phys., vol. 55, p. 3206, 1971.
- (36) M. D. Johannes and D. J. Singh Phys. Rev. B, vol. 71, p. 212101, 2005.
- (37) I. Grinberg and A. M. Rappe Phys. Rev. B, vol. 70, p. 220101, 2004.
- (38) P. K. Davies and M. A. Akbas J. Phys. Chem. Solids, vol. 61, p. 159, 2000.
- (39) T. Egami, W. Dmowski, M. Akbas, and P. K. Davies, “Local structure and polarization in Pb containing ferroelectric oxides,” vol. 436, p. 1, AIP, 1998.
- (40) C.-Z. Wang, R. Yu, and H. Krakauer Phys. Rev. B, vol. 54, p. 11161, 1996.
- (41) R. D. Shannon, “Revised effective ionic radii and systematic studies of interatomic distances in halides and chalcogenides,” Acta Crystallographica Section A, vol. 32, pp. 751–767, Sep 1976.
- (42) S.-E. Park and T. R. Shrout J. Appl. Phys., vol. 82, p. 1804, 1997.
- (43) B. Noheda and D. E. Cox Phase Transitions, vol. 79, p. 5, 2006. (See references within).
- (44) H. Fu and R. Cohen Nature, vol. 403, p. 281, 2000.
- (45) Z. Wu and H. Krakauer Phys. Rev. B, vol. 68, p. 014112, Jul 2003.
- (46) M. R. Suchomel and P. K. Davies Appl. Phys. Lett., vol. 86, p. 262905, 2005.
- (47) D. M. Stein, M. R. Suchomel, and P. K. Davies Appl. Phys. Lett., vol. 89, p. 132907, 2006.