COMPARING THE ACCRETION DISK EVOLUTION OF BLACK HOLE AND NEUTRON STAR X-RAY BINARIES FROM LOW TO SUPER-EDDINGTON LUMINOSITY
Abstract
Low-mass X-ray binaries (LMXBs) are systems in which a low-mass companion transfers mass via Roche-lobe overflow onto a black hole (BH) or a weakly magnetized neutron star (NS). It is believed that both the solid surface and the magnetic field of an NS can affect the accretion flow and show some observable effects. Using the disk emission dominant data, we compare the disk evolution of the two types of systems from low luminosity to super-Eddington luminosity. As the luminosity decreases the disk in the NS LMXB 4U1608–522 begins to leave the innermost stable circular orbit (ISCO) at much higher luminosity ( 0.1 ), compared with BH LMXBs at much lower luminosity ( 0.03 ), due to the interaction between the NS magnetosphere and accretion flow. However, as the luminosity increases above a critical luminosity, the disks in BH and NS LMXBs trace the same evolutionary pattern, because the magnetosphere is restricted inside ISCO, and then both the NS surface emission and (dipole) magnetic field do not significantly affect the secular evolution of the accretion disk, that is driven by the increased radiation pressure in the inner region. We further suggest that the NS surface emission provides additional information of accretion disk, not available in BH systems. Through the observed NS surface emission, we argue that the disk thickness is less than , and that the significant outflow from inner disk edge exists at luminosity close to Eddington luminosity.
1 Introduction
Low-mass X-ray binaries (LMXBs) are systems in which a low-mass companion () transfers mass via Roche-lobe overflow onto a black-hole (BH) or a weakly magnetized neutron star (NS; see reviews by Tanaka & Lewin 1995; van Paradijs & McClintock 1995). Based on their X-ray spectral and timing properties, LMXBs with an NS primary can be classified into two subclasses (Hasinger & van der Klis 1989; van der Klis 2006): Z sources with high luminosity (close to Eddington luminosity, ) and Atoll sources with low luminosity ( 0.001–0.5 ).
Compared to NSs, astrophysical BHs are relatively simple objects, possessing only mass and spin. As luminosity increases, BH LMXBs go through the quiescent state, low/hard state (LHS), intermediate state (IMS), high/soft state (HSS), and very high state (VHS) (Esin et al. 1997). Because IMS and VHS have similar spectral and timing behavior but with different luminosity, they can be taken as the same state and represent transitions between LHS and HSS (Done et al. 2007).
In the X-ray color-color diagram (CCD) or hardness intensity diagram (HID), Atoll sources trace a U-shape or C-shape track as the spectra evolve. From top to bottom, the three states are the extreme island state, the island state, and the banana state (Gierliński & Done 2002; Lin et al. 2007). To be consistent with BH LMXBs, however, we refer to these branches as LHS, IMS and HSS, respectively. On the other hand, Z sources display an approximate Z shape in CCD, and the upper, diagonal, and lower branches are called horizontal, normal, and flaring branches (HB/NB/FB), respectively. Z sources typically stay at high luminosity (close to Eddington luminosity) with very soft spectra on all three branches (Lin et al. 2009, hereafter LRH09).
There are two key differences between NSs and BHs – the presence or the absence of a solid surface and a (dipole) magnetic field. These differences give rise respectively to Type I X-ray bursts, which are thermonuclear explosions in the surface layers of NSs, and coherent pulsations, which are the signals resulting from the dipolar magnetic fields anchored in NSs (Done et al. 2007). These two phenomena are very common in NS X-ray binaries, but have never seen in the BH systems. It is believed that both the solid surface and the magnetic field can also affect the accretion flow, and show some observable effects.
For comparable mass accretion rates, the observational data suggest that BH LMXBs are fainter than NS LMXBs by a factor of 100-1000 in quiescent state. The large X-ray luminosity difference can be naturally explained by the advection-dominated accretion flow (ADAF) model. The bulk of thermal energy is trapped in the advective flow entering into the BH event horizon, and is lost from sight. Whereas in the case of NS, the thermal energy is radiated from its solid surface, and makes NS LMXB much brighter than BH system (Narayan & McClintock 2008). However, ADAF model overestimates the luminosity of quiescent NS LMXB, unless most of the accretion flow is prevented from reaching the NS surface on account of the “propeller” effect (Zhang et al. 1998; Menou et al. 1999).
The interaction of accretion flow with magnetic field can be characterized by the size of magnetosphere co-rotating with the central NS; the boundary of the magnetosphere is determined where the ram pressure of the flow is balanced by the magnetic pressure. When falling into the magnetosphere, the accreting gas is forced to co-rotate with the magnetosphere/NS, since the magnetic force dominates the flow dynamics in this region (Lamb et al. 1973). The radius of an NS magnetosphere increases with decreasing accretion rate (ram pressure), that is,
| (1) |
given by Cui (1997), where is the bolometric X-ray luminosity, is the NS surface magnetic field strength, and is the NS radius. If the magnetosphere expands beyond the co-rotation radius, the centrifugal barrier prevents most material accreting onto NS, and the disk is truncated at the magnetosphere radius. It is well known as “propeller” effect, and its evidence has been reported in some X-ray pulsars and Atoll sources (Cui 1997; Zhang et al. 1998; Campana et al 1998). The Atoll source 4U1608–522 is found to undergo an abrupt spectral change during the luminosity declines of its 2004 outburst (Chen et al. 2006). Chen et al. (2006) argued that this event can be interpreted as the propeller driven spectral state transition, similar to that found in Aql X-1 (Zhang et al. 1998; Campana et al 1998). In the next section, we investigate the 2007 outburst of 4U1608–522, that was observed with Swift and the Rossi X-ray Timing Explorer (RXTE) simultaneously. We compare the BH LMXBs with NS LMXBs from low to super-Eddington luminosity in §3, and present our conclusions in §4.
2 The 2007 outburst of 4U1608–522
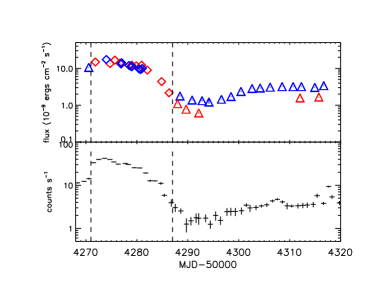
4U1608–522 is a typical Atoll source (Hasinger & van der Klis 1989), in which the kHz quasi-periodic oscillations and the Type I X-ray bursts have been detected (Nakamura et al. 1989; Remillard & Morgan 2005). Its distance of 3.6 kpc is estimated from some bursts that showed photospheric radius expansion (Nakamura et al. 1989). Zhang et al. (1996) first detected its hard X-ray outburst in low state over 20-100 keV with the Burst and Transient Source Experiment on the Compton Gamma Ray Observatory. Taking advantage of the huge database obtained with RXTE, Lin et al. (2007, hereafter Lin07) evaluated various spectral models for 4U1608–522. However, due to the lack of sensitivity below 2 keV with RXTE, they could not provide a substantial constraint on the thermal component, especially in the low luminosity soft and hard states (Lin07). Thanks to the superior low energy response and scheduling flexibility of Swift, we can break the new ground relative to the comprehensive study of 4U1608–522 by Lin07. Here we present the simultaneous RXTE and Swift observations of 4U1608–522 during its 2007 outburst in this section, and give a new insight of its accretion disk evolution from high to low luminosity soft state. Most of the observations from these two X-ray missions were made within half to one day, and the observations of 00030791017 (Swift) and 92401-01-11-04 (RXTE) were made exactly simultaneously on 2007 June 27, as shown in Figure 1. In the next two subsections, we describe the RXTE and Swift data reduction. The spectral modeling results are shown in §2.3.
2.1 RXTE Data Reduction
RXTE has three instruments - the Proportional Counter Array (PCA), the High-Energy X-ray Timing Experiment, and the All Sky Monitor (ASM). We analyze 4U1608–522 data from RXTE observations taken between 2007 June 19 and 2007 August 4 with the FTOOLS software package version 6.9 111See http://heasarc.gsfc.nasa.gov/docs/software/lheasoft/. The detailed studies presented in this work rely on data from the PCA. We only use the Standard2 data from the top layer of PCU2, that operated during all the observations (data of 300s before and 1000s after the Type I X-ray burst in July 31 are excluded). The data are filtered with the standard criteria: the Earth-limb elevation angle larger than and the spacecraft pointing offset less than . The background files are created using the program pcabackest and the latest bright source background model since the source intensity 40 counts/s/PCU. We create the PCA background-subtracted light curves for each energy channel in 128 s time bins. These light curves are used to build CCD, defining the soft and hard colors as the ratios of the counts in the (3.6-4.9)/(2.1-3.6) keV bands and the (8.6-18.0)/(4.9-8.6) keV bands, respectively. Figures 1 and 2 show that the source stays in the lower branch (diamond, HSS) in the outburst, and traces the upper branch in the CCD (triangle, LHS) before and after the outburst. However, the observations are not dense enough to cover IMS.

2.2 Swift Data Reduction
Swift has three scientific instruments on board: the Burst Alert Telescope (BAT), the X-ray Telescope (XRT), and the UV/Optical Telescope. 4U1608–522 was observed with XRT from 2007 June 20 to August 3. The data are reduced and analyzed with the FTOOLS software package version 6.9.
The XRT data were taken in window-timing (WT) mode before July 12 and after July 30, and switched to photon-counting (PC) mode between July 12 and July 30. However, the source was so bright that all PC mode data were strongly affected by pileup. Thus the PC mode data cannot be used, and only WT mode data are included in the subsequent analyses.
Initial event cleaning is performed using the xrtpipeline script, with standard quality cuts, and only events with grades 0-2 are selected as good events. Its spectra are extracted with xselect, from a rectangular box of 20 pixels wide and 60 pixels long centered at 4U1608–522, and background spectra are taken from a rectangular region of the same size outside of the source region. To correct for bad columns, the exposure maps are generated with xrtexpomap. We also produce the ancillary response files with xrtmkarf to facilitate subsequent spectral analyses. The latest response files (v011) are taken from the CALDB database. Finally, the spectra are grouped to require at least 20 counts per bin to ensure valid results using statistical analysis.
The uncorrected light curves varied drastically because of a violent change in the XRT effective area (by a factor of 10) in the observations on June 22 and June 26. As a result, the spectra of these two observations cannot be fitted with any physical model and excluded in the subsequent analyses .
2.3 Spectral Modeling
Various models are proposed to explain the X-ray spectra of NS LMXBs (Barret 2001), but not all of them are self-consistent, though providing acceptable fits. Using multiple evaluation criteria, Lin07 suggested that the RXTE spectra of NS LMXBs can be well interpreted with the hybrid model: for the hard state, a single-temperature blackbody (BB) plus a broken power law (BPL); for the soft state, two thermal components (standard thin accretion disk and BB) when the luminosity is high, and an extra constrained BPL is needed to fit the hard excess above 15 keV due to low levels of comptonization at lower luminosity. In this work, we apply their hybrid model to fit the spectra of 4U1608–522 with XSPEC version 12.6.0 (Arnaud 1996).
The PCA is now well calibrated up to about 50 keV using PCARMF (v11.7) 222http://www.universe.nasa.gov/xrays/programs/rxte/pca/doc/rmf/pcarmf-11.7/, which was released in 2009 July. The PCA spectra of 4U1608–522 are fitted over the energy range of 2.6-50.0 keV, and a systematic error of is added to all energy channels. On the other hand, fits made with the XRT data are restricted to the 0.6-10 keV range to avoid calibration uncertainties at energies less than 0.6 keV (Rykoff et al. 2007).
When the source is in LHS, the PCA spectra are fitted with BB+BPL, while the Swift/XRT spectra are fitted with BB (bbody in XSPEC) plus a power-law (PL, po in XSPEC) model. 4U1608–522 was active between June 19 and July 4, and the state of the source transits into HSS. Lin07 showed that the low levels of comptonization has influence on the spectra above 15 keV and a constrained BPL (bkn in XSPEC) component is only required at low luminosity soft state observations. At higher , most spectra can be fit by the multi-color disk model (MCD, diskbb in XSPEC) plus BB. Because the RXTE observations do not cover IMS and the Swift/XRT is lack of hard X-ray data, we fit both Swift/XRT and PCA spectra with the MCD+BB model. A Gaussian line with the width fixed at 0.1 keV is added to describe the Fe line in PCA spectral fitting. Fitting the Swift/XRT spectra, we find the neutral hydrogen column density of , which is in good agreement with those reported in literature (Penninx et al. 1989). Thus all models include an interstellar absorption component with the hydrogen column fixed at (Lin07), and the unabsorbed flux is calculated in 2.0-50.0 keV for PCA and 0.6-10.0 keV for Swift/XRT, respectively (Figure 1 and Table 1).
In the soft state, the inner disk radius can be estimated from the diskbb model as:
| (2) |
where is the normalization, is the distance, is the angle of the disk, is the fractional change of the color temperature and is the correction factor for the inner torque-free boundary condition (Zhang et al. 1997; Gierliński & Done 2002). For X-ray Binaries, we cannot restrict the inclination very well in most cases, unless the companion’s light curve modulation is observed. Since neither eclipses nor absorption dips have been observed (Lin07), we assume a reasonable inclination angle , however, do not exclude the possibility of smaller ones. kpc, 0.7, and are adopted in this work. Our main interest here is the trend of accretion disk evolution that does not strongly depend on the precise values of the inclination angle and these correction factors. With the inner disk radius and its temperature, the bolometric luminosity of the disk can also be derived as: . The Eddington luminosity is erg s-1 with being the mass of central compact object. Assuming that the mass of NS is 1.4 solar mass, then its Eddington luminosity is erg s-1 .
| ObsID | dof | |||||
|---|---|---|---|---|---|---|
| RXTE | ||||||
| 92401-01-10-00 | 72.39/73 | |||||
| 92401-01-10-01 | 62.36/73 | |||||
| 92401-01-11-00 | 68.22/73 | |||||
| 92401-01-11-02 | 45.56/73 | |||||
| 92401-01-11-03 | 52.42/73 | |||||
| 92401-01-11-04 | 51.72/73 | |||||
| 92401-01-11-01 | 103.7/73 | |||||
| 93408-01-01-00 | 62.77/73 | |||||
| 93408-01-01-01 | 88.11/73 | |||||
| 93408-01-01-02 | 95.24/73 | |||||
| Swift/XRT | ||||||
| 00030791010 | 692.2/556 | |||||
| 00030791013 | 669.75/554 | |||||
| 00030791014 | 601.503/572 | |||||
| 00030791015 | 306.662/312 | |||||
| 00030791017 | 607.722/587 | |||||
| 00030791018 | 688.549/567 | |||||
| 00030791019 | 712.975/583 | |||||
| 00030791020 | 759.609/576 | |||||
| 00030791021 | 497.757/487 | |||||
| 00030791022 | 468.277/397 |
Note. — At soft state, the data from PCA are fitted with wabs*(diskbb+bb+gau) and the Swift/XRT spectra are fitted with wabs*(diskbb+bb). : inner disk temperature; : normalization of disk; : BB temperature; : normalization of BB; : 2.0–50.0 keV intrinsic flux in the units erg cm-2 s-1 for RXTE, while 0.6-10.0 keV for Swift/XRT; /dof: and degrees of freedom for the best-fit model.
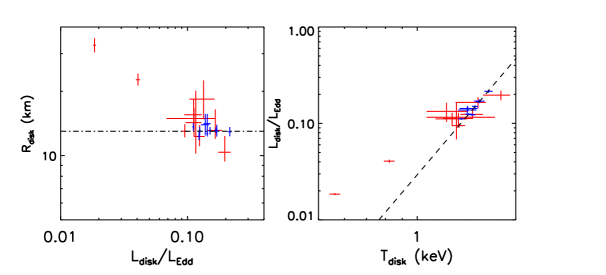
In Figure 3 we plot the radius of the inner accretion disk versus the bolometric luminosity of the disk in units of . Above 0.1 , the inner disk radius remains constant ( 13 km), that is, the innermost stable circular orbit (ISCO) of NS. The dashed line in the right panel of Figure 3 represents with km. These results are in agreement with Lin07 (Figure 7 in their paper).
There are two XRT observations below 0.1 that deviate from the constant radius and . Since these two observations cover the lower luminosity (IMS) just before the source returns to LHS, we need to check the spectral model carefully. Fitting the data with MCD+BB and BB+PL shows that the MCD+BB model is favored; adding a PL component to MCD+BB, the photon index pegs at the hard limit of 10.0. However, there is a caveat when we use the simple PL model to depict the Compton component in fitting the spectra of X-ray binaries: it rises without limit at low energies, which evidently disagrees with Comptonization. To eliminate this divergence, we further fit the data with a more appropriate Compton model (SIMPL, simpl in XSPEC), which is developed by Steiner et al. (2009). With only two free parameters, SIMPL incorporates the basic features of Compton scattering of soft photons by energetic coronal electrons. Since the seed photons for the Comptonized component can be from MCD and/or BB, we combine the SIMPL, DISKBB, and BB in a variety of ways to fit the spectra (i.e., simpl*(diskbb+bb), (simpl*diskbb+bb), and (diskbb+simpl*bb)). Though all these models cannot constrain the parameters owing to limited photons, the fitting results all indicate that the inner disk radius really moves out.
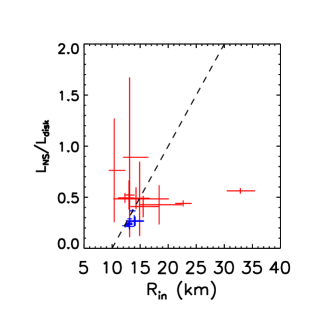
Figure 4 shows the ratio between the BB and MCD luminosity versus the inner disk radius. Assuming that the accretion matter falls freely from the inner disk to the surface of NS, the gravitational potential energy is converted to radiation on the NS surface. The dashed line represents that the luminosity of BB component (i.e., the emission from the NS surface) is equal to the gravitational potential energy, taking NS radius km. The data above the line mean that the accretion matter does not fall freely from the disk but also contains some initial kinetic energy as the matter leaves the inner disk boundary. The two observational data in IMS lying far below the line indicate that significant outflow is accompanied with accretion.
3 Comparing NS LMXBs with BH LMXBs
3.1 Transition from Low/Hard State to High/Soft State
Since Cui (1997) first presented evidence for “propeller” effect in two X-ray pulsars, GX 1+4 and GRO J1744-28, further observational evidence for the interaction between magnetosphere and accretion disk has been found in other NS X-ray binaries (e.g., Zhang et al. 1998; Campana et al. 1998). Although the details vary, all magnetosphere models predict that the inner disk is truncated at the magnetosphere radius, that expands with decreasing accretion rate. The entire process should simply reverse: with increasing accretion rate the magnetosphere moves inward (Cui 1997). However, when the inner disk is truncated at several times of , most of disk components with the temperature around 0.5 keV are out of the observed bandpass of RXTE. Thus, direct measurement of magnetosphere radius cannot be made unless the data from instruments covering the softer X-ray bandpass are used (Done et al. 2007; Gierliński et al. 2008).
Investigating the simultaneous RXTE and Swift observations of 4U1608–522 during its 2007 outburst, we find that the inner disk radius increases along the outburst declining phase. This can be naturally interpreted as the interaction between the magnetosphere and the accretion disk. Using Equation (1) we can further derive the magnetic field of G, in agreement with the value derived from the “propeller” effect (Chen et al. 2006). The fitting result also implies that magnetically driven outflowing is significant at lower luminosity ( 0.1 ; see discussion above about Figure 4), possibly as a result of disk-magnetosphere interaction.
To explain the spectral state of BH LMXBs, Esin et al. (1997) proposed a possible scenario: an accretion flow around a BH consists of two zones with a transition radius , an inner ADAF, and an outer standard thin disk. The ADAF can extend outside, lying above the disk in the form of a hot corona. The transition radius is correlated inversely with accretion rate, that is, the outer thin disk is restricted to a larger radius at a lower mass accretion rate, and vice versa. Substantial theoretical and observational efforts have been made since then; however, some major issues still remain unresolved so far. More observations have shown that the transition occurs at a range of luminosity, even in a single object. These suggest that the mass accretion rate is a dominant but not the only parameter in determining spectral state transitions (Yu et al. 2004). Because the behavior of a disk is hard to track as the temperature is below 0.5 keV and its contribution is dominated by non-thermal component, whether the thin disk extends down close to the central compact object in the hard state has remained another controversial topic for a long time (Liu et al. 2011). Using the same data of XTE J1817–330 during its 2006 outburst, Rykoff et al. (2007) showed that the cool disk remained near ISCO at very low luminosity 0.001 , but Gierliński et al. (2008) argued that the disk receded when the source left the disk dominant soft state. To avoid this uncertainty, we only investigate the disk dominant observations in the present work. It was found that its inner disk radius increases as the luminosity falls below 0.02-0.03 (cyan triangles in Figure 5) (Rykoff et al. 2007; Gierliński et al. 2008); the mass of BH in XTE J1817–330 is 6 solar masses and the inclination angle is (Sala et al. 2007). Some other work also supported that the disk in BH LMXBs begins to leave ISCO as the luminosity decreases below 0.02-0.03 or even lower (Nowak et al. 2008; Maccarone 2003).
When the accretion rate is sufficiently high in NS LMXB system, the magnetosphere can be pushed inside ISCO, and thus significantly decoupled from the accretion disk, assuming that the disk’s physical boundary cannot extend beyond ISCO. As a result, above this critical luminosity, the disk in BH and NS LMXBs should share very similar evolutionary pattern, as the disk-magnetosphere interaction in NS LMXBs is not important in this case. Figure 5 shows that the thin accretion disk extends down to ISCO for both BH LMXBs and Atoll sources in HSS with luminosity 0.1-0.3 . It has been suggested that ISCO is just outside the radius of NS, and providing constraint on the NS equation of state (Done et al. 2007). On the other hand, ISCO is a monotonically decreasing function only of the BH spin. Thus, the spin of BH can be immediately derived from the ISCO if the distance, mass, and inclination of the systems are available (Zhang et al. 1997; for recent developments please refer to McClintock et al. 2006).
3.2 Transition from High/Soft State to Super-Eddington State
It has been realized for a long time that the super-Eddington accretion flow seems to occur in many astrophysical situations, such as in ultra-luminous X-ray sources (ULXs), Narrow Line Seyfert 1’s, and the growth of the first BHs in the early universe (Done et al. 2007). Investigating the spectra of M33 X-8, Weng et al. (2009) suggested that some of ULXs occupy a new state – super-Eddington state (or slim state; see also Gladstone et al. 2009). However, because all these sources are out of the Galaxy and thus with inadequate data, and by contrast, most BH LMXBs and Atoll sources in the Galaxy are well below the Eddington luminosity, our knowledge on the super-Eddington accretion flow is extremely rudimentary currently.
GRS 1915+105 is one of the few BH LMXBs that transit among the five classical states and super-Eddington state. Fitting the thermal dominant data of GRS 1915+105, McClintock et al. (2006) found that the value of the BH’s spin remained constant when its luminosity was less than 0.3 , but was depressed when the luminosity exceeded a critical level. Observationally it means that the disk inner edge increased with luminosity. Such phenomenon can be explained in two very different ways. (1) The inner disk edge is still located at ISCO, but its emission is shaded by the outer disk when the luminosity goes higher and the disk becomes thicker. Therefore the inner disk radius obtained from the spectral fitting is not the true value but just the larger radius at which the emission is not blocked by outer disk (McClintock et al. 2006). (2) The inner disk really recedes at high luminosity. However, the data of GRS 1915+105 alone cannot distinguish between these two pictures.
Unlike Atoll sources, Z sources typically radiate at luminosity close to Eddington luminosity. During its 2006-2007 outburst, the extraordinary NS LMXB XTE J1701–462 evolved from super-Eddington luminosity to quiescence. The source firstly displays Cyg-like Z track, then Sco-like Z track, finally evolved smoothly into the Atoll track (see LRH09 for the definition of the source branches), with the disappearance of the FB and through the NB/FB vertex. According to the spectral analysis, the intimate relation between the Atoll track and the NB/FB vertex is suggested by LRH09. The Atoll HSS is characterized by a constant inner disk radius, whereas the NB/FB vertex stage exhibits a luminosity dependent expansion of the inner disk (LRH09).
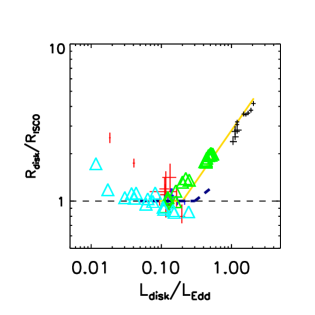
We plot the ISCO-scaled radius of inner disk versus the luminosity in units of in Figure 5, where kpc, , and are adopted for GRS 1915+105, and the inner disk radii obtained from the Figure 1. in McClintock et al. (2006) are marked by green triangles. The inner disk radii of XTE J1701–462 taken from Figure 17 in LRH09 are denoted by the gold solid line, because the number of data points is too numerous for display. Note in LRH09, erg s-1 is adopted for NS, whereas ergs s-1 is used here.
It is interesting that the disk evolution of GRS 1915+105 and XTE J1701–462 track the same way from HSS to super-Eddington state as shown in Figure 5. This implies that both NS surface emission and (dipole) magnetic field do not significantly affect the secular evolution of the accretion disk. Note that such evolutionary feature is also found in other Z sources, e.g. Cir X-1 (Ding et al. 2011, in preparation) and BH X-ray binaries, e.g. LMC X-3 (Steiner et al. 2010). Steiner et al. (2010) analyzed hundreds of observations of LMC X-3 collected by eight X-ray missions, and found that the source is habitually soft and highly variable. The inner disk radius stably kept at ISCO when LMC X-3 varied between low Eddington luminosity ( 0.05 ) and 0.3 , whereas it moved out when the source is brighter than 0.3 (see Figure 2 in Steiner et al. 2010). Thus this luminosity-dependent expansion of the inner disk cannot be attributed to the extreme physical parameters in GRS 1915+105 or XTE J1701–462 (e.g., high spin in GRS 1915+105), but would be caused by the radiation pressure enhancement at luminosity close to Eddington luminosity (i.e., the local Eddington limit effect as mentioned in LRH09).
Besides the evolution of the accretion disk, Figure 17 in LRH09 showed that the boundary emission area maintained its small and nearly constant size from the Atoll stage to the NB/FB vertex. Lin07 speculated that the small size of the boundary layer can be evidence of a geometrically thin accretion stream feeding a rather well-defined impact zone, and the BB emission is restricted in a small symmetric equatorial belt on the NS surface. We would like to further suggest that, the quantitative constraint of disk thickness can be given by the result of the constant BB radius if the inclination of system is known. Assuming that a disk thickens with higher luminosity, when the value of thickness , the boundary layer emission should be partially obscured by the outer disk, and the observed BB radius should decrease with intensity increase. However, this picture obviously conflicts the observed constant BB radius. In the NB/FB vertex branch, the luminosity of BB is much less than the disk luminosity, and the deficit of the BB component becomes more severe when luminosity increases, implying that most inflowing matter is ejected as outflow before reaching the NS surface.
4 Conclusions
Type I X-ray bursts and the coherent pulsations are unique signatures of NSs; however, not all NSs show these characteristics (Done et al. 2007; Lewin et al. 1993). It is believed that both the solid surface and the magnetic field can affect the accretion flow and show some observable effects as evidence of NSs. Comparing the disk evolution of BH and NS X-ray binary systems with the disk dominant data, we find that different phenomena exist below 0.1 , whereas the same evolution pattern is shared above the critical luminosity. Our main results and discussions are summarized in the following.
1. The inner disk expands outward at low luminosity as luminosity decreases in the soft state in both BH and NS LMXBs’ systems. The disk in a BH LMXB stays at ISCO until luminosity near or even below 0.03 due to the disk’s secular evolution. However, the disk in the Atoll source 4U1608–522 begins to leave ISCO at much higher luminosity 0.1 , that can be interpreted as the interaction between magnetosphere and accretion flow, providing further evidence for NS in the system. The fitting result also indicates that the magnetically driven outflow is significant at lower luminosity and the NS’s surface (dipole) magnetic field is G in 4U1608–522, in good agreement with previous works. However, a major drawback of the work presented here is the small sample of sources investigated, and thus at this stage we cannot claim with confidence generality of the results presented here, that should be confronted in the future with further analyses of more observations in larger samples.
2. Above the critical luminosity, the disks in BH and NS LMXBs trace the same evolutionary pattern. We suggest that the magnetosphere is pushed inside ISCO, and both NS surface emission and (dipole) magnetic field do not significantly affect the secular evolution of the accretion disk at high luminosity. When the source is brighter than 0.3 , its disk expands roughly as , as a result of radiation pressure increase in the inner region. The simple standard thin disk model rather than more sophisticated models is used in this work, because of its simplicity, uniform treatment of all spectral fittings, and consistent trend of disk evolution obtained. However, some physical assumptions of the thin disk would break down at high luminosity. To more accurately describe the high accretion rate flow, relativistic effects, self-irradiation of the disk, color correction factor, the inner torques on the disk, etc., should be taken into account and treated with caution in the future.
3. We have made the first quantitative constraint on the disk thickness, , with the observed surface NS BB emission at around Eddington luminosity; our result also implies that most inflowing matter is ejected as outflow before reaching the NS surface. Since we expect at high luminosity the accretion disks in BH systems have the same property as that in NS systems, the above conclusion indicates that the advected fraction should be very small in BH systems at high accretion rate, because most accreted material should be ejected as outflow in this case.
Finally we mention that we only studied in this work the Atoll HSS, the NB/FB vertex branch of XTE J1701–462, and the disk dominant state of GRS 1915+105. However, both two sources are variable, and the spectra show complicated features along their transitions. Different branches may contain very different accretion physics (LRH09; Fender & Belloni 2004), that is beyond the scope of this work.
References
- (1) Arnaud, K. A. 1996, in ASP Conf. Ser. 101, Astronomical Data Analysis Software and Systems V, ed. G. H. Jacoby &J. Barnes (San Francisco, CA: ASP), 17
- (2) Barret, D. 2001, Adv. Space Res., 28, 307
- (3) Campana, S., Stella, L., Mereghetti, S., et al. 1998, ApJ, 499, L65
- (4) Chen, X., Zhang, S. N., & Ding, G. Q., 2006, ApJ, 650, 299
- (5) Cui, W. 1997, ApJ, 482, L163
- (6) Done, C., Gierli nski M., & Kubota, A. 2007, A&AR, 15, 1D
- (7) Esin, A. A., McClintock, J. E., & Narayan, R. 1997, ApJ, 489, 865
- (8) Fender, R., & Belloni, T. 2004, ARA&A, 42, 317
- (9) Gierliński, M. & Done, C. 2002, MNRAS, 337, 1373
- (10) Gierliński, M., Done, C., & Page, K. 2008, MNRAS, 388, 753
- (11) Gladstone, J. C., Roberts, T. P., & Done, C. 2009, MNRAS, 397, 1836
- (12) Hasinger, G., & van der Klis, M. 1989, A&A, 225, 79
- (13) Lamb, F. K., Pethick, C. J., & Pines, D. 1973, ApJ, 184, 271
- (14) Lewin, W., van Paradijs, J., & Taam, R. 1993, Space Sci. Rev., 62, 223
- (15) Lin, D., Remillard, R. A., & Homan, J. 2007, ApJ, 667, 1073 (Lin07)
- (16) Lin, D., Remillard, R. A., & Homan, J. 2009, ApJ, 696, 1257 (LRH09)
- (17) Liu, B. F., Done, C., & Taam, R. E. 2011, ApJ, 726, 10
- (18) Maccarone, T. J. 2003, A&A, 409, 697
- (19) McClintock, J. E., Shafee, R., Narayan, R., et al. 2006, ApJ, 652, 518
- (20) Menou, K., Esin, A. A., Narayan, R., et al. 1999, ApJ, 520, 276
- (21) Nakamura, N., Dotani, T., Inoue, H., et al. 1989, PASJ, 41, 617
- (22) Narayan, R., & McClintock, J.E. 2008, New Astron. Rev., 51, 733
- (23) Nowak, M. A., Juett, A., Homan, J., et al. 2008, ApJ, 689, 1199
- (24) Penninx, W., Damen, E., van Paradijs, J., Tan, J., & Lewin, W. H. G. 1989, A&A, 208, 146
- (25) Remillard, R., & Morgan, E. 2005, ATel, 482
- (26) Rykoff, E. S., Miller, J. M., Steeghs, D., & Torres, M. A. P., 2007, ApJ, 666, 1129
- (27) Sala, G., Greiner, J., Ajello, M., Bottacini, E., & Haberl, F. 2007, A&A, 473, 561
- (28) Steiner, J. F., McClintock, J. E., Remillard, R. A., et al. 2010, ApJ, 718, L117
- (29) Steiner, J. F., Narayan, R., McClintock, J. E., & Ebisawa, K. 2009, PASP, 121, 1279
- (30) Tanaka, Y., & Lewin, W.H.G., 1995, X-ray Binaries, ed. W. H. G. Lewin, J. van Paradijs, & E. van den Heuvel (Cambridge: Cambridge Univ. Press), 126
- (31) van der Klis, M. 2006, in Compact Stellar X-ray Sources, ed. W. Lewin & M. van der Klis (Cambridge: Cambridge Univ. Press), 39
- (32) van Paradijs, J., & McClintock, J. E. 1995, in X-Ray Binaries, ed. W. H. G. Lewin, J. van Paradijs, & E. P. J. van den Heuvel (Cambridge: Cambridge Univ. Press), 58
- (33) Weng, S.-S., Wang, J.-X., Gu, W.-M., & Lu, J.-F. 2009, PASJ, 61, 1287
- (34) Yu, W., van der Klis, M., & Fender, R. 2004, ApJ, 611, L121
- (35) Zhang, S. N., Cui, W., & Chen, W. 1997, ApJ, 482, L155
- (36) Zhang, S. N., Harmon, B. A., Paciesas, W. S., et al. 1996, A&AS, 120, 279
- (37) Zhang, S. N., Yu, W., & Zhang, W. W. 1998, ApJ, 494, L71