Extreme Emission Line Galaxies in CANDELS: Broad-Band Selected, Star-Bursting Dwarf Galaxies at
Abstract
We identify an abundant population of extreme emission line galaxies (EELGs) at redshift in the Cosmic Assembly Near-IR Deep Extragalactic Legacy Survey (CANDELS) imaging from Hubble Space Telescope/Wide Field Camera 3 (HST/WFC3). 69 EELG candidates are selected by the large contribution of exceptionally bright emission lines to their near-infrared broad-band magnitudes. Supported by spectroscopic confirmation of strong [OIII] emission lines – with rest-frame equivalent widths – in the four candidates that have HST/WFC3 grism observations, we conclude that these objects are galaxies with in stellar mass, undergoing an enormous starburst phase with of only Myr. These bursts may cause outflows that are strong enough to produce cored dark matter profiles in low-mass galaxies. The individual star formation rates and the co-moving number density () can produce in 4 Gyr much of the stellar mass density that is presently contained in dwarf galaxies. Therefore, our observations provide a strong indication that many or even most of the stars in present-day dwarf galaxies formed in strong, short-lived bursts, mostly at .
1. Introduction
The formation history of dwarf galaxies with masses can usually only be studied through ’archaeological’ age reconstruction, based on resolved stellar populations (e.g., Grebel, 1997; Mateo, 1998; Weisz et al., 2011). Their high-redshift progenitors have so far remained elusive despite the ever increasing depth of spectroscopic observing campaigns and imaging from the ground and the Hubble Space Telescope (HST). In this paper we identify an abundant population of dwarf galaxies undergoing extreme starbursts, through HST/Wide Field Camera 3 (WFC3) imaging from the Cosmic Assembly Near-IR Deep Extragalactic Legacy Survey (CANDELS, Grogin et al., 2011; Koekemoer et al., 2011), that may well be the progenitors of present-day dwarf galaxies with stellar masses .
At the present day, starbursts contribute a minority to the total star formation activity in dwarf galaxies (Lee et al., 2009). However, there is abundant evidence that the star formation histories are complex and that bursts play an important role (as reviewed by Mateo, 1998). Many authors find evidence for short-lived (10 Myr) SF events in nearby star-forming dwarf galaxies from a range of observational and modeling techniques (e.g., Schaerer et al., 1999; Mas-Hesse & Kunth, 1999; Thornley et al., 2000; Tremonti et al., 2001; Harris et al., 2004), while others argue that star formation epochs of dwarf galaxies are more prolonged (e.g., Calzetti et al., 1997; Lee, 2008; McQuinn et al., 2009). Simulations also indicate that star formation histories of low-mass galaxies are episodic or even burst-like (e.g., Pelupessy et al., 2004; Stinson et al., 2007; Nagamine, 2010).
As most stars in dwarf galaxies formed more than 5 Gyr ago (e.g., Dolphin et al., 2005; Weisz et al., 2011), it is crucial to understand the mode of star formation in dwarf galaxies at those early epochs, but ’archaeological’ studies do not have the resolution in terms of stellar population age to constrain strengths, durations, and frequency of bursts. The increased frequency of interactions with other galaxies and higher gas fractions at may have resulted in strong, short-lived starbursts. In this paper we place the first constraints on the open question of how many and how frequently strong, short-lived starbursts occur in dwarf galaxies at , and how relevant this mode of star formation is for the build-up of the dwarf galaxy population in a cosmological context.
2. Data
2.1. Multi-Wavelength Imaging
We select objects from multi-wavelength photometry of two fields with HST/WFC3 and Advanced Camera for Surveys (ACS) coverage: the Ultra Deep Survey (UDS) field and the GOODS-South Deep (GSD) field at 4-epoch depth.111GOODS is the Great Observatories Origins Deep Survey. CANDELS provides deep images over the central parts of GOODS-North and GOODS-South, and wider, less deep imaging over the remainder of those fields and over the other CANDELS fields, including UDS. See the CANDELS website, http://candels.ucolick.org/ , for details of the field layouts. For the UDS we use WFC3 imaging in F125W () and F160W () and ACS imaging in F814W () from CANDELS. For the GSD we use the and band imaging from CANDELS, supplemented by WFC3 imaging from the Early Release Science (ERS) program (Windhorst et al., 2011), and band imaging from GOODS (Giavalisco et al., 2004). The total area with -, -, and -band coverage used here is 279 square arcminutes.
Sources are detected in the band with SExtractor (Bertin & Arnouts, 1996) and photometry is performed with TFIT (Laidler et al., 2007), which uses additional imaging data sets, ranging from to 4.5m to produce resolution-matched, multi-wavelength catalogs. The catalog construction is described in full by Guo et al. (in prep.). In addition, we use a version of GALAPAGOS (Häussler et al., 2007) adapted for CANDELS WFC3 imaging to measure structural parameters (van der Wel et al., in prep.).
2.2. Color-Color Selection
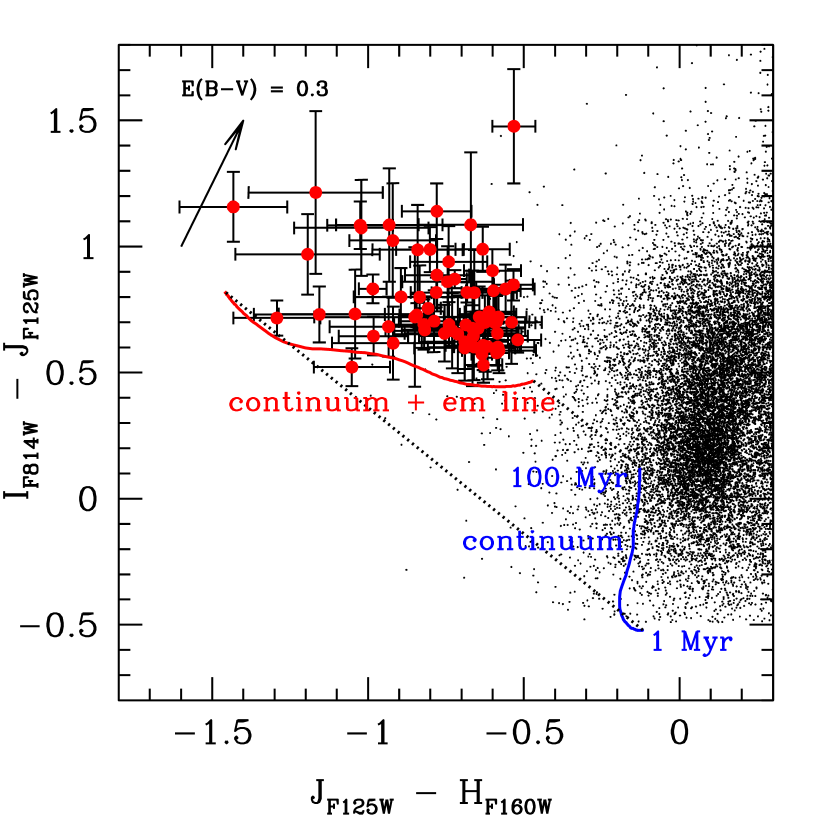
We select objects that are red in and blue in (see Figure 1), tracing luminous emission lines that contribute significantly to the total -band light. No known continuum emission can produce such broad-band colors. The highlighted objects in Figure 1 have and , where refers to the color uncertainty; that is, we select those objects that are significantly more than 50% brighter in J than in both I and H. We identify 69 such objects, that is, there is 1 per 4 square arcminutes. They range in magnitude from to , with a median of (see Table 1). We note that there is no gap in color-color space between the emission line galaxy candidates that we select and the general distribution; the selected objects are merely the most extreme outliers.
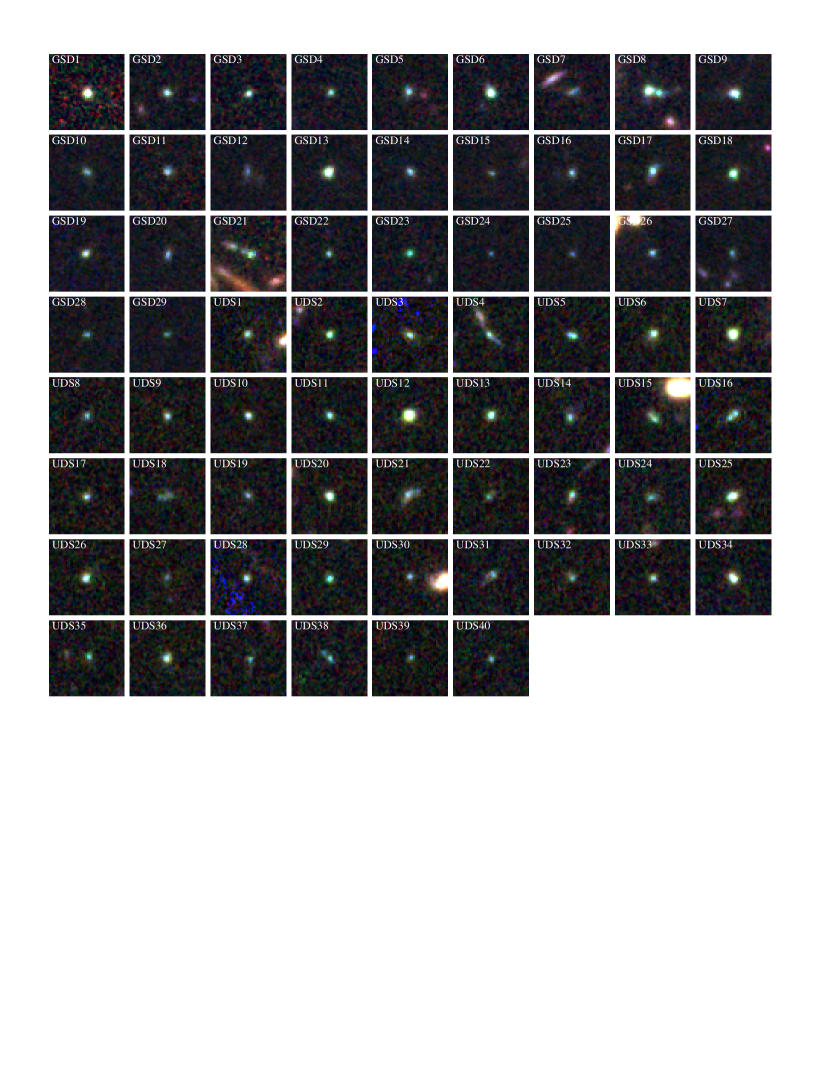
In Figure 2 we show false-color composites of all 69 candidates. These sources are typically compact, but not unresolved; their - and -band half-light radii from GALFIT are typically 0.1. A subset () are more extended or consist of multiple components. We show the through 4.5 spectral energy distributions (SEDs) of a subset of the emission-line candidates in Figure 3. The SEDs are seen to be almost entirely flat in , or in terms of ultra-violet spectral slope they have , where is defined as . The band is a notable outlier from this SED shape for all these objects.

3. Extremely Bright Emission Lines
3.1. Photometric Constraints
No known objects have continuum SEDs that resemble those shown in Figure 3; in particular, the extraordinarily blue colors are difficult to explain by any radiative process. Our hypothesis is that the -band excess is due to one or more emission lines. The implied equivalent widths in the observed frame are extraordinarily high: .
Among the emission lines that can reach such extreme EWs, Ly and [OII] are immediately ruled out because the implied high redshift would produce a strong break in the SEDs; the lack of such a break implies for these objects. WFC3/UVIS observations (Windhorst et al., 2011) provide UV photometry over the ERS area. The average color of those candidates in the ERS area is , which suggests that the Lyman break is situated at around 3000 in the observed frame, which, in in combination with the very blue continuum slopes redward of the U band, implies . Only one candidate with UVIS coverage has a color consistent with that of a galaxy at . The implication is that strong [OIII] emission at 4959 and 5007 provide the most plausible explanation for the J band excess light.
If [OIII] is responsible for the J band excess the redshift upper limit is . Furthermore, because we select objects with blue colors, the cannot contain the bright H line, which implies . Thus, solely based on their photometric properties, we suggest that our candidates are strong [OIII] emitters in the redshift range .
3.2. Spectroscopic Constraints
The hypothesis that [OIII] emission at explains the J band excess light is strongly supported by spectroscopic observations. While none of the candidates have ground-based spectra, WFC3 grism observations are available for small portions of the GSD (one pointing in the ERS field, Straughn et al., 2011) and the UDS (from the supernova follow-up program 12099, PI A. Riess). The available grism coverage overlaps with the positions of 4 candidates in our sample (1 in the ERS, 3 in the UDS), and strong emission lines are detected in all 4 cases. The spectra (Figure 4) all show bright emission lines in the wavelength range , whose combined fluxes are in agreement with the excess light seen in the J band.
The lines in all 4 spectra are readily identified as [OIII]: the asymmetry of the bright line, always extended blueward, is due to the two components of the [OIII] line, at 5007 and at 4959, where the latter is fainter. In all cases, H is also detected. The redshifts are all in the range , in excellent agreement with what we inferred solely from photometry. We conclude that our sample of extreme emission line galaxies (EELGs) form the high-EW tail of the general population of emission line galaxies seen in ACS and WFC3 spectroscopic grism observations (e.g., Straughn et al., 2008, 2009; Atek et al., 2010; Straughn et al., 2011).
In principle, H emitters at should also be included by our selection technique. The spectroscopy and UV photometry indicate that those must be far fewer than [OIII] emitters. Whether this is due to selection effects or evolution in the number density of such objects remains to be seen. Still, even though our working hypothesis is that all 69 candidates are [OIII] emitters at , we should keep in mind that some fraction of our 69 candidates are likely H emitters at .

3.3. Emission Lines and Broad-Band Photometry
We have shown that selecting objects which are much brighter in than in and works as a rather clean method for finding strong [OIII] emitters at . Emission line galaxies with such excesses in other bands also exist, but a systematic search is more complicated as at most redshift ranges, multiple lines (most notably [OIII] and H) affect multiple photometric bands. Therefore, we refrain from conducting such a systematic search here.
The existence of such emission-line dominated galaxies complicates the interpretation of SEDs, which is especially relevant in the case of the search for and SED modeling of rare, high-redshift objects. Although contamination by emission lines is often considered to be a factor (e.g., Labbé et al., 2010), the extremely bright lines we observe suggests that their effect may be underestimated. Ono et al. (2010) explicitly showed that red colors in Ly emitters and Lyman break galaxies may indicate the presence of evolved stellar populations or strong nebular emission lines (also see Schaerer et al., 1999; Finkelstein et al., 2011). Steep UV continuum slopes, such as observed in our objects, should serve as a warning sign for contamination by nebular emission lines at longer wavelengths to the point that those can dominate the broad-band flux density.

4. Starbursting Dwarf Galaxies at
4.1. Star formation or AGN?
Before turning to our preferred starburst interpretation, let us first point out that nuclear activity is not a likely explanation for the bright emission lines in the vast majority of EELGs. None of the objects in the CDFS have significant detections in X-ray or at 24m. The objects are spatially resolved in both J and H, and, moreover, the and band sizes are consistent with each other.
Moreover, it is highly unlikely that all 69 objects are dominated by line emission from active galactic nuclei. At least at the present day, low-mass, low-metallicity AGN are exceedingly rare (Izotov & Thuan, 2008), much rarer than starbursting dwarf galaxies (Izotov et al., 2011). The implied black hole masses for the objects in our sample, as inferred from their UV continuum luminosities (Shen et al., 2008) are at most, when assuming an Eddington accretion of unity. At these low masses, at least at the present day, secular processes drive nuclear activity; thus, an unknown accretion mode or triggering mechanism for nuclear activity would have to be invoked in order to explain an extreme change in the relative numbers of AGN and starburst powered emission-line dominated objects. At these low masses, merging cannot account for this. The starburst hypothesis, on the other hand, places these objects in the realm of dwarf galaxies, and their physical and statistical properties are consistent with the abundances and masses of dwarf galaxies as we will discuss below.
Although nuclear activity cannot be ruled out entirely – and line-strength gradients in star forming galaxies suggest that weak AGN may contribute to some extent (Trump et al., 2011) – we can safely assume that the observed emission lines are effectively dominated by star formation activity.
4.2. Starburst Ages and Masses
We interpret the observations in the context of the Starburst99 model (SB99, Leitherer et al., 1999), which includes predictions for how the EWs of Hydrogen recombination line evolve over time. Therefore, our first task is to estimate H line strengths from the data. We attribute the excess light in the J band, compared to the continuum light measured in the I and H bands, to combined effect of emission lines. Therefore, we can compute the combined equivalent width as follows:
| (1) |
where is the effective width of the -filter response curve, to correct the observed EW to the rest frame, and is the flux density in the respective filters.
The relative contributions of the various emission lines are constrained by fitting Gaussian components to the 3 emission lines seen in the grism spectra shown in Figure 4, keeping the ratio between the two [OIII] components fixed at 3. We only use the 3 UDS spectra as H is only marginally detected in the GSD spectrum. The emission line ratios are remarkably similar for all 3 objects: H contributes 1/8 to the combined line luminosity, suggesting a very low metallicity (see, e.g., Salzer et al., 2005; Amorín et al., 2010, for comparisons). Because the flux is dominated by the [OIII]5007 line and is therefore more directly related to our observations, we show the inferred [OIII]5007 EWs in Figure 5 (also see Table 1). However, we model the observations by fitting the inferred H EWs to the SB99 predictions. These are assumed to be always 1/8th of the combined EW. The unavoidable intrinsic scatter in this conversion is mimicked by propagating a generous factor of two in the uncertainties of the quantities we infer below.
is a sensitive age indicator, as it is quickly reduced once a stellar population gains in mass or the star formation activity diminishes. For a SB99 model with continuous star formation with a Chabrier (2003) IMF with a high-mass cut off at 100 and metallicity 0.2 the H EWs imply that the galaxies in our sample typically have ages of Myr (Figure 6). It seems unlikely that these bursts will be much longer than this given the energy put into the interstellar medium (see Sec. 4.3); follow-up grism observations will directly constrain the number of older bursts.
If we assume a single burst model instead, we infer ages Myr; all formation histories with declining star formation rates produce ages that are bracketed by these two extremes. Continuous star formation seems more realistic than an instantaneous burst, a notion that becomes physically untenable at very young ages. Star formation cannot happen faster than the dynamical time scale of 10 Myr for these systems. Most relevant for our analysis is that the stellar mass estimates derived from the two different models are very similar (see below).
We note that choosing a different metallicity does not significantly change our results – a low metallicity is realistic for these low-mass systems (Amorín et al., 2010), and the [OIII]-H ratio suggests the metallicity is indeed low. Choosing an even lower metallicity (0.05 instead of 0.2) results in an increase in both age and mass by dex. We do suffer from the usual, unknown uncertainty due to our lack of knowledge of the stellar IMF. A different slope or cutoff at the high-mass end changes the number of ionizing photons from high-mass stars per unit stellar mass, and the entirely unconstrained number of low-mass stars () determines the overall normalization of the stellar mass. In general, we conclude that the ages of these galaxies are Myr, which includes the intrinsic range in age and the systematic uncertainty due to the unknown star formation history.
In the following we use the results from the continuous star formation model, but using the instantaneous burst model, by virtue of the insensitivity of the mass estimates to the choice of star formation history, does not change our interpretation and conclusions.

For a given age, the SB99 model predicts the (rest-frame) -band mass-to-light ratio, such that we can directly estimate the mass after deriving the -band luminosity from the observed band magnitude. We correct the luminosity and the derived mass estimate for extinction by comparing the continuum slope derived from the ACS photometry at rest-frame 2500, typically (see Table 1), with the SB99 model prediction (rather constant at for the ages of these bursts). If we adopt the Calzetti et al. (2000) extinction law for starbursting galaxies the typical extinction is .
The median mass we infer is (see Table 1 and Figure 6). Mass estimates inferred from the instantaneous burst model are only slightly smaller, by less than 0.1 dex on average. Internal consistency lends our modeling approach strong credibility: given the inferred ages, masses, and extinction corrections, the SB99 model predicts dust-attenuated rest-frame UV luminosities that are consistent with the observed rest-frame UV luminosities – the latter are not used in our modeling procedure. Thus, the model successfully describes the observed rest-frame UV and optical continuum spectral energy distributions as well as the observed emission line luminosities.
Full modeling of the spectral energy distributions that includes emission line contributions will be presented in forthcoming studies that will also include objects with less prominent emission lines. As a consistency check with the results presented above we already applied the method outlined by Finkelstein et al. (2011) to the galaxies in our sample. This method compares the observed photometry with model spectral energy distributions that include contributions from nebular and stellar continuum radiation as well as all nebular emission lines. Free parameters in this modeling procedure include redshift, stellar mass, extinction and metallicity. We find photometric redshifts that are consistent with for the vast majority of the sample. Moreover, the inferred stellar masses and ages are very similar, even though this model is based on a different stellar population synthesis model.
The implied star-formation rates (see Figure 6) may lead one to expect that these galaxies have significant 24m detections. However, we have verified that none of the 29 candidates in the GSD, which has very deep 24m from GOODS, is detected. A possible explanation for this is the presumably low metallicity, which would result is relatively small dust masses and, hence, low infrared luminosities.
The observed IRAC flux densities at 3.6 and 4.5 from GOODS and SEDS222GOODS and SEDS (Spitzer Extended Deep Survey) provide the deepest IRAC imaging ever obtained, an excellent probe of stellar populations at high redshift are in most cases – there are two exceptions – fully consistent with the expected flux densities for the bursts observed in the UV. In addition, the galaxies have the same sizes in the J and H bands, indicating that the spatial extent of the region from which the line emission originates roughly follows the stellar light. Hence, there is no evidence for underlying older stellar populations. However, we cannot rule out their existence: maximally old stellar populations have mass-to-light ratios that are up to times larger than those of the bursts, even in the near infrared.
If we assume a past star formation rate that is constant after averaging over Myr time scales we find upper limits for the mass in older stars that is the burst mass. The implied total stellar mass upper limits are then . This caveat notwithstanding, we assume in the remainder of this paper that there is no significant population of older stars in these galaxies, and that the observed bursts account for the total stellar mass. However, the bottom line is that the total stellar masses of these objects are well below , in the regime of dwarf galaxies.
| EELG2011 | RA (J2000) | DEC (J2000) | H | |||
|---|---|---|---|---|---|---|
| (deg) | (deg) | (AB) | () | () | ||
| GSD1 | 53.167064 | -27.858936 | 24.67 0.07 | 459 40 | -1.83 0.09 | 8.57 0.17 |
| GSD2 | 53.080345 | -27.850572 | 25.63 0.07 | 569 67 | -2.04 0.19 | 7.96 0.19 |
| GSD3 | 53.046020 | -27.837322 | 25.88 0.11 | 507 75 | -2.02 0.18 | 7.94 0.20 |
| GSD4 | 53.105087 | -27.819974 | 26.20 0.11 | 769 143 | -1.75 0.30 | 7.72 0.22 |
| GSD5 | 53.067508 | -27.773595 | 25.05 0.08 | 566 74 | -2.19 0.19 | 8.14 0.19 |
| GSD6 | 53.097499 | -27.763919 | 24.99 0.05 | 700 53 | -2.12 0.09 | 8.10 0.17 |
| GSD7 | 53.122127 | -27.759542 | 25.44 0.12 | 535 99 | -1.70 0.28 | 8.20 0.22 |
| GSD8 | 53.171936 | -27.759145 | 24.26 0.04 | 693 47 | -1.76 0.11 | 8.52 0.17 |
| GSD9 | 53.078754 | -27.750288 | 24.86 0.04 | 468 32 | -1.99 0.10 | 8.42 0.17 |
| GSD10 | 53.063690 | -27.745853 | 26.37 0.09 | 759 134 | -1.56 0.33 | 7.72 0.22 |
| GSD11 | 53.007499 | -27.741867 | 25.97 0.09 | 534 76 | -2.13 0.19 | 7.84 0.20 |
| GSD12 | 53.114612 | -27.721979 | 25.80 0.12 | 641 139 | -1.94 0.31 | 7.87 0.23 |
| GSD13 | 53.101516 | -27.720882 | 24.77 0.03 | 490 29 | -2.35 0.08 | 8.29 0.16 |
| GSD14 | 53.055908 | -27.718803 | 26.00 0.08 | 501 65 | -1.90 0.20 | 7.94 0.19 |
| GSD15 | 53.149536 | -27.710285 | 26.64 0.15 | 820 288 | -2.20 0.57 | 7.36 0.30 |
| GSD16 | 53.147617 | -27.707088 | 26.10 0.08 | 582 80 | -2.08 0.22 | 7.75 0.20 |
| GSD17 | 53.064220 | -27.706523 | 25.41 0.05 | 465 43 | -2.20 0.13 | 8.12 0.17 |
| GSD18 | 53.071292 | -27.705802 | 25.24 0.04 | 861 66 | -2.36 0.11 | 7.85 0.17 |
| GSD19 | 53.181976 | -27.705038 | 25.71 0.06 | 1002 245 | -2.18 0.41 | 7.72 0.23 |
| GSD20 | 53.140815 | -27.692390 | 26.23 0.10 | 496 82 | -1.83 0.26 | 7.88 0.21 |
| GSD21 | 53.100936 | -27.676704 | 24.76 0.10 | 935 139 | -0.95 0.28 | 8.54 0.21 |
| GSD22 | 53.118450 | -27.819919 | 26.76 0.13 | 870 198 | -1.88 0.36 | 7.41 0.24 |
| GSD23 | 53.077606 | -27.812795 | 26.81 0.17 | 1512 338 | -2.22 0.28 | 7.30 0.25 |
| GSD24 | 53.132972 | -27.740102 | 27.77 0.30 | 698 318 | -2.23 0.47 | 6.95 0.38 |
| GSD25 | 53.084388 | -27.727920 | 27.29 0.15 | 562 164 | -2.39 0.43 | 7.18 0.27 |
| GSD26 | 53.141502 | -27.724880 | 26.65 0.10 | 650 106 | -2.10 0.25 | 7.47 0.21 |
| GSD27 | 53.112579 | -27.707090 | 26.91 0.13 | 954 262 | -2.40 0.42 | 7.15 0.26 |
| GSD28 | 53.046119 | -27.705604 | 27.13 0.16 | 1009 293 | -2.14 0.45 | 7.16 0.28 |
| GSD29 | 53.139953 | -27.675138 | 27.79 0.21 | 1314 557 | -2.12 0.74 | 6.93 0.37 |
| UDS1 | 34.275299 | -5.274496 | 25.38 0.09 | 576 90 | -1.33 0.18 | 8.31 0.20 |
| UDS2 | 34.440769 | -5.262566 | 25.74 0.09 | 1081 147 | -1.41 0.17 | 7.99 0.20 |
| UDS3 | 34.482173 | -5.261399 | 25.28 0.08 | 507 95 | -1.88 0.24 | 8.23 0.20 |
| UDS4 | 34.268657 | -5.260064 | 25.44 0.10 | 614 83 | -1.53 0.14 | 8.18 0.19 |
| UDS5 | 34.426483 | -5.255770 | 25.69 0.11 | 701 95 | -1.66 0.10 | 7.99 0.20 |
| UDS6 | 34.428569 | -5.255318 | 25.10 0.07 | 731 86 | -2.12 0.13 | 8.04 0.18 |
| UDS7 | 34.325676 | -5.251743 | 24.32 0.04 | 656 43 | -1.59 0.05 | 8.58 0.17 |
| UDS8 | 34.314014 | -5.251047 | 26.44 0.17 | 728 153 | -1.39 0.20 | 7.77 0.24 |
| UDS9 | 34.382587 | -5.244620 | 25.94 0.09 | 478 64 | -1.82 0.14 | 8.03 0.19 |
| UDS10 | 34.263534 | -5.239433 | 25.48 0.07 | 541 64 | -1.84 0.14 | 8.13 0.18 |
| UDS11 | 34.311279 | -5.238957 | 26.36 0.10 | 735 94 | -2.43 0.12 | 7.42 0.19 |
| UDS12 | 34.473888 | -5.234232 | 24.15 0.03 | 713 42 | -1.72 0.05 | 8.57 0.16 |
| UDS13 | 34.318141 | -5.232299 | 25.35 0.07 | 716 68 | -2.12 0.08 | 7.95 0.18 |
| UDS14 | 34.481567 | -5.222499 | 25.69 0.11 | 602 96 | -2.30 0.15 | 7.81 0.20 |
| UDS15 | 34.371166 | -5.214803 | 25.45 0.09 | 843 111 | -1.35 0.15 | 8.14 0.19 |
| UDS16 | 34.482921 | -5.214187 | 25.39 0.08 | 662 87 | -1.80 0.15 | 8.07 0.19 |
| UDS17 | 34.247516 | -5.205330 | 25.95 0.10 | 469 63 | -2.22 0.13 | 7.89 0.19 |
| UDS18 | 34.315448 | -5.200902 | 25.83 0.13 | 739 136 | -1.87 0.17 | 7.84 0.21 |
| UDS19 | 34.298866 | -5.191800 | 26.25 0.15 | 543 106 | -1.94 0.17 | 7.79 0.23 |
| UDS20 | 34.232082 | -5.190388 | 25.16 0.06 | 648 55 | -2.20 0.06 | 8.03 0.17 |
| UDS21 | 34.308940 | -5.190090 | 25.15 0.07 | 609 66 | -2.28 0.11 | 8.03 0.18 |
| UDS22 | 34.416740 | -5.180443 | 26.34 0.19 | 1070 307 | -1.72 0.31 | 7.64 0.28 |
| UDS23 | 34.387023 | -5.177240 | 25.59 0.07 | 591 74 | -2.15 0.14 | 7.91 0.18 |
| UDS24 | 34.252845 | -5.176362 | 26.02 0.13 | 779 140 | -1.40 0.19 | 7.91 0.22 |
| UDS25 | 34.402145 | -5.175352 | 24.47 0.05 | 507 39 | -2.11 0.06 | 8.48 0.17 |
| UDS26 | 34.459190 | -5.174448 | 25.34 0.08 | 552 59 | -2.29 0.09 | 8.01 0.18 |
| UDS27 | 34.284194 | -5.164084 | 26.40 0.17 | 576 139 | -1.05 0.30 | 8.01 0.26 |
| UDS28 | 34.500236 | -5.155595 | 25.89 0.14 | 519 100 | -1.77 0.21 | 8.01 0.22 |
| UDS29 | 34.263267 | -5.152174 | 26.35 0.13 | 1003 150 | -1.90 0.11 | 7.57 0.21 |
| UDS30 | 34.477771 | -5.147521 | 25.66 0.14 | 533 103 | -0.65 0.21 | 8.50 0.22 |
| UDS31 | 34.296325 | -5.144416 | 25.95 0.12 | 546 88 | -2.17 0.14 | 7.81 0.20 |
| UDS32 | 34.419242 | -5.142892 | 25.83 0.12 | 721 138 | -1.69 0.21 | 7.91 0.22 |
| UDS33 | 34.246810 | -5.139120 | 26.06 0.11 | 553 85 | -1.54 0.19 | 7.99 0.20 |
| UDS34 | 34.371933 | -5.137272 | 24.83 0.05 | 586 50 | -2.73 0.08 | 8.01 0.17 |
| UDS35 | 34.314693 | -5.133675 | 26.42 0.21 | 1125 315 | -1.20 0.28 | 7.80 0.28 |
| UDS36 | 34.261756 | -5.134672 | 25.32 0.08 | 658 76 | -2.16 0.12 | 7.97 0.18 |
| UDS37 | 34.380569 | -5.268105 | 26.54 0.22 | 832 249 | -1.34 0.28 | 7.71 0.29 |
| UDS38 | 34.441444 | -5.215963 | 26.60 0.19 | 912 208 | -2.14 0.14 | 7.38 0.25 |
| UDS39 | 34.334854 | -5.177163 | 26.99 0.18 | 594 145 | -2.39 0.24 | 7.26 0.26 |
| UDS40 | 34.438095 | -5.160070 | 26.86 0.17 | 677 157 | -2.29 0.21 | 7.30 0.25 |
Note. — EELG2011: identification number prefixed by the respective field acronyms; RA/DEC: coordinates from the CANDELS catalogs; : -band AB magnitude from the CANDELS catalog; : rest-frame equivalent width inferred from the , , and broad-band photometry (see text for details); : continuum slope at rest-frame 2500 inferred from a linear fit to the , , and broad-band photometry; : stellar mass inferred from Starburst99 (Leitherer et al., 1999), as described in the text.
5. Discussion
5.1. Comparison with Other Samples
Galaxies with similar properties have previously been identified through broad-band photometry at in the Sloan Digital Sky Survey (Cardamone et al., 2009), and have been shown by Amorín et al. (2010) and Izotov et al. (2011) to constitute the most strongly star-forming and most metal poor tail of the well-known class of blue compact dwarf galaxies (e.g., Sargent & Searle, 1970; Thuan & Martin, 1981; Griffith et al., 2011), which have very low metallicities and extremely high, spatially concentrated star-formation activity (Guzman et al., 1998; Overzier et al., 2008).
Cowie et al. (2011) (also see Scarlata et al., 2009)) recently studied the Ly properties of high-EW H emitters, providing a direct connection between higher-redshift searches of Ly (e.g., Ouchi et al., 2008; Hu et al., 2010), and find Ly EWs ranging from 20 to 200. Combining this with the findings of Nilsson et al. (2011), who show that Ly emitters at are objects with a very wide range in properties, it is clear that from Ly emitters one cannot derive a complete description of star formation in low-mass galaxies. On the other hand, Ly emitters at higher redshifts () appear to be young, with small stellar masses (e.g., Finkelstein et al., 2009), similar to the emission line galaxies studied here.
Narrow-band surveys identified galaxies with strong [OIII] and H emission lines with at redshifts (e.g., Kakazu et al., 2007), demonstrated to be young and metal poor (Hu et al., 2009). Most notably, Atek et al. (2010) pointed out the existence of a class of emission line galaxies at with that would most likely be included in our sample as well. However, so far, their nature has not been described and their cosmological relevance in the context of galaxy formation has remained unclear. Therefore, let us now put these starbursting dwarf galaxies in a cosmological context.
5.2. Cosmological Context: Implications for the Formation of Dwarf Galaxies
Our sample with redshifts consists of 69 low-mass (), young (), extreme starbursting, presumably metal-poor galaxies. Their co-moving number density333the values for our two widely separate fields, UDS and GSD, differ by only 12% is , two orders of magnitude higher than that of nearby galaxies with similar EWs (Cardamone et al., 2009). The individual star formation rates and the number density combine into . This is a 2% contribution to the total star-formation rate density at occurring in galaxies that contribute perhaps to the total stellar mass density at that epoch (e.g., Karim et al., 2011).
Placing these detections in the context of the burst fraction among equally massive dwarf galaxies is difficult, however, since we cannot currently constrain their number density; galaxies without starbursts have older luminosity weighted ages and, as a consequence, are at least 2 magnitudes fainter than the starbursting galaxies. With marginal detections, even in the latest WFC3 data, and no obvious spectral features, their redshifts cannot easily be estimated. Model predictions differ strongly from observational measurements of the galaxy stellar mass function (Guo et al., 2011) and cannot be used to constrain the burst fraction among the population of low-mass galaxies.
Nevertheless, we can still gauge the importance of the observed burst for the formation of low-mass galaxies by making the reasonable (and testable) assumption that the observed bursts occur with the same frequency at all epochs – a period of 4 Gyr during which the cosmic star formation history peaked and after which the number density of starbursts declines as mentioned above. The basic indication that such bursts are important is that the number of stars produced in such bursts over a period of several Gyr is comparable to the number stars in present-day dwarf galaxies. Let us use this consideration to construct a simple toy model that relates the observations presented here to the mass function of present-day low-mass galaxies. Guo et al. (2011) use the data from Baldry et al. (2008) for the galaxies with masses down to , and their mass function can be represented by a simple power law for all galaxies with masses , that is, well below the knee of the Schechter (1976) function:
| (2) |
in units of .
Let us then express the stellar mass of the present-day descendants of the observed starbursting galaxies at in terms of the following star formation history:
| (3) |
where is the total stellar mass produced in a single starburst (the factor 2 is included to convert the observed burst age to its total duration), is the number of bursts that occurs in each galaxy over the 4 Gyr period between and , and is the fraction of the total stellar mass that is produced in such bursts – the rest is assumed to form in smaller bursts and/or a more quiescent mode of star formation.
Now we can predict the number of present-day descendants by dividing the number of observed bursts at by the duty cycle, that is, the fraction of the time that a bursts is occurring over the period of time that they can occur (here assumed to be , or 4 Gyr). This duty cycle is the ratio of the duration of a single burst ( Myr) and this 4 Gyr period, multiplied by the number of bursts per galaxy . Thus we have
| (4) |
where is the co-moving number density of the bursts observed at (, where we use the observed span in stellar masses of an order of magnitude – see Figure 6 – to introduce this differential unit).
According to Eqs. 2 and 4 the mass of the descendant, , is uniquely determined by the fraction of stars formed in bursts, . Equating (Eq. 4) and (Eq. 2), and substituting for (Eq. 3) we obtain, after rearranging terms:
| (5) |
Thus, if is close to unity, that is, almost all stars are formed in bursts, then we infer that each galaxy must undergo one or two bursts on average and that, therefore, . It is perhaps more realistic to adopt a smaller value for . If , we find that two or three bursts must occur in each galaxy, producing descendants with masses . The latter would imply a growth in stellar mass between and the present by at least a factor 3 given the mass constraints on the underlying populations of the observed starburst galaxies. Galaxy formation models suggest that the typical growth is indeed a factor of 3 or 4, but we should bear in mind that these models do not reproduce the observed co-moving number density evolution of low-mass galaxies with redshift (e.g., Guo et al., 2011). Therefore, these predictions should be treated with care.
Choosing very low () implies a very large growth in mass, with high-mass descendants (). Such growth by, say, more than an order of magnitude in mass seems unlikely in the context of current galaxy formation models. In particular, models are better observationally constrained for these higher masses and the prediction is that more massive galaxies () grow in mass by a factor 3 or 4, not by two orders of magnitude, between and the present (e.g., Kereš et al., 2009). Given these constraints, the general conclusion we can draw is that our observations suggest that many or most stars in present-day dwarf galaxies (with masses ) have formed in a small number of starbursts at .
The quantitative interpretation we offer here relies on our estimate of the characteristic burst duration (30 Myr). However, the uncertainty in this assumed burst duration does not affect our conclusion that intense starbursts at high redshift constitute an important phase in the mass buildup low-mass present-day galaxies.
If the bursts last significantly longer, which we deem unlikely, then the total mass formed in a burst will be larger than assumed above, while the frequency of the bursts will remain the same since our selection method is only sensitive to young bursts. As a result, the fraction of stars formed in bursts, will be larger than what we derived above.
Significantly shorter bursts (say, Myr, as allowed by the SB99 model – see Sec. 4.2) are also unlikely, as the bursts are spatially extended, and the implied crossing time in these systems is about 30 Myr. Nonetheless, in the case that burst times are short, the burst frequency must be higher to account for their observed number (Eq. 4), but the total mass produced in each burst remains the same (see Sec. 4.2). As a result, the number of bursts per galaxy () and, therefore, the fraction of stars formed in bursts () increase.
The main assumptions in our interpretation, then, are 1) that the descendants of the observed galaxies remain low-mass galaxies up to the present day ( in stars), and 2) that the observed bursts do not only occur at , but are equally frequent over a much broader redshift range (). The first assumption is supported by the understanding that more massive galaxies are not expected to grow in stellar mass by several orders of magnitude, as would be required if the descendants of the observed starbursting galaxies are much more massive. The second assumption is straightforward to test observationally by searches for similar objects over a wider redshift range.
5.3. Energy Budget and Core Formation
The most remarkable property of these galaxies are their growth rates (specific star formation rates) of . This is far outside the realm of normal, more massive star forming galaxies, which typically have (e.g., Karim et al., 2011).
The amount of energy deposited into the interstellar medium through winds and supernovae ( erg) exceeds the binding energy by an order of magnitude, even if the total mass is larger than the stellar mass by many factors. This implies that the gas that is fueling the starburst may be in the process of being blown out, resulting in the end of the starburst phase. Whether the gas will be blown out of the halo depends on the halo mass, which is currently unconstrained. If the gas does not leave the halo it may eventually once more cool and sink to the center of the potential well and trigger another starburst. Then, the observed bursts could be part of a semi-periodic cycle of star-formation activity, which is seen in simulations of low-mass galaxies (e.g., Stinson et al., 2007). Episodic star formation would also alleviate the difficulty of explaining the sudden occurence of such a large starburst in such small galaxies. If such starbursts are not cyclical, then another possible explanation, usually offered to explain the lack of star formation at early times in even less massive systems, is that star formation had been suppressed at earlier epochs as a result of UV background radiation (e.g., Babul & Rees, 1992; Babul & Ferguson, 1996).
An intriguing possibility is that if most of the gas is expelled from the central region, then the stars themselves could become unbound as well, dissolving the entire galaxy. Displacement of large amounts of material leads to changes in the potential, and if this happens at very short time scales, then even the dark matter profile can be altered. Outflows have long been argued to play a role in producing cored density profiles in low-mass galaxies (e.g., Navarro et al., 1996). The time scales, masses, and star-formation rates we derived above for the galaxies in our sample roughly meet the requirements for such a process to be efficient. Recently, Pontzen & Governato (2011) showed that episodic star formation, even with less intense bursts, can produce the same effect. What the previous and subsequent evolution of the systems we observed is remains to be seen, but the energy balance and the possibility that such bursts are reoccurring make our observations consistent with this general picture; indeed outflows may be responsible for the formation of flattened dark matter profiles in low mass galaxies. These speculative scenarios can be tested further with observational constraints on the gas masses and hydrodynamical modeling of these systems.
6. Summary
Our discovery of an abundant galaxy population at with extremely high emission line equivalent widths implies that many high-redshift, low-mass galaxies form many of their stars in extreme starbursts. We propose that we have observed an important formation mode for dwarf galaxies: a small number of strong starbursts that occur at early epochs () each form in stars in a very short time span ( Myr) to build up the bulk of the stellar components of present-day dwarf galaxies. This is in quantitative agreement with ’archaeological’ studies of present-day dwarf galaxies, which have shown that their star formation histories are burst-like and that the ages of their stellar populations suggest formation redshifts (e.g., Weisz et al., 2011). Under the reasonable assumption based on CDM predictions for galaxy grwoth that the observed galaxies grow in mass by less than an order of magnitude up to the present day, our observations provide direct evidence for such an early formation epoch and, in particular, that short-lived bursts contribute much or even the majority of star formation in dwarf galaxies.
Facilities: HST(ACS,WFC3), VLT(VIMOS), Spitzer(IRAC)
References
- Amorín et al. (2010) Amorín, R. O., Pérez-Montero, E., & Vílchez, J. M. 2010, ApJ, 715, L128
- Atek et al. (2010) Atek, H., et al. 2010, ApJ, 723, 104
- Babul & Ferguson (1996) Babul, A., & Ferguson, H. C. 1996, ApJ, 458, 100
- Babul & Rees (1992) Babul, A., & Rees, M. J. 1992, MNRAS, 255, 346
- Baldry et al. (2008) Baldry, I. K., Glazebrook, K., & Driver, S. P. 2008, MNRAS, 388, 945
- Bertin & Arnouts (1996) Bertin, E., & Arnouts, S. 1996, A&AS, 117, 393
- Bouwens et al. (2008) Bouwens, R. J., Illingworth, G. D., Franx, M., & Ford, H. 2008, ApJ, 686, 230
- Calzetti et al. (2000) Calzetti, D., Armus, L., Bohlin, R. C., Kinney, A. L., Koornneef, J., & Storchi-Bergmann, T. 2000, ApJ, 533, 682
- Calzetti et al. (1997) Calzetti, D., Meurer, G. R., Bohlin, R. C., Garnett, D. R., Kinney, A. L., Leitherer, C., & Storchi-Bergmann, T. 1997, AJ, 114, 1834
- Cardamone et al. (2009) Cardamone, C., et al. 2009, MNRAS, 399, 1191
- Chabrier (2003) Chabrier, G. 2003, PASP, 115, 763
- Cowie et al. (2011) Cowie, L. L., Barger, A. J., & Hu, E. M. 2011, ApJ, 738, 136
- Dolphin et al. (2005) Dolphin, A. E., Weisz, D. R., Skillman, E. D., & Holtzman, J. A. 2005, arXiv:astro-ph/0506430
- Finkelstein et al. (2009) Finkelstein, S. L., Rhoads, J. E., Malhotra, S., & Grogin, N. 2009, ApJ, 691, 465
- Finkelstein et al. (2011) Finkelstein, S. L., et al. 2011, ApJ, 729, 140
- Genzel et al. (2011) Genzel, R., et al. 2011, ApJ, 733, 101
- Giavalisco et al. (2004) Giavalisco, M., et al. 2004, ApJ, 600, L93
- Grebel (1997) Grebel, E. K. 1997, Reviews in Modern Astronomy, 10, 29
- Griffith et al. (2011) Griffith, R. L., et al. 2011, ApJ, 736, L22
- Grogin et al. (2011) Grogin, N. A., et al. 2011, arXiv:1105.3753
- Guo et al. (2011) Guo, Q., et al. 2011, MNRAS, 413, 101
- Guzman et al. (1998) Guzman, R., Jangren, A., Koo, D. C., Bershady, M. A., & Simard, L. 1998, ApJ, 495, L13
- Harris et al. (2004) Harris, J., Calzetti, D., Gallagher, J. S., III, Smith, D. A., & Conselice, C. J. 2004, ApJ, 603, 503
- Häussler et al. (2007) Häussler, B., et al. 2007, ApJS, 172, 615
- Hu et al. (2010) Hu, E. M., Cowie, L. L., Barger, A. J., Capak, P., Kakazu, Y., & Trouille, L. 2010, ApJ, 725, 394
- Hu et al. (2009) Hu, E. M., Cowie, L. L., Kakazu, Y., & Barger, A. J. 2009, ApJ, 698, 2014
- Ilbert et al. (2010) Ilbert, O., et al. 2010, ApJ, 709, 644
- Izotov & Thuan (2008) Izotov, Y. I., & Thuan, T. X. 2008, ApJ, 687, 133
- Izotov et al. (2011) Izotov, Y. I., Guseva, N. G., & Thuan, T. X. 2011, ApJ, 728, 161
- Kakazu et al. (2007) Kakazu, Y., Cowie, L. L., & Hu, E. M. 2007, ApJ, 668, 853
- Karim et al. (2011) Karim, A., et al. 2011, ApJ, 730, 61
- Kennicutt (1998) Kennicutt, R. C., Jr. 1998, ARA&A, 36, 189
- Kereš et al. (2009) Kereš, D., Katz, N., Davé, R., Fardal, M., & Weinberg, D. H. 2009, MNRAS, 396, 2332
- Koekemoer et al. (2011) Koekemoer, A. M., et al. 2011, arXiv:1105.3754
- Labbé et al. (2010) Labbé, I., et al. 2010, ApJ, 716, L103
- Laidler et al. (2007) Laidler, V. G., et al. 2007, PASP, 119, 1325
- Lee (2008) Lee, J. C. 2008, Formation and Evolution of Galaxy Disks, 396, 109
- Lee et al. (2009) Lee, J. C., Kennicutt, R. C., José G. Funes, S. J., Sakai, S., & Akiyama, S. 2009, ApJ, 692, 1305
- Leitherer et al. (1999) Leitherer, C., et al. 1999, ApJS, 123, 3
- Mas-Hesse & Kunth (1999) Mas-Hesse, J. M., & Kunth, D. 1999, A&A, 349, 765
- Marchesini et al. (2009) Marchesini, D., van Dokkum, P. G., Förster Schreiber, N. M., Franx, M., Labbé, I., & Wuyts, S. 2009, ApJ, 701, 1765
- Mateo (1998) Mateo, M. L. 1998, ARA&A, 36, 435
- McLure et al. (2010) McLure, R. J., Dunlop, J. S., Cirasuolo, M., Koekemoer, A. M., Sabbi, E., Stark, D. P., Targett, T. A., & Ellis, R. S. 2010, MNRAS, 403, 960
- McQuinn et al. (2009) McQuinn, K. B. W., Skillman, E. D., Cannon, J. M., Dalcanton, J. J., Dolphin, A., Stark, D., & Weisz, D. 2009, ApJ, 695, 561
- Nagamine (2010) Nagamine, K. 2010, Advances in Astronomy, 2010, 16
- Navarro et al. (1996) Navarro, J. F., Eke, V. R., & Frenk, C. S. 1996, MNRAS, 283, L72
- Nilsson et al. (2011) Nilsson, K. K., Östlin, G., Møller, P., Möller-Nilsson, O., Tapken, C., Freudling, W., & Fynbo, J. P. U. 2011, A&A, 529, A9
- Oesch et al. (2010) Oesch, P. A., et al. 2010, ApJ, 709, L16
- Ono et al. (2010) Ono, Y., Ouchi, M., Shimasaku, K., Dunlop, J., Farrah, D., McLure, R., & Okamura, S. 2010, ApJ, 724, 1524
- Ouchi et al. (2008) Ouchi, M., et al. 2008, ApJS, 176, 301
- Overzier et al. (2008) Overzier, R. A., et al. 2008, ApJ, 677, 37
- Pelupessy et al. (2004) Pelupessy, F. I., van der Werf, P. P., & Icke, V. 2004, A&A, 422, 55
- Pontzen & Governato (2011) Pontzen, A., & Governato, F. 2011, arXiv:1106.0499
- Salzer et al. (2002) Salzer, J. J., Rosenberg, J. L., Weisstein, E. W., Mazzarella, J. M., & Bothun, G. D. 2002, AJ, 124, 191
- Salzer et al. (2005) Salzer, J. J., Lee, J. C., Melbourne, J., Hinz, J. L., Alonso-Herrero, A., & Jangren, A. 2005, ApJ, 624, 661
- Sargent & Searle (1970) Sargent, W. L. W., & Searle, L. 1970, ApJ, 162, L155
- Scarlata et al. (2009) Scarlata, C., et al. 2009, ApJ, 704, L98
- Schaerer et al. (1999) Schaerer, D., Contini, T., & Kunth, D. 1999, A&A, 341, 399
- Schaerer & de Barros (2009) Schaerer, D., & de Barros, S. 2009, A&A, 502, 423
- Schechter (1976) Schechter, P. 1976, ApJ, 203, 297
- Schmidt (1959) Schmidt, M. 1959, ApJ, 129, 243
- Shen et al. (2008) Shen, Y., Greene, J. E., Strauss, M. A., Richards, G. T., & Schneider, D. P. 2008, ApJ, 680, 169
- Springel et al. (2005) Springel, V., et al. 2005, Nature, 435, 629
- Stinson et al. (2007) Stinson, G. S., Dalcanton, J. J., Quinn, T., Kaufmann, T., & Wadsley, J. 2007, ApJ, 667, 170
- Straughn et al. (2008) Straughn, A. N., et al. 2008, AJ, 135, 1624
- Straughn et al. (2009) Straughn, A. N., et al. 2009, AJ, 138, 1022
- Straughn et al. (2011) Straughn, A. N., et al. 2011, AJ, 141, 14
- Thornley et al. (2000) Thornley, M. D., Schreiber, N. M. F., Lutz, D., Genzel, R., Spoon, H. W. W., Kunze, D., & Sternberg, A. 2000, ApJ, 539, 641
- Thuan & Martin (1981) Thuan, T. X., & Martin, G. E. 1981, ApJ, 247, 823
- Tremonti et al. (2001) Tremonti, C. A., Calzetti, D., Leitherer, C., & Heckman, T. M. 2001, ApJ, 555, 322
- Trump et al. (2011) Trump, J. R., Weiner, B. J., Scarlata, C., et al. 2011, arXiv:1108.6075
- Weisz et al. (2011) Weisz, D. R., Dalcanton, J. J., Williams, B. F., et al. 2011, ApJ, 739, 5
- Windhorst et al. (2011) Windhorst, R. A., et al. 2011, ApJS, 193, 27