Kneelike structure in the spectrum of the heavy component of cosmic rays observed with KASCADE-Grande
Abstract
We report the observation of a steepening in the cosmic ray energy spectrum of heavy primary particles at about eV. This structure is also seen in the all-particle energy spectrum, but is less significant. Whereas the ‘knee’ of the cosmic ray spectrum at -eV was assigned to light primary masses by the KASCADE experiment, the new structure found by the KASCADE-Grande experiment is caused by heavy primaries. The result is obtained by independent measurements of the charged particle and muon components of the secondary particles of extensive air showers in the primary energy range of to eV. The data are analyzed on a single-event basis taking into account also the correlation of the two observables.
pacs:
98.70.Sa, 95.85.Ry, 96.50.SdThe determination of the primary energy and composition in the energy range from eV up to above eV has been subject of earthbound experiments for more than five decades. It has been shown that the high-energy all-particle spectrum has a power-law like behavior (, ), with features known as the ‘knee’ at -eV and the ‘ankle’ at -eV, respectively. Whereas at the knee the spectrum steepens (-), the ankle is characterized by a flattening of the spectrum (-). The KASCADE experiment has shown that the knee is due to a distinct decrease in the flux of primaries with light mass () kas-muo ; kas-unf . Many astrophysical models commenting on the origin of the knee assume a dependence of such break-offs (‘knees’) on the charge of the primary nuclei peters ; hoera . Assuming that the knee is related to a break in the spectrum of primary Hydrogen nuclei, a knee-like structure in the spectrum of the heavy component ( up to Iron nuclei) is expected in the energy range from about eV to about eV. So far, such a structure has not been observed experimentally. We present measurements of extensive air showers (EAS) in the primary energy range of eV to eV performed with KASCADE-Grande (KArlsruhe Shower Core and Array DEtector with Grande extension) and investigate the mass composition of the cosmic rays.
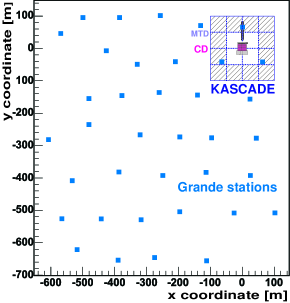
KASCADE-Grande, located at 49.1∘N, 8.4∘E, 110 m a.s.l., consists of the Grande array with 37 stations of 10 m2 scintillation detectors each, spread over an area of m2, the original KASCADE array covering m2 with unshielded and shielded detectors, a muon tracking device, and a large calorimeter kg-NIM10 ; kascade . This multi-detector system allows us to investigate in detail the EAS generated by high-energy primary cosmic rays in the atmosphere. For the present analysis, the estimation of energy and mass of the primary particles is based on the combined measurement of the charged particle component by the detector array of Grande and the muon component by the KASCADE muon array (Fig. 1). Basic shower observables like the core position, zenith angle, and total number of charged particles (shower size ) are derived from the measurements of the Grande stations. While the Grande detectors are sensitive to charged particles, the muonic component is measured independently by the shielded detectors of the KASCADE array. 192 scintillation detectors of m2 sensitive area each are placed below an iron and lead absorber to select muons above 230 MeV kinetic energy. A core position resolution of m, a direction resolution of , and a resolution of the shower size of about % are achieved. The total number of muons () with a resolution of about % is calculated by combining the core position determined by the Grande array and the muon densities measured at the KASCADE array, where undergoes a correction for a bias in reconstruction due to the asymmetric position of the detectors kg-NIM10 .
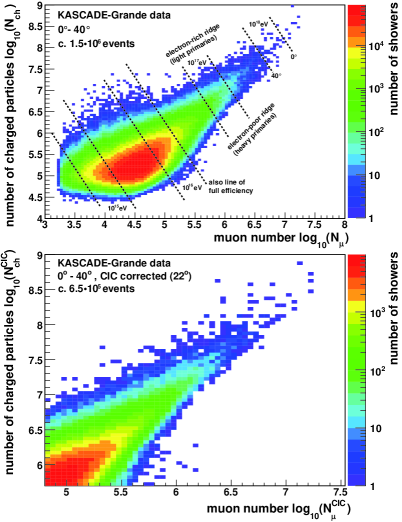
The present analysis is based on 1173 days of data taking. The cuts on the sensitive area (EAS core reconstructed within the array) and zenith angle (), chosen to assure best and constant reconstruction accuracies, result in an exposure of mssr. Figure 2 displays the correlation of the two observables and . This distribution is the basis of the following analysis, since it contains all the experimental information required for reconstructing energy and mass of the cosmic rays: the higher the energy of the primary cosmic ray the larger the total particle number. The fraction of muons of all charged particles at observation level is characteristic for the primary mass: showers induced by heavy primaries start earlier in the atmosphere and the higher nucleon number leads to a relatively larger muon content at observation level. KASCADE-Grande measures the particle number at an atmospheric depth well beyond the shower maximum, where the electromagnetic component already becomes reduced. Thus, electron-rich EAS are generated preferentially by light primary nuclei and electron-poor EAS by heavy nuclei, respectively.
However, a straightforward analysis is hampered by the shower-to-shower fluctuations, i.e. by the dispersion of the muon and electromagnetic particle numbers for a fixed primary mass and energy. In addition, cosmic rays impinging on the atmosphere under different zenith angles show a varying, complicated behavior due to the non-uniform mass and density distribution of the air. Therefore, the absolute energy and mass scale have to be inferred from comparisons of the measurements with Monte Carlo simulations. This creates additional uncertainties, since the physics of the relevant particle interactions is not completely tested by man-made accelerator experiments. The uncertainties imposed by the hadronic interaction models are more relevant for composition analyses than for energy measurements. Hence, our strategy is to separate the measured EAS in electron-poor and electron-rich events as representatives of the heavy and light primary mass groups, similar to the analysis presented in Ref. kas-muo . The shape and structures of the resulting energy spectra of these individual mass groups are much less affected by the differences of the various hadronic interaction models than the relative abundance.
As a consequence of the considerations above, the energy and mass assignment of individual events is achieved by using both observables and , as well as their correlation. The following equation is motivated by discussions of hadronic air showers in reference matthews , with the basic idea that the total number of secondary particles at observation level is related to the primary energy while the energy sharing between the electromagnetic and the hadronic (i.e. muonic) shower components is related to the primary mass. Therefore, the primary energy is assumed to be proportional to the shower size with a correction factor that accounts for the mass dependence by making use of the measured ratios of shower sizes :
| (1) | |||||
| (2) |
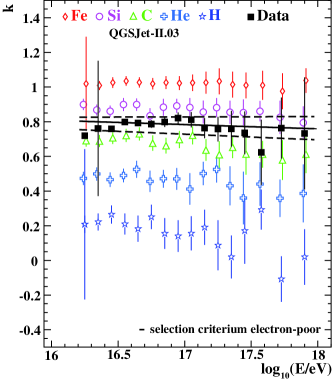
with . The parameter takes into account both the average differences in the ratio among different primaries with same as well as the shower to shower fluctuations for events of the same primary mass. The exact form of the equation is optimized for the experimental situation of KASCADE-Grande and the free parameters espec are determined by Monte Carlo simulations 555Simulations include the full air shower development in the atmosphere and the response of the detector geant . The EAS were generated using CORSIKA cors and the models FLUKA fluka and QGSJet II.03 qgs in the energy range from eV to eV for five different representative mass groups: H, He, C, Si and Fe with about events per primary.. They are defined independently for 5 different zenith angle intervals of equal exposure (the upper limits of are , , , , and ) to take into account the shower attenuation. Data are combined only at the very last stage to reconstruct the final energy spectrum. The --correlation of individual events is incorporated in calculating , which serves now as mass sensitive observable. Fig. 3 shows the evolution of as a function of the reconstructed energy for the first two zenith angle bins, where a similar behavior is observed for all angular ranges. The error bars include statistical as well as reconstruction uncertainties of the -parameter. The width of the distributions decreases slightly for increasing energy and amounts, at PeV, to about , , for H, Fe and data, respectively.
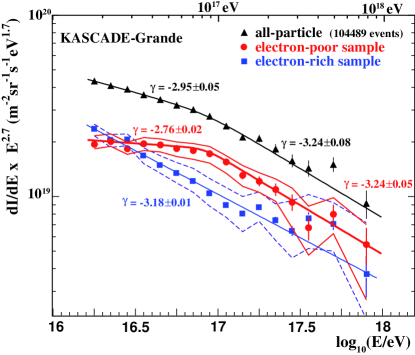
The -parameter is used to separate the events into different samples. The line in Fig. 3 separates the electron-poor (heavy) group, and is defined by fitting the distribution. The dashed lines represent the uncertainties in defining this energy dependent selection cut. The resulting spectra are shown in Fig. 4, where the band indicates changes of the spectra when the cut is varied within the dashed lines shown in Fig. 3. The energy resolution for an individual event is better than 25% over the entire energy range and the all-particle spectrum is reconstructed within a total systematic uncertainty in flux of 10-15% espec 666The resulting spectra for the present analysis are not corrected for reconstruction uncertainties. But, more detailed investigations espec have shown that the effects are smaller than the estimated uncertainty on the flux of 10-15%. In addition, the absolute energy scale depends on the used hadronic interaction model, e.g. for EPOS v1.99 epos a 10-15% lower flux in the all-particle spectrum is obtained..
The reconstructed spectrum of the electron-poor events shows a distinct knee-like feature at about eV. Applying a fit of two power laws to the spectrum interconnected by a smooth knee bayes02 results in a statistical significance of that the entire spectrum cannot be fitted with a single power law. The change of the spectral slope is from to with the break position at . Applying the same function to the all-particle spectrum results in a statistical significance of only that a fit of two power laws is needed to describe the spectrum. Here the change of the spectral slope is from to , but with the break position again at . Hence, the selection of heavy primaries enhances the knee-like feature that is already present in the all-particle spectrum. The spectrum of the electron-rich events (light and medium mass primaries) is compatible with a single power law with slope index . However, a recovery to a harder spectrum at energies well above eV cannot be excluded by the present data. This finding is of particular interest and needs more detailed investigations with improved statistics in future.
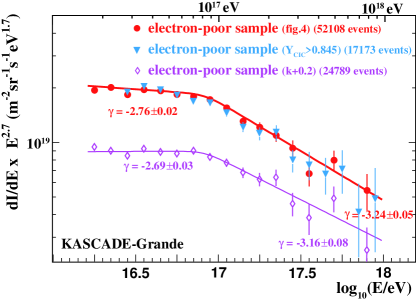
The main result, i.e. the knee-like structure in the spectrum of electron-poor events, is validated in the following by various cross-checks (Fig. 5). Variations of the slopes of the selection cut, as well as parallel shifts of the cut lines have shown that the spectral form, i.e. the knee-like structure of the electron-poor event sample, is retained. By shifting to larger values the fraction of heavy primaries in the sample is enriched. Interestingly, we found that the slope index of the spectrum is not significantly changing beyond the break, but gets systematically harder at lower energies . The position of the break remains constant, indicating that the heaviest primaries in the sample dominate the spectral form. An example of a spectrum obtained by such a variation of the selection cut is shown in Fig. 5.
A systematic uncertainty possibly affecting the interpretation of the data is related to the attenuation of the particle numbers in the atmosphere. So far, the attenuation given by the EAS simulations is taken into account. For validation, an independent analysis is performed where the correction for attenuation, i.e. for the zenith angular dependence, is based on the measured events, and not on simulations. The correction parameters are obtained by applying the Constant Intensity Cut Method (CIC) CIC to the two observables independently. This procedure allows the data collected from different zenith angles to be combined in a model independent way. The shower size ratio is calculated, where and are the shower sizes corrected for attenuation effects in the atmosphere in such a way that they correspond to the shower sizes at a certain reference zenith angle. In order to check, in addition to the attenuation correction, also reconstruction and selection uncertainties, we applied for this analysis more stringent cuts, which increase the energy threshold and decrease the statistics of the event sample compared to the standard analysis. Now, is used to separate the events into electron-rich and electron-poor subsamples. In contrast to the -parameter, the -parameter is almost energy independent, where the energy of the individual events is again determined using eqn. 1. For direct comparison with the results obtained before, is chosen for selecting the electron-poor event sample. The reconstructed spectrum (see Fig. 5) obviously confirms the earlier finding of the knee-like structure, which is due to a decrease in the flux of the heavy component.
Another source of systematic uncertainty is related to the hadronic interaction model. In the frame of QGSJet-II, the measured distributions in and are in agreement with a dominant electron-poor composition for the entire energy range. Whereas the and values themselves behave differently for other hadronic interaction models, the measured and simulated - and -dependences on energy, and hence the shapes and structures of the resulting spectra, are similar 777First analyses based on simulations with the hadronic interaction model EPOS v1.99 epos have confirmed the findings of the knee-like feature in the spectrum of the heavy component for both analysis approaches, though the relative abundance of the subsamples change considerably.. Details will be discussed in a forthcoming paper, but it is not expected that the basic result of the present analysis changes.
Summarizing, by dividing KASCADE-Grande measured air-shower events in electron-rich and electron-poor subsamples, there is first evidence that at about eV the spectrum of the heavy component of primary cosmic rays shows a knee-like break. The spectral steepening occurs at an energy where the charge dependent knee of primary iron is expected, when the knee at about -eV is assumed to be caused by a decrease in the flux of primary protons.
The authors would like to thank the members of the engineering and technical staff of the KASCADE-Grande collaboration, who contributed to the success of the experiment. KASCADE-Grande is supported by the BMBF of Germany, the MIUR and INAF of Italy, the Polish Ministry of Science and Higher Education (grant for the years 2009-2011), and the Romanian Authority for Scientific Research UEFISCDI, (grants PNII-IDEI code 1442/2008 and PN 09 37 01 05). JC.A., A.H. and M.F. acknowledge partial support from the DAAD-Proalmex program (2009-10), JC.A. from CONACYT and the Consejo de la Investigación Científica of the Universidad Michoacana.
References
- (1) T. Antoni et al. (KASCADE Collaboration), Astrop. Phys. 16 (2002) 373.
- (2) T. Antoni et al. (KASCADE Collaboration), Astrop. Phys. 24 (2005) 1.
- (3) B. Peters, Nuovo Cimento 22 (1961) 800.
- (4) J.R. Hoerandel, Astrop. Phys. 21 (2004) 241.
- (5) W.-D. Apel et al. (KASCADE-Grande Collaboration), NIM A 620 (2010) 202.
- (6) T. Antoni et al. (KASCADE Collaboration), NIM A 513 (2003) 429.
- (7) J. Matthews, Astrop. Phys. 22 (2005) 387.
- (8) M. Bertaina et al. (KASCADE-Grande Collaboration), Astrophys. Space Sci. Trans. 7 (2011) 229.
- (9) CERN, GEANT 3.21, Detector Description and Simulation Tool CERN Program Library Long Writeup W5015 (1993).
- (10) D. Heck et al., Report FZKA 6019, Forschungszentrum Karlsruhe (1998).
- (11) A. Fassò et al., Report CERN-2005-10, INFN/TC-05/11, SLAC-R-773 (2005).
- (12) S.S. Ostapchenko, Nucl. Phys. B (Proc. Suppl.) 151 (2006) 143&147; S. Ostapchenko, Phys. Rev. D 74 (2006) 014026.
- (13) T. Antoni et al. (KASCADE Collaboration), Astrop. Phys. 16 (2002) 245.
- (14) J. Hersil et al., Phys. Rev. Lett. 6 (1961) 22.; D.M. Edge et al., J. Phys. A: Math. Nucl. Gen. 6 (1973) 1612.
- (15) K. Werner, F.M. Liu, T. Pierog, Phys. Rev. C 74 (2006) 044902.