Dark matter merging induced turbulence as an efficient engine for gas cooling
Abstract
We have performed a cosmological numerical simulation of primordial baryonic gas collapsing onto a M⊙ dark matter (DM) halo. We show that the large scale baryonic accretion process and the merger of few M⊙ DM halos, triggered by the gravitational potential of the biggest halo, is enough to create super sonic () shocks and develop a turbulent environment. In this scenario the post shocked regions are able to produced both H2 and HD molecules very efficiently reaching maximum abundances of and , enough to cool the gas below 100K in some regions. The kinetic energy spectrum of the turbulent primordial gas is close to a Burgers spectrum, , which could favor the formation of low mass primordial stars. The solenoidal to total kinetic energy ratio is for a wide range of wave numbers; this value is close to natural equipartition energy value of a random turbulent flow. In this way turbulence and molecular cooling seem to work together in order to produce potential star formation regions of cold and dense gas in primordial environments. We conclude that both the mergers and the collapse process onto the main DM halo provide enough energy to develop super sonic turbulence which favor the molecular coolants formation: this mechanism, which could be universal and the main route toward formation of the first galaxies, is able to create potential star forming regions at high redshift.
keywords:
galaxies: formation — large-scale structure of the universe — stars: formation — turbulence.1 Introduction
In the currently accepted paradigm to describe the universe, LCDM, the formation of bound dark matter structures takes place via hierarchical growth. While this build up is driven by dark matter accretion onto an already virialized dark matter halo, the process of merging is equally important. The effect of dark matter mergers in building up the dark matter halo has been studied in enormous detail both numerically and analytically. Due to new hydrodynamical simulations that have achieved enough resolution, the effect of merging of baryons is being taken into account, including also the important process of transfer of baryonic matter between dark matter merging halos.
One aspect of merging that has not been studied in detail is the development of (supersonic) turbulence in the merging halos due entirely to the dark matter merging process and its consequent effect on the environment. The current paradigm to power turbulence in the interstellar medium is mainly through the process of SN explosions (Norman & Ferrara, 1996). However, it is possible that the dark matter merging process itself does power the initial phase of turbulence and thus star formation.
Using numerical simulations from cosmological initial condition Wise & Abel (2007) and Greif et al. (2008) have discussed the generation of turbulent motions in primordial gas through the virialization process of halos of mass M⊙ and M⊙, respectively. They have shown that supersonic turbulent motions, which partially ionize the primordial gas allow an efficient formation of H2 and HD molecules and efficient cooling to a gas temperature below K in some regions. They have argued that these turbulent low temperature regions could be sites of efficient star formation.
The result of Greif et al. (2008) is somehow different from the conclusions of Johnson & Bromm (2006) who have analytically shown that in order to ionize the primordial gas through the DM virialization process a halo mass above M⊙ is needed. This apparent contradiction is easily understood because Johnson & Bromm (2006) took into account the fixed halo average circular velocity for the velocity shock waves instead a velocity distribution for primordial gas (which can take values higher and lower than the average circular velocity). Summarizing, Greif et al. (2008) have shown that the DM virialization process of halos with mass M⊙ can generate a supersonic turbulent media (triggered by both hot and cold gas accretion) where coolants (H2 and HD molecules) are generated efficiently. However, despite of the interesting insights on the development of turbulence in cosmological simulations of primordial gas made by the simulation mentioned above, their authors have not pay attention on the impact of the halo merger process as a turbulence inductor and they have related the onset of turbulence just with the gas accretion onto the DM halos.
On the other hand, Wise & Abel (2007) mentioned that the minor and major mergers are able to produce turbulence by Kelvin-Helmholtz instabilities, as well as by gas accretion. Despite of this mention, the both studies mentioned above neither characterize the turbulence with power spectrum in protogalaxy environments nor characterize the gas conditions with probability distribution functions in order to have a clear idea about the primordial gas conditions inside the first protogalaxies. No previous study has ever done this in such kind of environments, therefore we believe our study brings many new results to the field.
In the last years there have been a number of works studying the development of turbulence under isothermal and non isothermal conditions. A very interesting aspect of supersonic gas turbulence is the effect of the gas dynamic on the gas chemistry (mainly on the formation of gas coolants). Milosavljevic et al. (2011) have shown that compressive forcing turbulence produces H2 formation faster than in the solenoidal forcing case. This behavior is explained by these authors due to the broader compressive forcing density PDF which creates more H2 molecules at initial times. The results of Milosavljevic et al. (2011) could be placed in a cosmological context and argue that if a DM halo is able to produce enough compressive supersonic turbulent motions it is possible to produce a large amount of molecules and cool down the primordial gas very efficiently.
In this paper we investigate in detail how turbulence is generated by both mini DM halo merging and gas collapse using a cosmological size simulation. We characterize the gas physical conditions computing probability distribution functions of gas (density, temperature and velocity) and the gas velocity power spectrum of this cosmological simulation, which is an study not done and can be useful for idealized primordial star formation simulations. We follow the merging process in detail and investigate the onset of a turbulent medium inside the merging halos, including very small mass halos (). The most interesting findings of our work are that merging does indeed power turbulence, but most interesting is that it enhances significantly the coolants in the primordial gas, thus significantly lowering the temperature of the primordial gas, even below K in some regions. Furthermore, we found that the velocity power spectrum is nearby a Burgers spectrum and the solenoidal to total kinetic energy ratio is nearby 2/3 as found in idealized random fluids simulations.
The merger inducing turbulence process can be universal and can also take place at lower redshift, thus powering the initial phases of star formation in merging halos. The paper is structured as follows: in § 2 we describe the methodology and follow in § 3 with our main results and analysis. We continue with a discussion of our results in § 4 and conclude and summarize in § 5.
2 Methodology
We used the adaptive mesh refinement (AMR) code RAMSES (Teyssier, 2002) with a modified non-equilibrium cooling module with 21 species (including H2, HD, and LiH molecules with their cooling functions) in order to follow the chemo-thermal evolution of primordial gas and to study the gas gravitational collapse process in pristine environments (Prieto, Infante, & Jimenez, 2008). All chemical reaction rates were taken from Stancil et al. (1996), Galli & Palla (1998), and Glover & Abel (2008).
We worked in a concordance CDM cosmological model: , , , , and . The dynamical initial conditions were taken from mpgrafic (Prunet et al., 2008) and the initial chemical abundances were taken from Galli & Palla (1998) at (the initial redshift of the simulation).
We first simulated a volume of (1 Mpc/h)3 of only DM, with 2563 particles. Using the HOP algorithm (Eisenstein & Hut, 1998), we identified a M⊙ halo at . In order to better resolve the formation of that halo and to study its baryon component, we re-simulated the same (1Mpc/h)3 volume with 5123 particles (with a particle mass of approximately 800M⊙), including gas with non-equilibrium primordial chemistry from the beginning of the simulation at z=120. The gas dynamics was computed on a root grid of 643 computational zones, which was geometrically refined towards the center, increasing the spatial resolution by a factor of two within the central 1/8 of the volume. This refinement criterion was applied three times, generating 4 nested meshes (including the root grid), each with 643 computational cells.
Inside the innermost 643 mesh, the gas dynamics was computed using seven extra levels of adaptive mesh refinement by a factor of two. This adaptive refinement was based on four different criteria: i) Lagrangian refinement based on the number density of DM particles (a finer refinement level is created in cells containing more than 4 DM particles), ii) Lagrangian refinement based on the baryonic mass density, iii) refinement based on the gas pressure gradient (for ), and iv) refinement based on the Jeans’ length, to satisfy Truelove’s condition (Truelove et al., 1997). The pressure gradient criterion was included in order to better resolve the turbulent flow, as discussed in Kritsuk et al. (2006). The three geometrical refinement levels, plus the additional seven adaptive refinement levels, give an effective spatial resolution corresponding to that achieved by a uniform mesh of computational elements, and corresponding to a proper size of 1.95pc at .
This setup was used from the beginning of the simulation, at , until . At , another geometrical refinement criterion was added (while maintaining the others): Uniform spatial resolution till level 15 was imposed around the densest central region of the halo, creating a uniform mesh of 5123 elements which was refined with a Jeans criteria till level 16 (due to technical reasons the uniform refinement criteria was imposed gradually and it was completed at z=30). This high refinement region, covering a proper size of 2.0 kpc at , served the purpose of better resolving the generation of turbulent motions in the central region of the halo. The results presented in this work are based on the analysis of this central 2.0kpc region at the end of the simulation at .
3 Results and Analysis
The simulation presented in this work follows the baryonic matter accretion process onto a M⊙ (hereafter the main halo) with K and km/s.
At the main halo is crossed by two interacting DM minihalos of M⊙. These two interacting minihalos merge and create a spinning baryonic over-density going out the main halo central region. Due to this violent merging process the gas develops a shock wave which increases the free electron fraction. The post shocked gas develops turbulence and creates H2 and HD molecules very efficiently behind the merged over-density.
After the merging process the main halo continues accreting gas mainly by filamentary flows. The accretion process heats up the gas till K and accelerates it developing super sonic shocks. Near , at the densest main halo central regions the post shocked primordial gas has created a lot of both H2 and HD molecules in a very efficient way. Furthermore, due to the compressional turbulent motions triggered by the roughly radial collapse, the molecular formation is enhanced as well. Because of the molecular formation process the turbulent gas can reach temperatures even below 100 K in some regions and it is able to form potential star formation regions of dense gas (cm-3) at low temperatures (K).
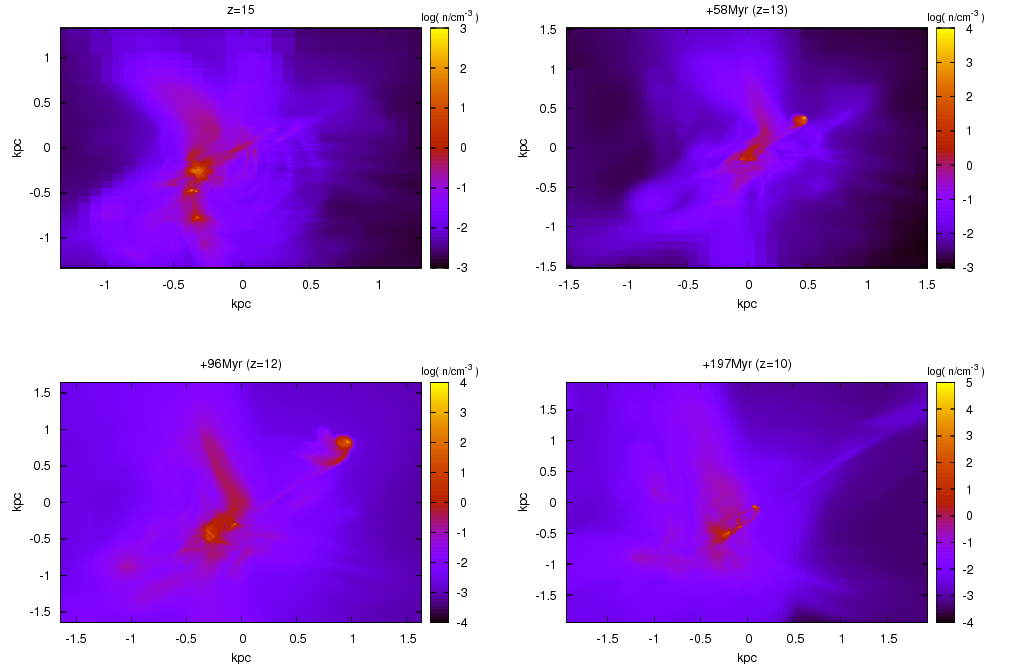
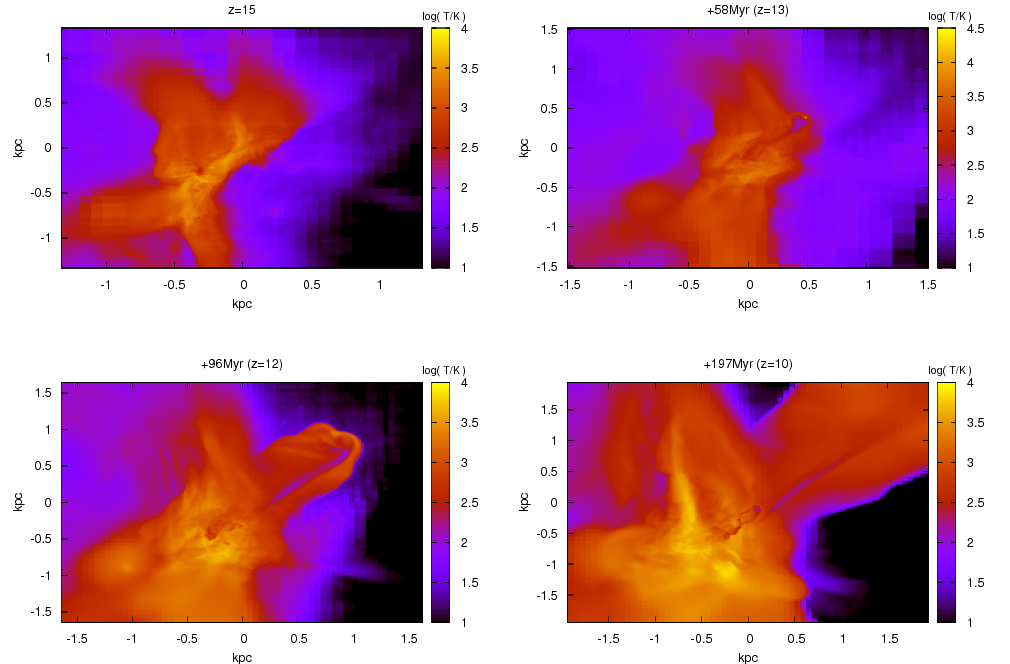
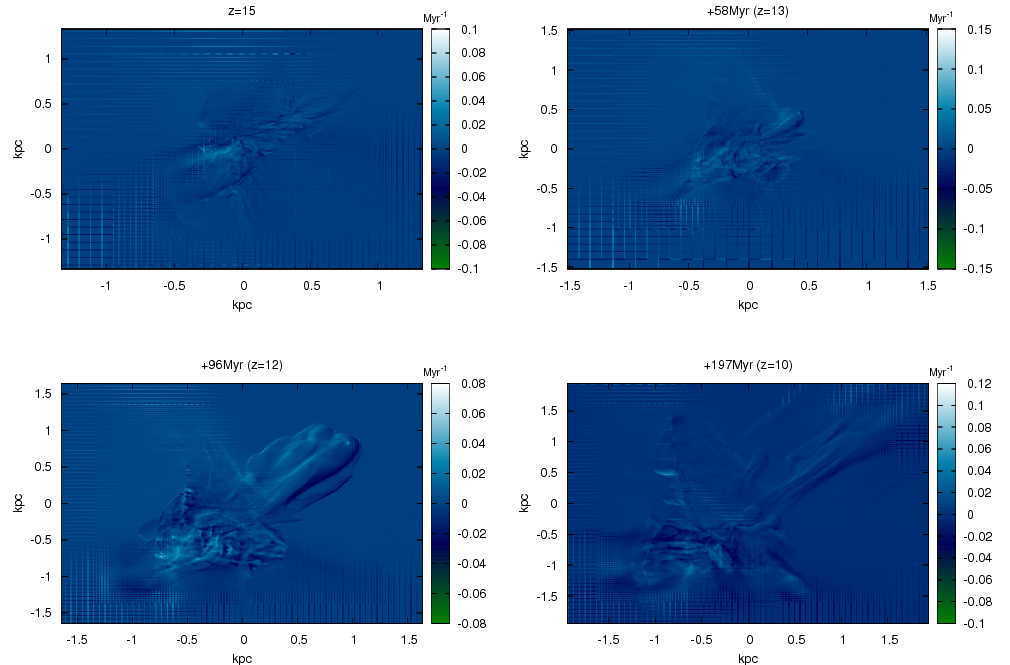
Figures 1, 2 and 3 show the z projection of the gas number density, gas temperature and gas vorticity inside a cubic box of 3 kpc of side (larger than the highest refinement level box of kpc) as a function of redshift. The horizontal and vertical lines in the vorticity map are features due to the lower resolution outside the highest refinement inner box (2 kpc of box side).
The analysis presented below is centered on both the chemo-thermal and dynamical properties of the primordial gas. In this paper we do not analyze either the gas fragmentation process or the primordial gas clumps physical properties. This kind of study is postponed for a future work.
3.1 Chemistry and Turbulence
It is well known that below K the primordial gas can be cooled down only by molecular line emissions. In this sense the molecules are crucial for the formation of star formation regions of cold and dense gas.
The H2 molecule is the most abundant molecule in primordial gas (Galli & Palla, 1998). Due to its symmetry it has not a permanent dipolar moment and only quadrupolar rotational transitions are allowed (Abgrall et al., 1982).
The main path for H2 formation in primordial environments is the two steps channel (Peebles & Dicke, 1968)
| (1) |
| (2) |
The H2 molecule is able to drop the unperturbed primordial gas temperature till K and till K in perturbed regions with high electron fraction, e.g. in post shocked regions of turbulent gas with high Mach number or in relic HII regions.
On the other hand, the HD molecule, also present in primordial gas, has a permanent dipolar moment which allows faster rotational transitions. Furthermore, due to its higher reduced mass it has rotational energy levels lower than the H2 levels, thus reaching lower minimum gas temperatures due to rotational transitions (Flower & Roueff, 1999).
The main path for HD production in primordial gas is based on the H2 molecule (e.g. Flower (2000)):
| (3) |
Due to the reasons mentioned above the HD molecule is able to cool the unperturbed primordial gas below 100K but under perturbed conditions the gas could reach the CMB temperature floor due to the HD cooling.
3.1.1 H2 and HD molecules
It is interesting to understand how the gas dynamic affects the molecular formation process in primordial environments and which are the consequences of this highly non linear process.
Because H2 production depends on the abundance of free electrons (and H-) and the HD production depends on the H2 (and D+) there are two paths to increase the molecular production rate: i) to increase the local gas density and enhance the number of reactions, which can be a natural consequence in highly turbulent environments, or ii) to increase the number of free electrons by a given physical process, e.g. a ionization front.
The first path can be the result of either a gravitational collapse process or a highly turbulent environment, as mentioned above. An example for the first case is the collapse of minihalos at high redshift (McGreer & Bryan, 2008); in this case the density enhancement due to the gravitational collapse produces enough molecules to reduce the primordial gas temperature to few K. An example for the second case can be the interaction of gas flows onto a (massive enough) DM halo; the flows can produce a turbulent enough environment where over-densities fill the interaction region (Heitsch et al., 2008).
In primordial environments the second path can be the result of post shock waves formed in the virialization process of massive enough DM halos. Despite the fact that previous works based on simplified unidimensional models have shown that post shock waves created through the baryonic collapse onto DM halos with masses MM⊙ cannot create enough free electrons in order to enhance the molecular production (Johnson & Bromm, 2006), this is not completely true due to the real non uniform baryonic velocity field, i.e. for a given DM average circular velocity the gas content of the halo is able to reach velocities higher (and lower) than its average and then it could create shocks able to increase the free electron fraction even if the average circular velocity is not high enough. Furthermore, in the hierarchical paradigm of structure formation it is natural that the smallest halos interact with the biggest ones producing a merger process which can create shocks waves as well and consequently increase the free electron fraction due to a violent merger process.
The number density vs. gas temperature plane of our simulation at z=15 (top left), 13 (top right), 12 (bottom left) and 10 (bottom right) is shown in figure 4. The figure shows number densities cm-3 corresponding to the densest gas of the simulation central regions. At z=15, before the merger, the gas temperature is above 400 K in the densest regions associated to the minihalos. After the merger, the gas develops very high temperature regions with K due to the violent merger process. At z=13 the high temperature gas has K because of the hydrogen recombination lines cooling; This temperature is still enough in order to both dissociate the molecular coolants and enhance the ionization fraction. At this redshift, the high density regions, cm-3, with high temperature, , are associated to the resultant hot-dense spinning over density going away the main halo central region, while the lower density hot regions correspond to gas expelled out by the explosive merger. At the same time, due to the enhanced ionization fraction the post shocked regions have had enough time to create HD molecules in order to drop the gas temperature till the CMB limit. (In our previous study of first galaxy formation in Prieto et al. (2011) the mass resolution was a factor of 8 lower than in this simulation. It is well known that in order to see the HD effect on the gas temperature it is needed a density threshold -McGreer & Bryan (2008)-. Due to the higher resolution of this simulation here it is possible for the HD molecule dominate the gas cooling in some regions, including the formed gas clumps not analyzed in this paper.) At later times, when the dense-hot spinning over density is out the main halo central region (and certainly not captured in the bottom panels of figure 4), a large amount of gas reaches temperatures K in the density range : potential places for star formation. These final conditions are the result of a post-shocked turbulent evolution followed by gas accretion onto the central region.
At the first glance our simulation seems contradict the result of Shchekinov & Vasiliev (2006). These authors found that in order to ionize the primordial gas in a halo merger processes, the halo mass should be M⊙, whereas in our simulation the merged halos have masses M⊙. The explanation for this apparent contradiction is that the result of Shchekinov & Vasiliev (2006) are based on an isolated halo-halo interaction, whereas in our case the mini halos collide after to be accelerated by the few M⊙ main halo, thus the merger is much violent than an isolated M⊙ halo-halo interaction.

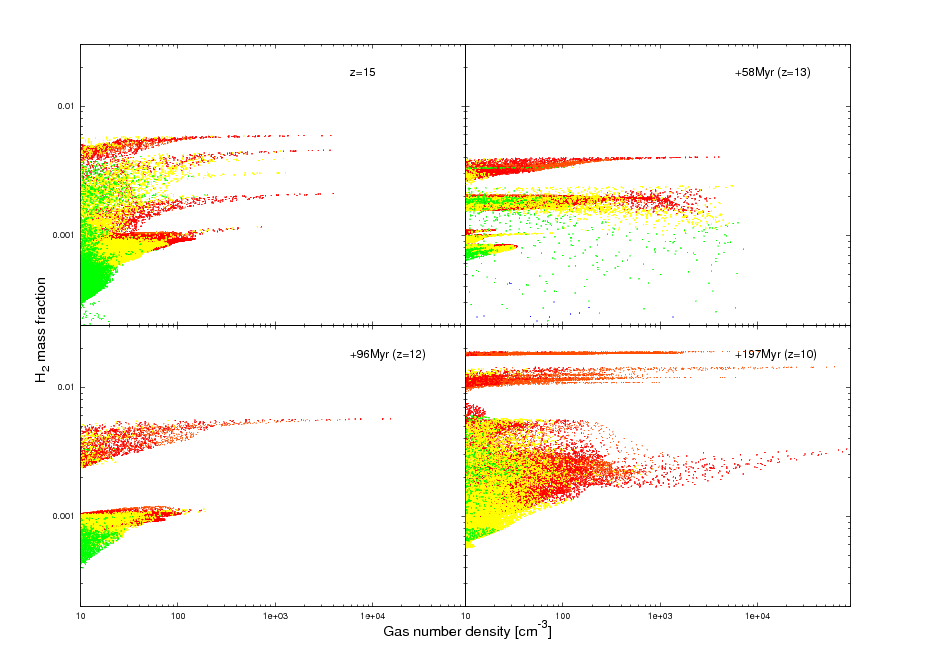
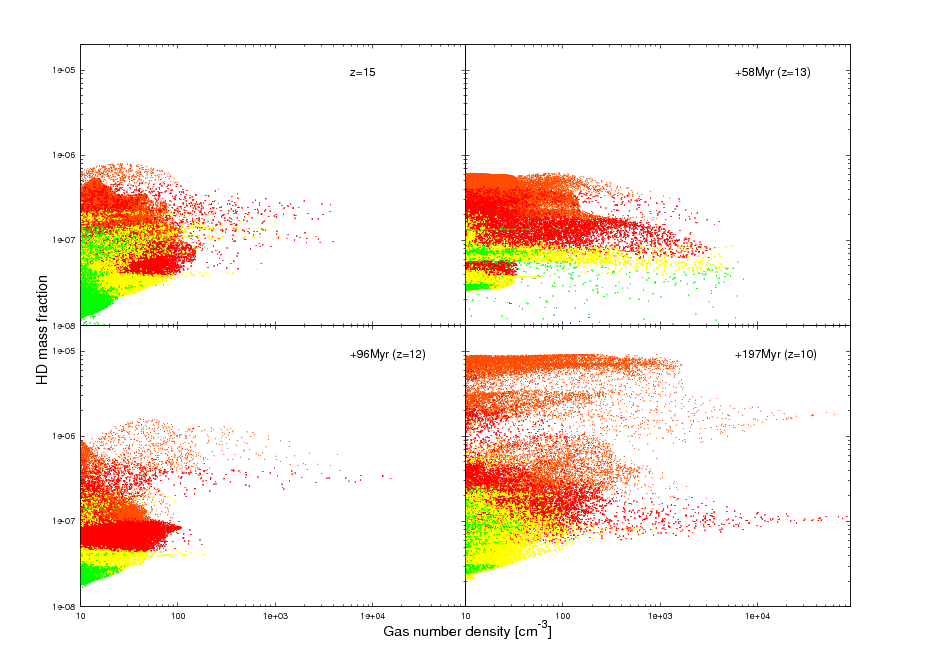
Figure 5 shows the number density - molecular mass fraction plane for both H2 (top) and HD (bottom) molecules at the same four different redshift as in figure 1. As mentioned above, before the merging there are a number of regions with temperature K and number densities cm-3 associated with the minihalos (consistent with figure 4). After the merger, both figures show that a lot of molecules are destroyed and the molecular mass fraction is reduced in a number of regions (top right panels). At the same time appear regions where molecules have continued working to reduce the gas temperature allowing the formation of denser zones. Approximately 40 Myr later (at z=12) the gas has developed very dense regions with cm-3. Furthermore, there are new regions with cm-3 at lower molecular abundance. A hundred of million of years later there seems to be two populations of dense regions with cm-3: one with temperature below 300 K and H2 mass fraction f and HD mass fraction f and another one with temperature above 300 K and f and f. These two different regions can be the result of two different evolutions near the main halo central region. The coolest one seems to be the result of evolution onto a post shocked environment where the over-densities grow up in regions with an enhanced initial molecular mass fraction. The other over-densities seem to develop in regions not too much affected by the merger process presenting a molecular mass fraction one order of magnitude below (McGreer & Bryan, 2008; Johnson & Bromm, 2006).
3.1.2 Molecular cooling and gas velocity
The figures shown in the previous section suggest that the primordial gas dynamic triggers the formation of abundant H2 and HD molecules through both the halo merging and the baryonic collapse process. Consequently, these molecules are able to cool the gas allowing it to reach 300K at density peaks, reaching temperatures even below 100K in some regions.
Based on this dynamical dependence of molecular formation it is interesting to know how the velocity modulus/Mach number is related with the number density, gas temperature and molecular mass fractions. Figure 6 shows the molecular mass fraction - velocity modulus planes for both the H2 (top) and the HD (bottom) molecule at the same redshifts of previous figures. The velocity modulus is computed as the value of for each grid; here is the average gas velocity inside the analyzed box of comoving kpc, i.e. , where ; is the local grid velocity and is the total number of grids inside the highest resolution volume. We emphasize that the analyzed volume is not the entire 1 Mpc3 simulation comoving box but the innermost highest resolution volume of proper kpc at z=10 ( proper kpc at z=15). Keeping this in mind, the gas velocity definition of has all sense because it represents the local grid velocity without take into account the gas average movement of the analyzed volume. (The computed rms physical velocity through the evolution are 8.18 km/s at z=15, 7.06 km/s at z=13, 6.21 km/s at z=12 and 4.18 km/s at z=10.) Despite of the main halo circular velocity km/s, the main halo central regions develop gas velocities above 22 km/s, enough to enhance the ionization fraction and produce shock waves 111For comparison the average circular velocity of a M⊙ DM halo collapsed at is km/s. or at least enough to compress significantly the primordial gas and accelerate the molecular formation process. At z=13, about 40 Myr after the merger process, the gas reaches velocities near 60 km/s evidencing the violence of the mini halo interaction. The interaction is able to enhance the temperature till K, slightly increase the free electron fraction and trigger an efficient molecular formation process.


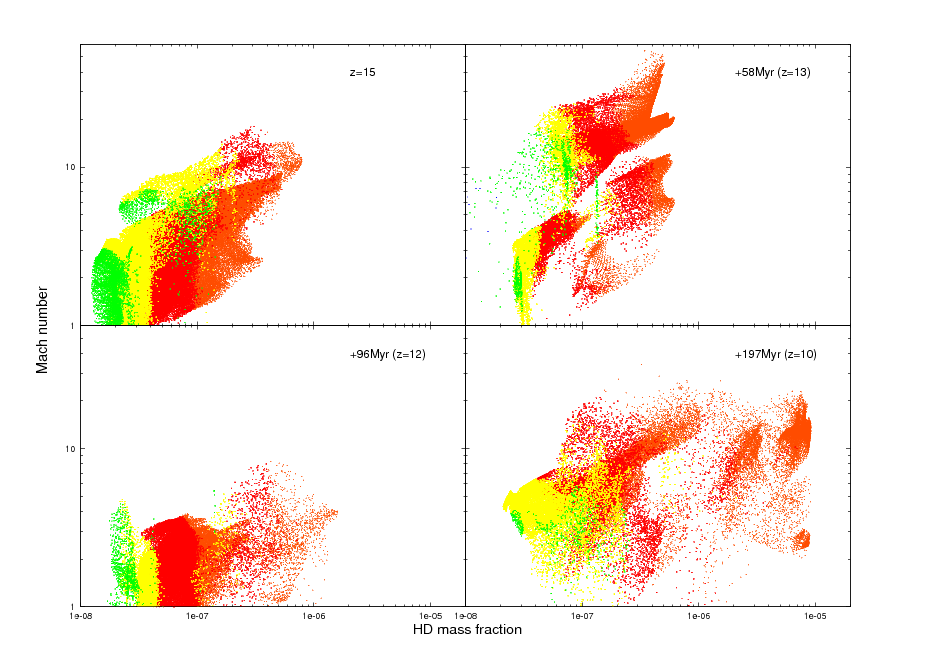
The molecular mass fraction - Mach number planes for both H2 (top) and HD (bottom) molecules at the same redshifts as in previous figures are shown in figure 7. The Mach numbers were computed based on the velocity modulus defined above. From these figures we can see that through the evolution almost all primordial gas with cm-3 develops super sonic waves. After the merger there are regions with Mach number near 50 evidencing the violence of the process again. At later times the Mach numbers (and velocities) decay at the main halo central region to increase again at z=10, showing how after the merger the gas relaxes and reaches Mach numbers below 10 at the densest regions but it increase again promoted by the baryonic accretion process. These two figures show that the coolest gas has the highest molecular mass fraction but interestingly this coolest gas occupies the high velocity/Mach number regions as a proof that the highly supersonic turbulent gas is composed by a high molecular mass fraction.

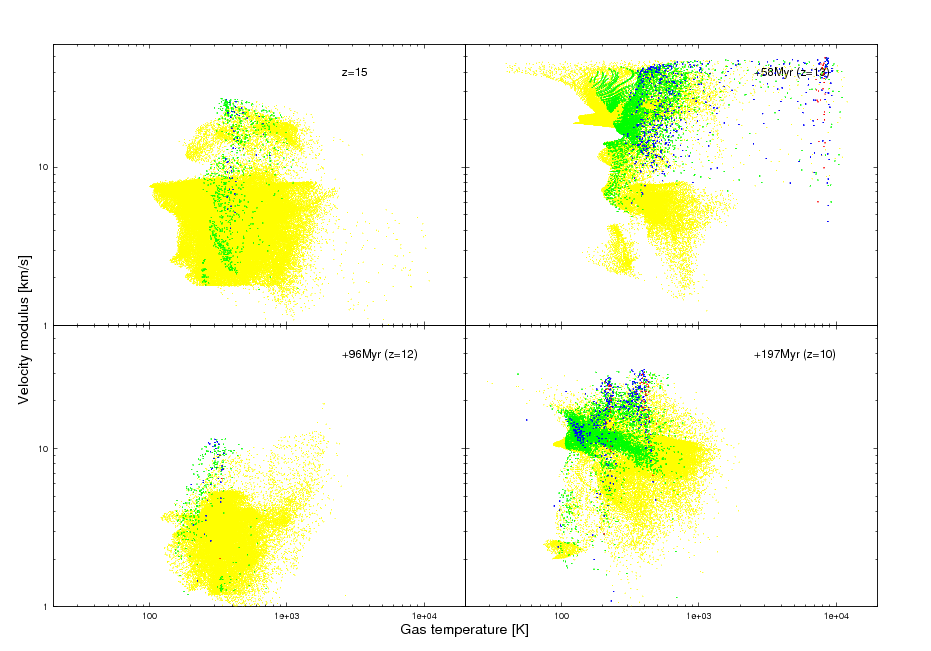
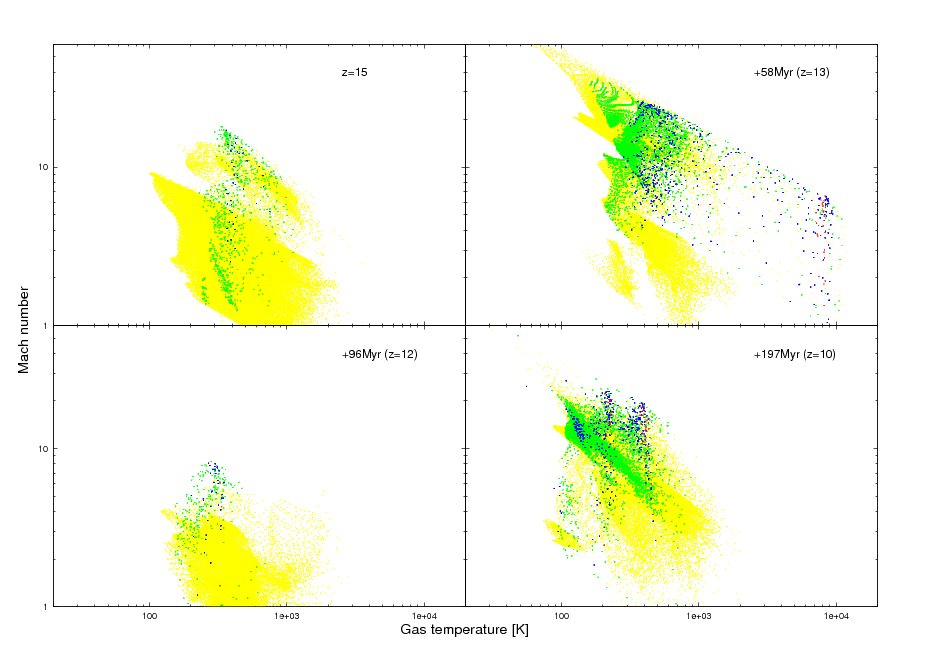
At the moment we have a picture in which the mergers and the gas collapse process onto the main halo triggers efficient molecular formation in high velocity/supersonic gas regions allowing the gas to reach temperatures even below 100 K. Figure 8 shows the gas temperature - velocity modulus plane (top) and the gas temperature - Mach number plane (bottom), for number density above 10 cm-3, both at the same redshift as before. From this figure it is clear how the merger process creates high density regions with temperature K due to its violence. At lower redshifts this figure shows that the high density regions with cm-3 are associated with both high Mach numbers and high velocities suggesting that the collapsed gas converging in the main halo central region is compressed at velocities 10 km/s 30 km/s, which can help to increase both the molecular abundances and consequently the gas cooling. In this way the mergers and the baryonic matter collapse process would favor the formation of cold - dense primordial gas regions and creates potential primordial star formation clouds.
3.2 Probability Distribution Function (PDF)
In the hydrodynamical context, the density PDF gives the probability to find a fluid element with a density between and inside the analyzed volume. In other words it quantifies the fraction of the gas in a given range of density as .
Vázquez-Semadeni (1994) shows that in the high Mach number limit, without viscosity and neglecting the gravitational term, the normalized Euler equations for hydrodynamics describe a scale invariant pressureless fluid, i.e. the probability to create a relative density fluctuation in a given region is independent of the local density. As explained in Slyz et al. (2005), if we assume that in a full developed turbulent fluid the density field is a random variable and the event of successive density increments are independent, then the central limit theorem states that the density PDF is lognormal222The PDF is lognormal because the random variable density is the product of independent random variables instead the sum of random variables, in the last case the PDF should be a normal distribution..
The argument exposed above has been extensively studied using hydrodynamical simulations of isothermal supersonic turbulence without gravity (e.g. Kritsuk et al. (2007); Federrath et al. (2008)). These simulations have shown that the density PDF is well represented by a lognormal distribution:
| (4) |
where
| (5) |
with the standard deviation of the logarithm of the density. For a formal proof of the lognormal density PDF distribution based on Pope & Ching (1993) see Nordlund & Padoan (1999).
The lognormality of the PDF is valid for isothermal turbulent fluids without gravity but under realistic conditions the asumption of isothermality is not well justified due to the cooling/heating processes triggered by both the chemistry and the gas dynamic. Furthermore, in less than a dynamical time the selfgravity becomes unavoidable at the high density regions in a realistic scenario. Therefore, we do not expect a priori to find a perfect log-normal density PDF in our non-isothermal simulation with self gravity.
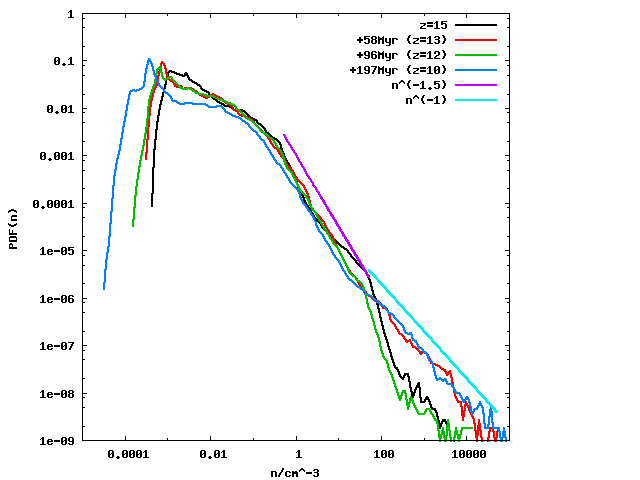
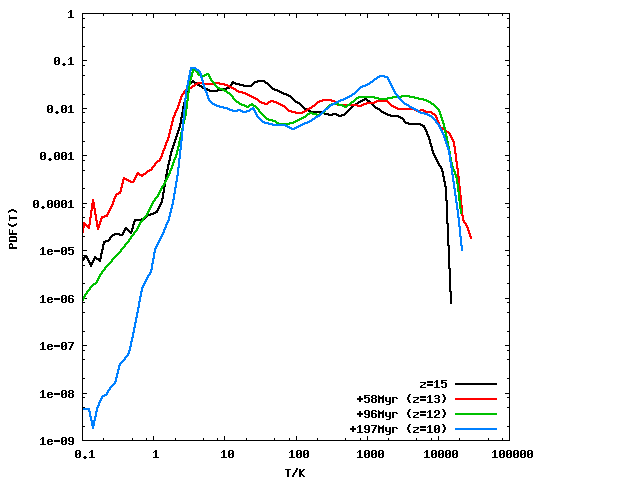
Figure 9 shows the PDF of both the gas density (top) and the gas temperature (bottom) for redshifts from 15 to 10. The PDFs (for density, temperature and velocity) were computed as the histogram of the given quantity inside equal-size bins in logarithmic scale. The density PDF shows a clear deviation from a log-normal distribution which as mentioned above is a consequence of the non isothermal evolution with self gravity.
It is interesting to note how the high density tail of the PDF evolves with redshift; it takes higher values at lower redshift showing how the gas develops high density (cm-3) regions through the collapse process onto the main DM halo; this high density regions are less than % of the volume at all redshifts.
The features of the PDF high density tail have been recently studied by Kritsuk et al. (2011) in isothermal supersonic turbulence simulations with selfgravity in a periodic box of 5 pc size. Despite of the difference in scale among this two simulations, the PDFs are roughly similar in shape. The yellow line in figure 9 shows a whereas they found a power law. This behavior is explained as the result of the first stage of a nearby isothermal gravitational collapse, as mentioned in their paper. The blue line shows a (they found a ) which is explained as the region in which their gas cores formed by gravitational collapse are rotationally stable. Interestingly, the same explanations could be valid in our simulation because through the gas collapse process onto the main DM halo the gas develops over-densities at the turbulent super sonic regions which eventually end as primordial gas clumps of few100 K due to molecular cooling. These over-densities show intrinsic rotation and develop gravitationally supported disk structures at lower redshifts.
The average density inside the analyzed box for all redshift of figure 9 is cm-3. The density PDF shows a peak at very low densities (fewcm-3) instead that at the average density like in the lognormal isothermal distribution. This peak is easily explained in the collapsing scenario: through the collapse process, the baryonic matter piles up near the main halo central region. While in this region the gas develops over-densities in a tiny percentage of the volume, the rest of the volume is dominated by low density regions due to the converging gas flow onto the main halo. This dynamical behavior creates more low density regions at lower redshift as shown by the density PDF and favors the formation of new high density regions.
The temperature PDF in figure 9 shows two clear peaks at z=10, one at few K and another one at few K. These two peaks are not easily recognized at and they appear at lower redshift as a consequence of the baryonic matter accretion process. The two peaks feature suggests the existence of two preferred gas states of high and low temperature co-existing inside the analyzed volume. Again, in the collapsing scenario the low temperature gas can be associated to decreasing (expanded and very low) density regions -which are not in equilibrium with the CMB photons- due to the infalling gas flow onto the main halo central region. These regions contain the gas inside the voids surrounded the high density structures (this is the reason why they do not appear in the figures shown above which show gas with cm-3). On the other hand, the high temperature regions can be associated with heated gas infalling onto the DM halo through the virialization process. Between these two temperature peaks is located the few K gas, where the molecular coolants are working allowing the formation of high density regions at lower redshift. Of course the molecular cooling region is a tiny percentage of the total few K range which should be dominated by thermally unstable gas.
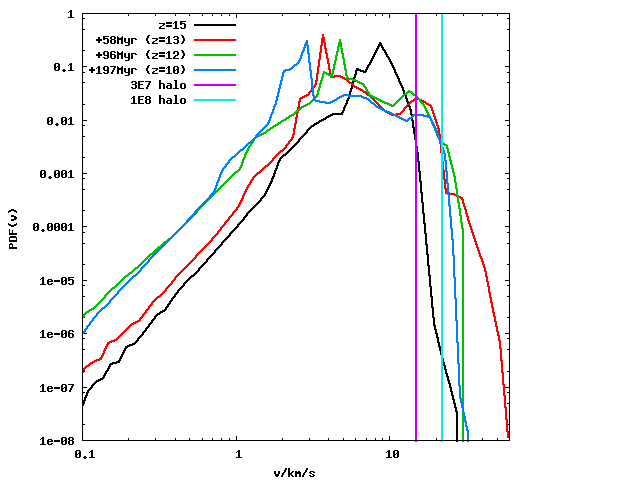
Because we have shown that the gas dynamic is related to the cooling process in primordial environments, it is interesting to study the mean gas velocity PDF of the system. Figure 10 shows the mean gas velocity PDF for the same redshifts analyzed in previous sections. The two vertical lines are the the main halo average circular velocity (14.6 km/s in purple) and the average circular velocity of a M⊙ halo (21.8 km/s in light blue). At z=15, before the minihalo merger the gas velocity is below 20 km/s, a velocity too low in order to create shock waves. At z=13, after the merger, the gas develops regions with velocities near 60 km/s and it shows a longer high velocity tail. At this redshift, above 1% of the gas has mean velocities above 21.8 km/s. At lower redshifts this percentage slightly increases but does not reach the 2% of the volume. Furthermore, below z=13 the maximum velocity slightly surpass the 30 km/s, showing that the very high velocities triggered by the merger are replaced by moderately high velocities promoted by the gas accretion process on the main halo.
3.3 Structure Functions
In order to characterize the turbulence, we computed the second order velocity structure function. The velocity structure function of order is defined as:
| (6) |
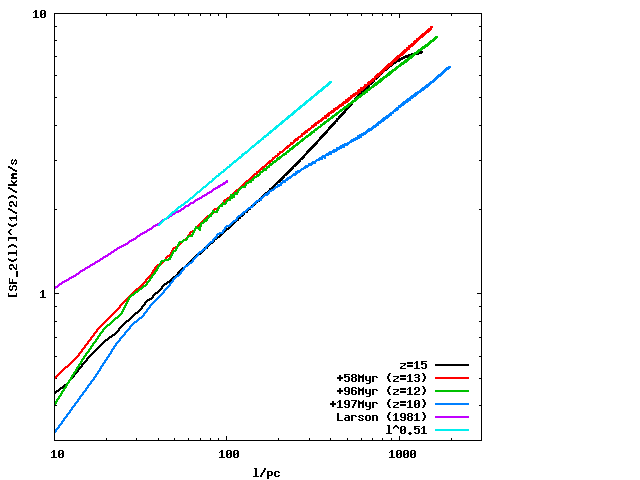
where the velocity component is parallel (longitudinal structure function) or perpendicular (transversal structure function) to the vector . The spatial average is over all values of the position and is the exponent of a power law fit to the structure function. The second order longitudinal structure function averaged over the central region of the simulation from z=15 to z=10 is plotted in figure 11. It is well approximated by a power law, , in the range of scales pc (light blue line) for the given range of redshifts.
Taking into account that after the merger the dynamics of the system is supported by the matter accretion process at scales of pc, and the molecular cooling process is efficient (in high density regions) at scales pc, the range in which the power law is valid corresponds roughly to the inertial range of the system.
In order to relate this result with the observed properties of local galactic star-forming regions, where the turbulence is driven mainly by SNe’s shock waves, figure 11 actually shows the square root of the second order structure function next to the velocity scaling law found in galactic molecular clouds (Larson, 1979, 1981), which follow the relation . Interestingly, on the scale of approximately 100 pc, the velocity dispersion in the primordial gas of our simulation is comparable to that of the molecular gas in our galaxy. However, due to the larger temperature in the primordial gas, the Mach number of the turbulence is a few times smaller than in nearby molecular clouds at the same scale.
3.4 Fourier Analysis
3.4.1 Power Spectrum (PS)
After we have shown that supersonic turbulence, triggered by both merger processes and gas accretion, promotes molecular formation and gas cooling in primordial environments, it is interesting to study how the kinetic gas energy is distributed in their different Fourier modes.
The kinetic energy PS is defined as:
| (7) |
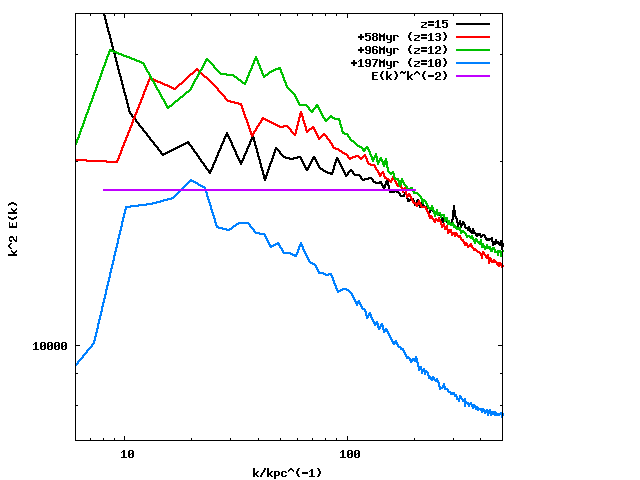
where is the gas velocity Fourier transform, its complex conjugate and the modulus of the wave number. represents the kinetic energy associated to Fourier modes of wave number between and . The kinetic energy spectrum is useful to distinguish between subsonic Kolmogorov turbulence, with , and shock dominated Burgers turbulence, with .
The energy PS for our analyzed volume is shown in figure 12. This figure shows the kinetic energy PS from z=15 to z=10. The purple line shows an Burgers PS. It is clear that at z=15 (black line) the gas energy spectrum follows a nearly Burgers behavior from kpc-1 (physical scale 600 pc) to kpc-1 (physical scale 60 pc). Actually, the power law exponent is a bit steeper at this redshift. At lower redshifts the power law exponent decreases and it reaches values near -2.2 at z=10. This result is in good agreement with the second order longitudinal velocity structure function shown in the previous section: for a the , which for gives approximately as shown in figure 11.
The close-to-Burgers power law indicates that the turbulent motions triggered by both the merger process and the matter accretion process onto the main halo produce supersonic velocities. This result is in agreement with our results of subsection 3.1.2, where we have shown that the primordial gas develops supersonic motions through the collapse process in high density regions, near the main halo central region.
It is interesting to note that at high wave numbers the PS does not decay as fast as in supersonic isothermal simulations without selfgravity (Kritsuk et al., 2007). This feature can be understood because at small scales -of order few pc in high density regions- the gravitational potential energy is converted into kinetic energy which is distributed among the longitudinal and transverse velocity modes as we will show in the next subsection. In this sense, in the same way as the large scale accretion process drives the turbulent and shocked environment at the main halo central region, at small scales the gravity is able to increase the kinetic energy through a turbulent energy cascade which favors the formation of gravitationally bounded cold dense clumps (Slyz et al., 2005; Federrath et al., 2011).
As mentioned in subsection 3.1.2, the supersonic turbulence and the molecular cooling seem to work togheter developing high density regions: the large scale collapse triggers the formation of supersonic turbulent regions where both the H2 and the HD are formed efficiently cooling down the gas and allowing gravity to dominate at few pc scales. These phenomena could rise the velocity powers at small scales compared with the non selfgravity case as shown in figure 12. One interesting thing to take into account for future idealized primordial star formation simulations, e.g. Clark et al. (2011), is the PS slope found in this simulation. Our slope is different to the assumed -4 slope in Clark et al. (2011). This difference could be not negligible because it could imply more fragmentation at small scales, certainly an interesting point to study.
3.4.2 Solenoidal v/s Longitudinal Modes
The Helmholtz decomposition of the velocity field allows us to study the kinetic energy content in compressional modes ( with ) and in solenoidal modes ( with ). In Fourier space these two components are defined as:
| (8) |
| (9) |
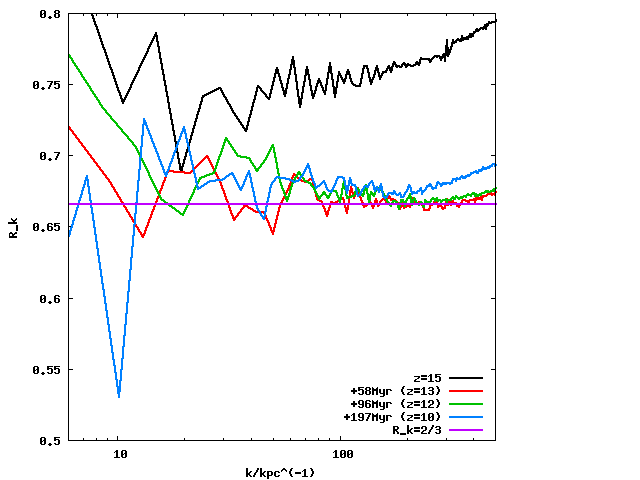
Figure 13 shows the solenoidal to total kinetic energy ratio
| (10) |
from z=15 to z=10. For redshifts below 15 and for all wave numbers shown in the plot the solenoidal modes contain more than 50% of the total kinetic energy, i.e. . Furthermore, it is very interesting to note that above kpc-1 (physical scales below pc) naturally takes values between 0.65 and 0.70, near a 2/3 distribution found in previous works (Federrath et al., 2011) which arises naturally in a three dimensional space where for a given compressional direction there are two rotational directions. It seems that at z=15 the gas has not distributed the energy following an equipartition rule. May be it needs the merger and the gas accretion onto the main halo in order to redistribute its energy to get the 2/3 value, in other words, the gas needs to pass through chaotic processes to achieve equipartition of energy.
Under these result we can say that both the minihalo merger process and the large scale gravitational collapse process triggered by the main DM halo creates a supersonic turbulent cascade which naturally distribute the kinetic energy in a ratio , where and are the kinetic energy in solenoidal and compressional modes, respectively.
4 Discussion
In this paper we have shown that the mini halo merger process inside a M⊙ halo is able to form shocks waves and supersonic turbulence in primordial gas. Furthermore, we have shown that the gas accretion process onto the main DM halo creates more supersonic turbulence and maintains the turbulence formed in the merger process. It is interesting that despite of the halo mass M⊙ (the limit suggested by Johnson & Bromm (2006)) it is possible to find gas elements with enough velocity to create shocks (due to both the mergers and the gas accretion). As mentioned above, it is not surprising if we think that the estimation of Johnson & Bromm (2006) is based on the average halo circular velocity and do not take into account the velocity distribution of a more realistic system. The inclusion of a realistic velocity distribution would let the gas to reach velocities higher (and lower) than its average circular velocity and creates shocked regions. This could be possible for halos with masses well below M⊙ as has been previously shown by Greif et al. (2008) and by this work. But here we have also demonstrated, for the first time, that even very low mass halos (), because of the presence of a halo, can be perturbed enough to produce turbulence and shocks inside themselves, thus triggering more efficient cooling than without the merging process. The previous fact does not contradict the results of Shchekinov & Vasiliev (2006) and Vasiliev & Shchekinov (2008) whom by one dimensional simulations shown that in order to ionize the primordial gas in a halo merger process, the halo mass should be M⊙. Despite in our case the merged halos have masses M⊙, they are accelerated by a M⊙ halo and they can reach enough velocity to produce the gas ionization.
The supersonic turbulence formed through this process favors the molecular formation by two main channels: i) the strong shocks of velocities above 22 km/s (due to both gas accretion and mini halo merger) are able to enhance the ionization fraction which catalyzes both the H2 and the HD formation increasing their abundances in post shocked regions with the consequent gas cooling, and ii) the supersonic turbulence compresses the gas and increases the local gas density favoring molecular formation, which in turn enhances the lost of energy rate in the over-densities. The first channel is possible because the electrons recombine in time scales of Myr while the molecular coolants are formed in scales of few Myr, under post shock conditions in these environments. The second channel works on time scales Myr for over densities of cm-3. The combination of these two process, triggered by both halo merger and gas accretion, facilitates the gas to drop its temperature and to form high density regions of cm-3 with temperatures below 300 K, in other words: it allows to create cold-dense gas regions which are potential places for star formation. The gas temperature reaches values below 100 K at regions with where the HD molecule seems to be a more efficient coolant than the H2 molecule, at higher densities the gas cooling again is dominated by H2 allowing temperatures K.
The combined effect of gas dynamic (merger and accretion) and gas chemistry (molecular formation and cooling) is able to produce over-densities with high velocity and high Mach number. The highly supersonic densest regions of the main halo central region develop a density PDF with interesting features. In the low density region it shows a peak below the average density inside the analyzed volume. This peak is formed because through the gas accretion process a large percentage of the matter is piled up in the central region. While the accretion flows converge near the halo center, the regions surrounding it lose gas continuously increasing the fraction of low density volume at lower redshift.
At the other extreme, the high density PDF shows two clear power law region. The first at follows a PDF which is explained as the region dominated by nearby isothermal over-densities (the over-densities have to scale as in order to reproduce the -3/2 exponent) before collapse. At higher densities, cm-3, the PDF tail shows how the collapse process at large scales feeds the central region and produces the high density structures. The break down of the -3/2 slope shows the point where the locally collapsed over-densities start to pile up the accreted material and develop rotationally supported structures as a natural consequence of angular momentum conservation. Very interestingly the density PDF computed from our cosmological simulation has similar features to the PDF found in idealized star formation simulations, e.g. Kritsuk et al. (2011).
We emphasize that the density, temperature and velocity PDF can be used in order to characterize the gas conditions in future idealized primordial star formation simulations inside of similar high redshift environments .
The previous evidence of supersonic environments is further supported by our Fourier analysis. The kinetic energy spectrum of the turbulent gas follows a nearly Burgers behavior , a bit steeper at lower redshift reaching a minimum exponent of -2.2. This result is also supported by the second order longitudinal structure function exponent . The power spectrum slope confirms that merger followed by the inhomogeneous accretion process onto the main halo develops a supersonic turbulent gas with shocks through the halo virialization process. An interesting feature of this spectrum is that toward small scales it does not decay as fast as in isothermal simulations with no selfgravity. This feature could be explained by taking into account the selfgravity of the densest regions: At the beginning, the kinetic energy of the system comes from large scale accretion processes. As mentioned above, after a shocked is produced, the turbulent environment of the gas dynamics facilitates the gas to reach high density-low temperature states. Under such conditions the gas is able to locally collapse gravitationally transforming their gravitational energy into kinetic energy at small scales producing the feature at high wave numbers in the power spectrum.
The distribution of energy in solenoidal and compressive modes shows that the solenoidal modes content of the total kinetic energy. This energy distribution is the consequence of a random turbulent motion which for each compressional direction, e.g. , presents two rotational directions, and : the kinetic energy follows an equipartition rule with the same amount of energy for each direction. This energy distribution is not constant neither in time nor in scale but it has well stated values below 100 pc.
All the Fourier information presented above can be very useful in order to set initial conditions for idealized primordial star formation simulations in the spirit of Clark et al. (2011). For instance, these authors take an initial velocity power spectrum with a slope -4. This value is much lower than our slope . The inclusion of a -2 slope in the previous study could bring a more efficient fragmentation at small scales with a possible more efficient low mass primordial star formation as found in Clark et al. (2011) and Greif et al. (2011) who, using 3D numerical simulations from cosmological initial conditions, have shown that a multiple system of low mass (M⊙) primordial stars can be formed inside DM mini halos.
Using a one zone model Schneider et al. (2011) have shown that without dust there is a critical metallicity () above which gas can fragment into M⊙ object. Furthermore, they found that there is a critical dust-to-gas ratio above the gas can fragment into low mass (M⊙) objects. The existence of a critical metallicity above which it is possible to form low mass star is explained by the low-mass star-formation critical metallicity theory of Bromm & Loeb (2003). Frebel et al. (2007) tested this theory with data of stars formed at the galactic halo, globular clusters and dwarf spheroidal galaxies reaching a good agreement among data and theory. Nevertheless, the solidness of this theory has been questioned by a recently found extremely metal poor star which seems to violate the theory (Caffau et al., 2011) in the sense that it do not has the amount of both oxygen and carbon needed to form a low-mass star as stated in the Bromm & Loeb (2003) theory. This finding makes possible the potential observation of low mass primordial stars as mentioned in Johnson & Khochfar (2011).
The study presented in this work does not take into account the possible radiation background from previously formed pop III stars. Of course, a high enough number of photons in the Lyman-Werner band could avoid the gas fragmentation due to the molecular coolants destruction (Haiman et al., 1997). The result of this process could be non fragmented hot gas piled on the main halo center of mass. This configuration could be responsible for the formation of super massive black holes at high redshifts (e.g. (Shang et al., 2010)).
Our work either take into account the possible supernovae explosion from pop III stars previously formed inside the merged mini halos. For masses of the super novae progenitor in the range M⊙, this kind of violent phenomena certainly would be able to expel the gas inside the DM mini halos, and for massive enough super novae progenitors, in the range of M⊙, the explosion could be able to disrupt the gas inside halos even more massive than M⊙ (Whalen et al., 2008). Because our main target is to try to understand the main processes involved in the formation of supersonic turbulence in unperturbed primordial environments we have neglected these two important feedbacks.
Our cosmological initial conditions were set with . This value is larger than the most recent measure of which imply that the DM halos in our simulation collapse faster than they do in a more realistic scenario. Actually, in a more realistic scenario the halo collapse process would occur at a redshift , where is the collapse redshift with . For instance, the results that we show at z=10 should occur at .
5 Summary and Conclusions
We have performed hydrodynamical simulations of primordial gas from cosmological initial conditions in order to study how the DM merging process triggers the formation of turbulence in primordial environments and how the developed supersonic environment favors the formation of molecular coolants. The simulation, inside a 1Mpc/ box size, follows the evolution of a M⊙ from to z=10 with a proper distance resolution pc at this redshift, covering almost 5 orders of magnitude in distance scales.
Our main conclusions can be summarized as follows:
-
1.
Both the baryonic accretion process through filaments and the DM minihalo merging onto the main halo is able to produce a supersonic () turbulent and shocked ( km/s) environment where the H2 and the HD molecules are formed efficiently.
-
2.
The non equilibrium molecular formation triggered by the supersonic turbulent environment creates a number of regions with temperature K. Some regions with number density cm-3 reach temperatures below 100 K evidencing the effect of the HD molecule as the main coolant. At higher densities the H2 is the more efficient coolant. All these low temperature-high density regions are potential star formation places.
-
3.
The Fourier analysis of the velocity field shows that the kinetic energy has a nearly Burgers spectrum , albeit a bit steeper at lower redshift with a minimum exponent of -2.2. This power law confirms the previous statement of supersonic and shocked environment. This spectrum approximately implies a second order longitudinal structure function, steeper than the behavior observed in local molecular clouds.
-
4.
The characterization of the turbulence power spectrum shows that it could favor the formation of low mass primordial stars.
-
5.
The energy spectrum does not decay at high wave numbers as fast as shown in isothermal simulations without self-gravity. This behavior is explained by taking into account that after the accretion process enhances the cooling at supersonic turbulent regions the gas is able to form gravitationally unstable over densities. In this way, the local gravitational collapse enhances the velocity power at scales of few pc converting the gravitational energy into kinetic energy.
-
6.
The energy in solenoidal (rotational) modes is of the total energy as in previous simulations of turbulent gas.
This paper is part of our ongoing effort (Prieto et al., 2011) to produce numerical simulations that capture enough physics to understand the process of galaxy formation at the highest redshifts in order to shed light on what mechanisms could be dominating and shaping the future evolution of galaxies. We have shown here that the presence of relatively low mass halos ( M⊙) dramatically influences its environment by creating a turbulent ISM. This in turn makes the smaller mass halos (), the most abundant ones at that redshift, to also develop turbulence in their ISM because of the merging process. The end result is that the production of coolants is enhanced, so much that even the HD molecule becomes an important coolant in some regions, thus producing regions of high density-low temperature that could be sites of star formation. We are now investigating how universal the process presented in this paper is by analyzing the whole 1Mpc box simulation and including the low mass and high mass dark matter halos. We will present our findings in a forthcoming paper. We can at this point speculate that, if this mechanism turns out to be universal at such high redshift, it could also potentially work at lower redshifts, so that the initial turbulence in the ISM of a galaxy could be due to the merging process, which is universal in the standard LCDM scenario.
References
- Abel et al. (2000) Abel T., Bryan G. L. & Norman M. L., 2000, ApJ, 540, 39
- Abel et al. (2002) Abel T., Bryan G. L. & Norman M. L., 2002, Science, 295, 93
- Abgrall et al. (1982) Abgrall H., Roueff E., Viala Y., 1982, A&A Sup. 50, 505.
- Bromm et al. (1999) Bromm V., Coppi P. & Larson R. B., 1999, ApJl, 527, L5
- Bromm et al. (2002) Bromm V., Coppi P. & Larson R. B., 2002, ApJ, 564, 23
- Bromm & Loeb (2003) Bromm V. & Loeb A., 2003, Nature, 425, 812
- Caffau et al. (2011) Caffau E., Bonifacio P., François P., Sbordone L., Monaco L., Spite M., Spite F., Ludwig H., Cayrel R., Zaggia S., Hammer F., Randich S., Molaro P. & Hill V., 2011, Nature, 477, 67
- Clark et al. (2011) Clark P. C., Glover S. C. O., Klessen R. S. & Bromm V., 2011, ApJ, 727, 110
- Clark et al. (2011) Clark P. C., Glover S. C. O., Smith R. J., Greif T. H., Klessen R. S. & Bromm V., 2011, Sci, 331, 1040
- Eisenstein & Hut (1998) Eisenstein D. J. & Hut P., 1998, ApJ, 498, 137
- Federrath et al. (2008) Federrath C., Klessen R. S., Schmidt W., 2008, ApJ, 688L, 79
- Federrath et al. (2009) Federrath C., Duval, J., Klessen, R. S., Schmidt, W., & Mac Low, M. -. 2009, arXiv:0910.5469
- Federrath et al. (2011) Federrath C., Sur S., Schleicher D. R. G., Banerjee R. & Klessen, R. S., 2011, ApJ, 731, 62F
- Flower & Roueff (1999) Flower, D. R. & Roueff E., 1999, MNRAS, 309, 833
- Flower (2000) Flower, D. R., 2000, MNRAS, 318, 875
- Frebel et al. (2007) Frebel A., Johnson J. L. & Bromm V., 2007, MNRAS, 380, 40
- Galli & Palla (1998) Galli D. & Palla F., 1998, A&A, 335, 403
- Glover & Abel (2008) Glover S. C. O. & Abel T., 2008, MNRAS, 388, 1627
- Greif et al. (2008) Greif T. H., Johnson, Jarrett L., Klessen R. S. & Bromm, V., 2008, MNRAS, 387, 1021
- Greif et al. (2011) Greif T. H., Springel V., White S. D. M., Glover S. C. O., Clark P. C., Smith R. J., Klessen R. S. & Bromm V., 2011, ApJ, 737, 75)
- Haiman et al. (1997) Haiman Z., Rees M. J. & Loeb A., 1997, ApJ, 476, 458
- Heitsch et al. (2008) Heitsch F. Hartmann L. W. Slyz A. D., Devriendt J. E. G. & Burkert A., 2008, ApJ, 674, 316
- Johnson & Bromm (2006) Johnson, J. L. & Bromm, V., 2006, MNRAS, 366, 247J
- Johnson & Khochfar (2011) Johnson J. L. & Khochfar S., 2011, MNRAS, 413, 1184
- Kritsuk et al. (2006) Kritsuk A. G., Norman M. L. & Padoan P., 2006, ApJ, 638L, 25
- Kritsuk et al. (2007) Kritsuk, A. G., Norman, M. L., Padoan, P., & Wagner, R. 2007, ApJ, 665, 416
- Kritsuk et al. (2009) Kritsuk, A. G., Ustyugov, S. D., Norman, M. L., & Padoan, P. 2009, arXiv:0912.0546
- Kritsuk et al. (2011) Kritsuk, A. G., Norman, M. L., & Wagner, R. 2011, ApJl, 727, L20
- Larson (1979) Larson, R. B. 1979, MNRAS, 186, 479
- Larson (1981) Larson, R. B. 1981, MNRAS, 194, 809
- McGreer & Bryan (2008) McGreer I. & Bryan G., 2008, ApJ, 685, 8
- Milosavljevic et al. (2011) Milosavljevic M., Glover S. C. O., Federrath C., Klessen R. S., 2011, arXiv:1103.3056M
- Nordlund & Padoan (1999) Nordlund, Å., & Padoan, P., 1999, in Interstellar Turbulence, ed. J. Franco & A. Carramiñana (Cambridge: Cambridge Univ. Press), 218
- Nordlund & Padoan (2003) Nordlund, Å., & Padoan, P. 2003, Turbulence and Magnetic Fields in Astrophysics, 614, 271
- Norman & Ferrara (1996) Norman C. A. & Ferrara A., 1996, ApJ, 467, 280
- Padoan et al. (2007) Padoan P., Nordlund Å., Kritsuk A. G., Norman M. L. & Li P. Sh., 2007, ApJ, 661, 962
- Peebles & Dicke (1968) Peebles P. J. E., Dicke R. H., 1968, ApJ 154, 891.
- Pope & Ching (1993) Pope S. B. & Ching E. S. C., 1993, Phys. Fluids A, 5, 1529
- Prieto et al. (2011) Prieto J., Padoan P., Jimenez R., Infante L., 2011, ApJ, 731, L38
- Prieto, Infante, & Jimenez (2008) Prieto J. P., Infante L., Jimenez R., 2008, arXiv, arXiv:0809.2786
- Prunet et al. (2008) Prunet S. Pichon C., Aubert D., Pogosyan D., Teyssier R. & Gottloeber S., 2008, ApJs, 178, 179
- Schneider et al. (2011) Schneider R., Omukai K., Bianchi S. & Valiante R., 2011, arXiv:1109.2900
- Shang et al. (2010) Shang C., Bryan G. L. & Haiman Z., 2010, MNRAS, 402, 1249
- Slyz et al. (2005) Syz A. D., Devriendt J. E. G., Bryan G. & Silk J., 2005, MNRAS, 356, 737S
- Stancil et al. (1996) Stancil P. C., Lepp S. & Dalgarno A., 1996, ApJ, 458, 401
- Teyssier (2002) Teyssier R., 2002, A&A, 385, 337
- Truelove et al. (1997) Truelove J. K., Klein R. I., McKee Ch. F., Holliman J. H., Howell L. H. & Greenough J. A., 1997, ApJl, 489, 179
- Shchekinov & Vasiliev (2006) Shchekinov Yu. A. & Vasiliev E. O., 2006, MNRAS, 368, 454
- Vasiliev & Shchekinov (2008) Vasiliev E. O. & Shchekinov Yu. A., 2008, AN, 329, 625
- Vázquez-Semadeni (1994) Vázquez-Semadeni, E., 1994, ApJ, 423, 681
- Whalen et al. (2008) Whalen D., van Veelen B., O’Shea B. W. & Norman M. L., ApJ, 2008, 682, 49
- Wise & Abel (2007) Wise J. & Abel T., 2007, ApJ, 665, 899
- Yoshida et al. (2006) Yoshida, N., Omukai, K., Hernquist, L., & Abel, T., 2006, ApJ, 652, 6