An HST/COS Search for Warm-Hot Baryons in the Mrk 421 Sightline 111Based on observations made with the NASA/ESA Hubble Space Telescope, obtained from the data archive at the Space Telescope Science Institute. STScI is operated by the Association of Universities for Research in Astronomy, Inc. under NASA contract NAS5-26555.
Abstract
Thermally-broadened Ly absorbers (BLAs) offer an alternate method to using highly-ionized metal absorbers (O VI, O VII, etc.) to probe the warm-hot intergalactic medium (WHIM, K). Until now, WHIM surveys via BLAs have been no less ambiguous than those via far-UV and X-ray metal-ion probes. Detecting these weak, broad features requires background sources with a well-characterized far-UV continuum and data of very high quality. However, a recent HST/COS observation of the blazar Mrk 421 allows us to perform a metal-independent search for WHIM gas with unprecedented precision. The data have high signal-to-noise ( per km s-1 resolution element) and the smooth, power-law blazar spectrum allows a fully-parametric continuum model. We analyze the Mrk 421 sight line for BLA absorbers, particularly for counterparts to the proposed O VII WHIM systems reported by Nicastro et al. (2005a, b) based on Chandra/LETG observations. We derive the Ly profiles predicted by the X-ray observations. The signal-to-noise ratio of the COS data is high ( per pixel), but much higher can be obtained by binning the data to widths characteristic of the expected BLA profiles. With this technique, we are sensitive to WHIM gas over a large () parameter range in the Mrk 421 sight line. We rule out the claimed Nicastro et al. O VII detections at their nominal temperatures ( K) and metallicities () at level. However, WHIM gas at higher temperatures and/or higher metallicities is consistent with our COS non-detections.
Subject headings:
intergalactic medium, quasars: absorption lines, cosmology: observations, BL Lacertae objects: individual (Mrk 421)1. Introduction
The Warm-Hot Intergalactic Medium (WHIM) is expected to make up 25–50% of the baryons in the low-redshift Universe based on cosmological simulations (Cen & Ostriker, 1999; Davé et al., 1999, 2001; Smith et al., 2011). Thus far, only a small fraction of this hot gas has been detected (see, e.g. Danforth, 2009), and the interpretation of these detections is still controversial. The difficulty in detecting this gas lies in its combination of high temperature ( K) and low hydrogen density (). For example, only the subset of WHIM gas which is sufficiently metal-enriched can be detected through highly-ionized metal ions at UV and X-ray energies. The O VI 1031, 1037 doublet has been detected in numerous extragalactic systems with the Far Ultraviolet Spectroscopic Explorer (FUSE) and Hubble Space Telescope (HST) (Danforth & Shull, 2005, 2008; Tripp et al., 2008; Thom & Chen, 2008). It may trace very low density, photoionized K gas (e.g., Oppenheimer & Davé, 2008; Oppenheimer et al., 2011) or shock-heated, collisionally-ionized WHIM (Smith et al., 2011). Until now, the searches for hotter WHIM ( K) have been restricted to soft X-ray absorption.
Very highly ionized metal species such as O VII, O VIII, N VII and Ne IX with soft-X-ray resonance transitions offer a good option for finding diffuse gas at the hotter end of the WHIM temperature range. However, the predicted low metallicity of this gas ( typical of O VI absorbers; Danforth & Shull, 2008) and the relative insensitivity and low resolution of even our best, current X-ray spectrometers (i.e., the Chandra Low Energy Transmission Grating (LETG) and XMM-Newton Reflection Grating Spectrometer (RGS)) has generated controversy for most or all current proposed detections of hotter WHIM gas.
The growing number of “broad Ly absorbers”(BLAs) detected in high signal-to-noise FUV spectra (Sembach et al., 2004; Richter et al., 2004, 2006; Lehner et al., 2007; Danforth et al., 2010a) may trace WHIM independent of metal enrichment, but this diagnostic suffers from a different set of observational uncertainties. Even at the cooler end of the WHIM temperature range, the fraction of hydrogen in a neutral state is tiny. Thermal broadening renders any Ly absorption shallow and broad, and the WHIM absorber may be blended with narrower absorption features arising in adjacent, cooler, photoionized gas. At temperatures above K, spectra of extremely high quality, with well-defined continua, are required to characterize the WHIM through BLAs alone. Independent measurements of individual WHIM systems through complimentary techniques reduce the uncertainties inherent in single-method detections.
Two of the earliest and most-cited X-ray WHIM detections were the two reported O VII absorbers (Nicastro et al., 2005a, b) in Chandra LETG observations of the blazar Mrk 421 (. These observations were made while Mrk 421 was in a flaring state and represent some of the highest signal-to-noise soft-X-ray data taken to date on an extragalactic sight line. Although these absorbers were not confirmed in observations by XMM-Newton (Kaastra et al., 2006; Williams et al., 2006; Rasmussen et al., 2007), their presence has neither been confirmed nor ruled out conclusively. While a few other X-ray WHIM absorption detections have been proposed (e.g., in the PKS 2155-304 sight line by Fang et al., 2002), a new tactic employed by Buote et al. (2009) may have finally achieved some success. Based on the results of simulations (e.g., Davé et al., 1999) that show high concentrations of WHIM gas around large-scale filamentary structure, Buote et al. (2009) (see also Fang et al., 2010; Zappacosta et al., 2010) observed the bright blazar H 2356309 behind the Sculptor Wall and made O VII detections at the redshift of that filament with both Chandra and XMM-Newton. Based on the Sculptor Wall detection, it seems worthwhile to revisit the Mrk 421 sight line, since one of the two claimed WHIM detections is at the redshift () of another nearby, large-scale galaxy filament, the Great Wall (de Lapparent, Geller & Huchra, 1986; Penton, Stocke, & Shull, 2000; Williams et al., 2010).
In this paper, we focus on the potential for detecting WHIM in high-quality UV spectra from the Cosmic Origins Spectrograph (COS) on HST. This analysis is specific to the Mrk 421 sight line, but easily generalized to sight lines for which high-quality far-UV spectra exist. The FUV spectra of blazars can be well-modeled as a power law (Stocke, Danforth, & Perlman, 2011), and the high and multiple ionic transitions allow foreground Galactic absorbers to be well-modeled. Since the data can be fitted with a fully parametric continuum model, this is an ideal test-bed for detecting WHIM gas in BLAs.
In Section 2, we present the COS FUV spectrum of Mrk 421, identify all spectral features present, both Galactic and extragalactic, and produce a normalized, line-free spectrum covering the entire Ly forest region. In Section 3, we model the BLA absorbers implied by both the reported Nicastro et al. (2005a, b) (henceforth collectively N05) O VII measurements and for more generalized WHIM absorbers. We then place limits on the temperature and metallicity of any WHIM gas present along the Mrk 421 line of sight based on the observed COS data. In Section 4 we discuss the meaning and importance of these results, reiterate our main conclusions, and discuss applications to other sight-lines.
2. Observations and Analysis
COS far-UV observations of BL Lac object Mrk 421 () were carried out in 2009, December, during the first three months of COS science observations as part of the COS Guaranteed Time Observations (PID 11520, PI Green). Four exposures were made in the G130M (1135 Å 1480 Å; totalling 1.7 ksec) medium-resolution grating (), each at a different central wavelength setting, to dither over known instrumental features (see Green et al., 2011; Osterman et al., 2011).
The exposures were reduced with a custom flat field derived from the combination of several public COS calibration observations of white dwarfs. Four targets were used to create the G130M flat field; WD 0308565, WD 0320539, WD 0947857, and WD 1057719. For each calibration target, an iterative technique was used to independently measure the relatively smooth continua from the inferred underlying flat-field and grid wire shadows using the ‘x1d’ files output by CALCOS 2.13. The four independent one-dimensional estimates of the G130M flat field were merged in detector space with weighting. After applying the custom flat field to each exposure, we aligned the four Mrk 421 exposures in wavelength space via a cross-correlation of regions around prominent ISM absorption features. Exposures were interpolated onto a common wavelength grid and combined via an exposure time weighted mean as described in Danforth et al. (2010b).
Our custom flat field is not perfect, but it consistently improved the continuum signal-to-noise in our Mrk 421 spectrum as compared to the standard “wireflat” processing (Danforth et al., 2010b). For example, in the 1410–1430 Å region of the Mrk 421 G130M spectrum, where no ISM or IGM absorption lines are expected, the signal-to-noise per seven-pixel resolution element improved from 27 to 36 with our custom flat fielding, as compared to our standard “wireflat” processing. A second line-free region from 1340–1369 Å increased from S/N of 38 to 48 per resolution element.
2.1. Spectral Modeling
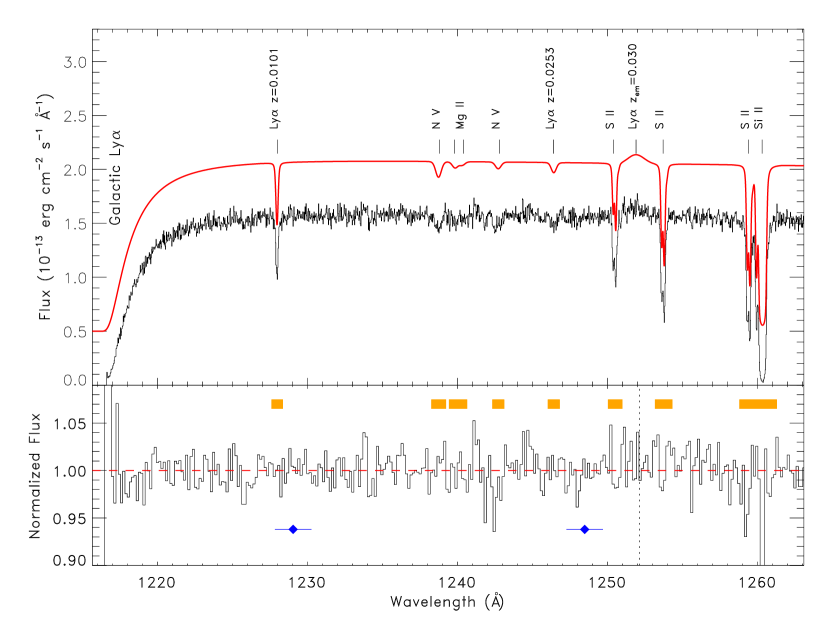
The Ly forest region of the Mrk 421 sight-line is shown in the top panel of Figure 1. Since we are interested in weak, broad absorption features in the data, an accurate and detailed model fit to the spectrum including all known features is crucial. Fortunately, as with most blazars, the dereddened UV continuum is easily defined by a power law of the form . We use the parameters and to provide a baseline continuum fit to the data in the 1150 Å–1300 Å region. Note that these parameters are slightly different from those reported by Stocke, Danforth, & Perlman (2011), which were based on an earlier reduction of the data and a continuum fit to the entire COS/FUV spectral region. The damped Galactic Ly absorber is modeled with the parameters km s-1, km s-1, and . This is consistent with the emission-weighted mean H I 21 cm profile in a beam toward Mrk 421 in the Leiden-Argentine-Bonn H I survey (LAB, Kalberla et al., 2005). The measured column of neutral hydrogen corresponds to a Galactic reddening of . (A fit to the Galactic Ly profile in the FUSE data yields a consistent value.) In a departure from the pure power-law source continuum typical of BL Lac objects, Mrk 421 shows a weak emission feature at 1251.9 Å corresponding to Ly emission at from circumnuclear gas in the blazar. We include the fit from Stocke, Danforth, & Perlman (2011) ( Å, ) in our spectral model, shown offset from the data in the top panel of Figure 1.
There are several narrow Galactic absorption lines which can be modeled out of the spectrum. The stronger blue line of the N V doublet is well fitted with parameters km s-1, km s-1, and , but the weaker red line of the doublet shows an absorption excess that is discussed below. The S II Å triplet has a strong Galactic component ( km s-1, km s-1, ), a weaker, blue-shifted component ( km s-1, km s-1, ), and very weak red wing ( km s-1, km s-1, ). These low-ion velocity components are consistent with the two H I emission components (Wakker et al., 2003; Kalberla et al., 2005) and absorption seen in other low-ionization species in COS data (Yao et al., 2011). The strong Si II line, while redward of the Ly forest region in Mrk 421, can be fitted with two components ( km s-1, km s-1, ) and ( km s-1, km s-1, ). The last identified Galactic absorber is the weak, blended Mg II doublet. Assuming a 2:1 ratio of equivalent widths and similar velocity centroids and -values to the other Galactic lines, we model the system with km s-1, km s-1, and .
The sight line toward Mrk 421 is relatively short (), and there is only a single previously-reported (Shull, Stocke, & Penton, 1996) intervening Ly forest system (, Å). This moderate-strength Ly line is well-fitted by a Voigt profile with parameters (, km s-1, mÅ, ) convolved with the COS line spread function (Ghavamian et al., 2009; Kriss, 2011). No corresponding metal absorption (e.g., C IV, Si III, etc.) is seen at this redshift.
A weak absorption feature ( mÅ) is seen at 1246.4 Å in the coadded spectrum. There are no species commonly seen in the ISM with absorption lines near 1246 Å, and the normalized spectrum in the Å range is free of line-removal artifacts. The most likely identification of this feature is a weak Ly forest system with fit parameters km s-1 (), km s-1, and .
The spectrum is divided by the model (offset curve in the top panel of Figure 1) to give a normalized spectrum, with all identified absorption and emission features removed (Figure 1, lower panel). With the exception of a few narrow line-removal artifacts, the normalized spectrum shows a remarkably uniform appearance over the range 1218 Å 1257 Å.
| Quantity | Units | SourceaaN05 = Nicastro et al. 2005a (Chandra); S05 = Savage et al. 2005 (FUSE) | ||
|---|---|---|---|---|
| UV/X-ray Measurements | ||||
| km s-1 | N05 | |||
| cm-2 | N05 | |||
| cm-2 | S05 | |||
| cm-2 | N05 | |||
| bbInferred from O VI/VII/VIII ratios | ccInferred from N VI/VII ratios | K | N05 | |
| Implied Ly Absorber Parameters | ||||
| km s-1 | ||||
| ddAssuming . See text for details. | cm-2 | |||
| ddAssuming . See text for details. | mÅ | |||
| 0.016 | 0.025 | |||
| 1.9 | 2.7 | |||
3. WHIM Absorption Toward Mrk 421
Given a few input parameters, we can model the expected appearance of a BLA. These parameters can be assumed for WHIM absorbers in general, or they can be derived from X-ray WHIM measurements and a few basic assumptions. For general single-phase WHIM gas with total hydrogen column density at temperature , the neutral hydrogen column density is and the thermal line width is
| (1) |
where is temperature in units of K. The neutral fraction as a function of temperature, , can be determined either in collisional ionization equilibrium (CIE) or with a more sophisticated sets of assumptions. In the following analysis, we assume gas cooling isobarically as tabulated in Gnat & Sternberg (2007). At WHIM temperatures, the hydrogen neutral fraction is identical to that in CIE and the high-ion fractions differ only slightly from their CIE values.
If we start from the reported WHIM parameters derived from the Chandra observations, we can derive the via the additional relationship,
| (2) |
Taking the reported Nicastro et al. X-ray detections at face value, the km s-1 X-ray absorber is assumed to have ranging from K to K, based on O VI/O VII/O VIII column density detections and limits. The km s-1 system is inferred to have a somewhat narrower temperature range, K, from N VI/N VII ratios and an O VI non-detection (Savage et al., 2005). These WHIM parameters predict Ly absorbers with column density , km s-1, and mÅ at the absorber; and , km s-1, and mÅ at (Table 1). We assume (Asplund et al., 2009) and . Lower abundances of oxygen would scale these predictions upwards.
3.1. Signal-to-Noise and Significance Levels
The predicted BLAs are very weak (line-center optical depth %) and much broader than the km s-1 instrumental resolution of COS. They will be difficult to detect in even high-quality HST/COS spectra and will require a good understanding of the signal-to-noise ratio and systematics in the data. The per-pixel scatter in the normalized, coadded data gives signal-to-noise per pixel over the Ly forest wavelength range. In the Poissonian ideal, pixel-to-pixel noise is uncorrelated, and combining adjacent pixels results in lower noise (and hence higher S/N) by the square root of the number of pixels binned. We find that binning or smoothing the line-less, normalized data by pixels results in an empirical relationship , consistent with the behavior in other datasets over a wider wavelength range (Keeney et al., 2011). The fact that the index on is less than shows that the noise in adjacent pixels is correlated to some degree, i.e., fixed pattern noise exists in the data.
The significance level of a detection depends on the observed equivalent width and the S/N of the data. Following the method of Keeney et al. (2011) (their equation A6), we calculate the significance level, , of an absorption feature in data binned by pixels as
| (3) |
where is the fraction of the total line profile encompassed by pixels. For lines much broader than the instrumental resolution, Keeney et al. find that is maximized when the data are binned to approximately the FWHM of the line or and that this binning encompasses of the total line area. Since each COS pixel in the region of the Ly forest is approximately 2.4 km s-1, this means
| (4) |
with in units of mÅ and in km s-1.
Applying Eq. 4 to observed lines, we confirm that the Ly forest line at 1228.0 Å is highly significant (). The weak absorption feature at 1246.4 Å assumed to be Ly at is a detection in optimally-binned data. Similarly, the stronger (1238.82 Å) line of the Galactic N V doublet is a detection and the blended Galactic Mg II doublet is significant at .
3.2. WHIM Parameter Space Accessible by BLA
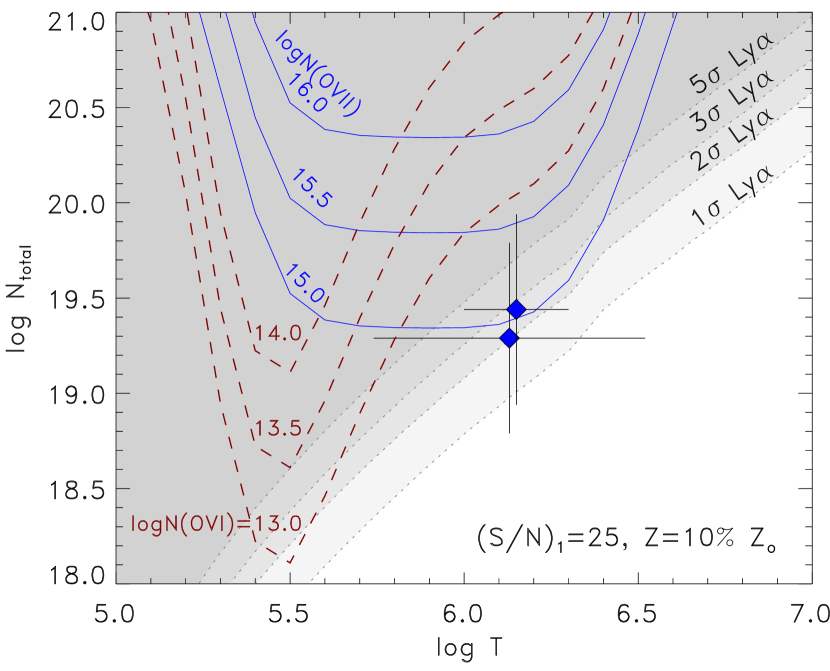
Figure 2 shows the temperature and total column density parameter space in which we might expect WHIM systems. HST/COS data with are sensitive to BLAs in the upper left half of the parameter space. Also shown are the regions in which WHIM could be detected via X-ray (O VII) and UV (O VI) metal-line diagnostics at various column densities in . The metal-line sensitivity limits scale on the vertical axis as gas.
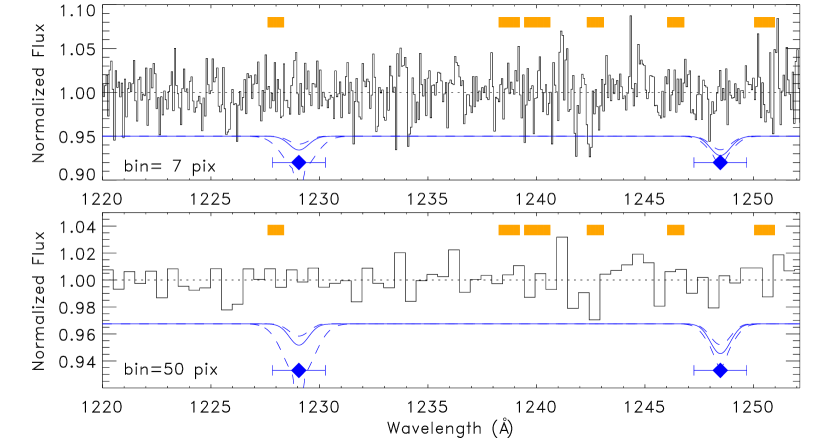
Can we confirm or disprove the X-ray WHIM detections based on the COS data? Figure 3 shows the COS data with identified absorption features removed (see Fig. 1) and then binned to 7 and 50 pixels in the upper and lower panels, respectively. The WHIM absorbers predicted from the X-ray measurements would appear at Å and Å (blue diamonds), both with a velocity uncertainty of km s-1 from N05. As predicted, broad features appear more significant in the lower panel where the pixel-to-pixel noise has been reduced and the binning width is closer to the characteristic line width. The N05 WHIM absorbers modeled via Eq. 3 are predicted to produce BLAs with doppler widths km s-1 and equivalent widths of and mÅ for the and features, respectively (blue curve in Figure 3). From Eq. 4, these would be significant (modulo the considerable range in predicted BLA properties; see Table 1) at the and levels in HST/COS data binned to pixels.
It is clear from Figure 3 that no absorption features appear in the COS data consistent in either line profile or centroid with the predicted WHIM absorbers. The claimed Great Wall WHIM detection should appear at significance at Å, but is not seen in the COS data. The 1246.4 Å feature was discussed above and was removed from the residual spectrum in Figure 3. While relatively broad for a Ly feature ( km s-1; K), it is inconsistent with the Nicastro et al. O VII detection at km s-1 in both redshift and inferred temperature. The 1228.0 Å Ly line is consistent in redshift with the claimed O VII system, but is far too narrow to arise in gas at K.
We therefore rule out WHIM absorption for the two systems with the redshift, temperature and metallicity reported by Nicastro et al. (2005a) at a level. However, if lower O VII column densities, higher temperatures, or higher metallicities are assumed, the () parameter space locations of the claimed WHIM systems move toward the lower right in Figure 2 and would not be detectable in the current COS data.
Two additional weak features become apparent in Figure 3 in locations unrelated to the O VII-predicted BLAs. While both appear significant in the highly-binned lower panel of Figure 3, they are best fitted as single, narrow components more typical of the photoionized Ly forest. The first is a feature near 1225.8 Å, a region uncontaminated by narrow absorption lines. It is well-fitted as a narrow Ly system ( km s-1, mÅ, ) at . The second residual feature appears as an absorption excess in the weaker Galactic N V line at 1242.5 Å. Measurement of this feature is complicated by the overlying N V absorption, but if the absorption profile of the stronger N V line is applied to the weaker line, the residual can be fitted as a feature: km s-1, mÅ, , if interpreted as Ly.
4. Conclusions and Implications
The Nicastro et al. (2005a) claims of O VII absorbers toward Mrk 421 were met with a great deal of skepticism in the X-ray community (Kaastra et al., 2006; Rasmussen et al., 2007). Even the more significant O VII system in the Great Wall ( cm-2) is only a mÅ feature in the Chandra LETG data and relies critically on the continuum model in the Å region. While Mrk 421 has been observed for a total of ksec over many different observing campaigns and features some of the highest data for any extragalactic X-ray target, a more reliable O VII detection limit may require cm-2 ( mÅ). Note that the strong ( cm-2) O VII absorption at toward Mrk 421 is uncontroversial. Indeed, it is typical of absorption seen in numerous extragalactic sight lines (Fang et al., 2002; Fang, Sembach, & Canizares, 2003; McKernan, Yaqoob, & Reynolds, 2004; Nicastro et al., 2002, 2005a; Wang et al., 2005; Williams et al., 2006; Buote et al., 2009) and is thought to arise in hot gas in the Galactic halo.
In this paper we highlight the diagnostic power of thermally-broadened Ly absorbers in far-UV spectra as tracers of WHIM gas. Mrk 421 was observed for less than half an hour (1.7 ksec or half an HST orbit) in the blue G130M mode of the Cosmic Origins Spectrograph, and yet it reaches WHIM detection levels comparable to those in ksec of X-ray observations with Chandra. Based on these high-quality data, we can rule out the existence of WHIM gas over a large region of () parameter space (see Figures 2, 3) along much of the Mrk 421 sight line. Specifically, we rule out the existence of broad Ly counterpart absorption to the claimed O VII WHIM absorbers at and (Nicastro et al., 2005a, b) at level. We cannot, however, rule out the existence of the claimed WHIM absorbers if their metallicities are higher than the assumed , if the O VII column densities are at the lower limits of their reported ranges, or if the temperatures are higher than the K inferred from ion ratios (Nicastro et al., 2005a, b; Savage et al., 2005). The Ly absorption in any of these systems would then be below the detection limit of the current COS data.
The search for missing baryons has long centered on the gas in the WHIM phase via one of several techniques. Roughly one hundred low- O VI detections have been reported in sight-lines (Danforth & Shull, 2008; Tripp et al., 2008; Thom & Chen, 2008) which give a statistically-significant sample of lower temperature, higher metallicity WHIM baryons ( K; ; see red contours in Figure 2). However, while the presence of these absorbers is agreed upon in most cases, their interpretation as WHIM gas is still controversial in roughly half the cases (see, Danforth, 2009). X-ray metal lines such as O VII seem to present a more secure identification of WHIM absorption, but suffer from small-number statistics and are still at or beyond the cutting edge of current X-ray instruments. Different, complementary techniques must be employed to verify the phase membership of the O VI systems and confirm the presence of X-ray WHIM absorbers.
The most convincing X-ray WHIM detections have relied on targeted searches of nearby supercluster filaments like the Sculptor Wall detection (Buote et al., 2009; Fang et al., 2010), the Pisces-Cetus Supercluster, and the Far Sculptor Wall (Zappacosta et al., 2010). The Sculptor Wall (at in the direction of the blazar target H 2356309) used both Chandra ACIS and XMM-Newton RGS to detect the O VII K absorption line at . The O VIII detection at (Fang et al., 2002) towards PKS 2155304 is coincident with a group of narrow Ly lines at the redshift of a group of spiral galaxies (Shull et al., 1998; Shull, Tumlinson, & Giroux, 2003). In many ways, the search for WHIM along the Mrk 421 sight line (whether via X-ray or UV metal ions or BLAs) should also be considered a targeted search, since this object lies just behind a section of the Great Wall, whether or not WHIM gas is ultimately confirmed.
Although the current dataset appears to rule out the WHIM detections claimed by N05, due to the imprtance of these claims, we plan to re-observe Mrk 421 with COS in HST Cycle 19. Deeper observations will either reveal a BLA feature below the current detection limit or place stronger constraints on WHIM gas in the sight line. Either way, the detection/non-detection of WHIM in the Great Wall will add an important data-point to the correlation of hot baryons and large-scale structure. The covering factor of WHIM gas around galaxy filamentary structure has significant impact on our understanding of the missing baryon problem at low-. Correlating the much larger catalogs of low- O VI detections (Danforth & Shull, 2008; Tripp et al., 2008; Thom & Chen, 2008) with galaxy redshift surveys may reveal additional filament-WHIM correspondence, and document the WHIM non-detections in similar LSS features.
This work was supported by NASA grants NNX08AC146 and NAS5-98043 to the University of Colorado at Boulder. CWD acknowledges feedback from F. Nicastro and M. Elvis.
Facilities: HST(COS)
References
- Asplund et al. (2009) Asplund, M., Grevesse, N., Sauval, A. J., & Scott, P. 2009, ARA&A, 47, 481
- Buote et al. (2009) Buote, D. A., Zappacosta, L., Fang, T., Humphrey, P. J., Gastaldello, F. & Tagliaferri, G. 2009, ApJ, 695, 1351
- Cen & Ostriker (1999) Cen, R., & Ostriker, J. P. 1999, ApJ, 519, L109
- Danforth & Shull (2005) Danforth, C. W., & Shull, J. M. 2005, ApJ, 624, 555
- Danforth & Shull (2008) Danforth, C. W., & Shull, J. M. 2008, ApJ, 279, 194 (DS08)
- Danforth (2009) Danforth, C. W. 2009, AIP Conf. Proc. 1135, 8, eds. G. Sonneborn, M. E. van Steenberg, H. W. Moos, & W. P. Blair (arXiv:0812.0602)
- Danforth et al. (2010a) Danforth, C. W., Stocke, J. T., & Shull, J. M., 2010a, ApJ, 710, 613
- Danforth et al. (2010b) Danforth, C. W., Keeney, B. A., Stocke, J. T., Shull, J. M., & Yao, Y. 2010b, ApJ, 720, 976
- Davé et al. (1999) Davé, R., et al. 1999, ApJ, 511, 521
- Davé et al. (2001) Davé, R., et al. 2001, ApJ, 552, 473
- Fang et al. (2002) Fang, T., Marshall, H. L., Lee, J. C., Davis, D. S., & Canizares, C. R., 2002, ApJ, 572, L127
- Fang, Sembach, & Canizares (2003) Fang, T., Sembach, K. R. & Canizares, C. R. 2003, ApJ, 586, L49
- Fang et al. (2010) Fang, T., Buote, D. A., Humphrey, P. J., Canizares, C. R., Zappacosta, L., Maiolino, R., Tagliaferri, G. & Gastaldello, F. 2010, ApJ, 714, 1715
- Ghavamian et al. (2009) Ghavamian, P., et al. 2009, COS Instrument Science Report 2009-01(v1), Preliminary Characterization of the Post-Launch Line Spread Function of COS (Baltimore: STScI)
- Gnat & Sternberg (2007) Gnat, O. & Sternberg, A. 2007, ApJS, 168, 213
- Green et al. (2011) Green, J. C. et al. 2011, ApJ, submitted
- Kaastra et al. (2006) Kaastra, J., Werner, N., den Herder, J. W., Paerels, F., de Plaa, J., Rasmussen, A. P., & de Vries, C. 2006, ApJ, 652, 189
- Kalberla et al. (2005) Kalberla, P. M. W., Burton, W. B., Hartmann, D., Arnal, E. M., Bajaja, E., Morras, R., & P ppel, W. G. L., 2005, A&A, 440, 775
- Keeney et al. (2011) Keeney, B. A., et al. 2011, in prep.
- Kriss (2011) Kriss, G. A. 2011, COS Instrument Science Report 2011-01(v1), Improved Medium Resolution Line Spread Functions for COS FUV Spectra (Baltimore: STScI)
- de Lapparent, Geller & Huchra (1986) de Lapparent, V., Geller, M. J. & Huchra, J. P. 1986, ApJ, 302, L1
- Lehner et al. (2007) Lehner, N., Savage, B. D., Richter, P., Sembach, K. R., Tripp, T. M., & Wakker, B. P. 2007, ApJ, 658, 680
- McKernan, Yaqoob, & Reynolds (2004) McKernan, B., Yaqoob, T., & Reynolds, C. S. 2004, ApJ, 617, 232
- Nicastro et al. (2002) Nicastro, F., Zezas, A., Drake, J., Elvis, M., Fiore, F., Fruscione, A., Marengo, M., Mathur, S., & Bianchi, S. 2002, ApJ, 573, 157
- Nicastro et al. (2005a) Nicastro, F., Mathur, S., Elvis, M., Drake, J., Fiore, F., Fang, T., Fruscione, A., Krongold, Y., Marshall, H., & Williams, R. 2005a, ApJ, 629, 700
- Nicastro et al. (2005b) Nicastro, F., Mathur, S., Elvis, M., Drake, J., Fang, T.,Fruscione, A., Krongold, Y., Marshall, H., Williams, R., & Zezas, A., 2005b, Nature, 433, 495
- Oppenheimer & Davé (2008) Oppenheimer, B. D., & Davé, R. A. 2008, MNRAS, 395, 1875
- Oppenheimer et al. (2011) Oppenheimer, B. D., Davé, R., Katz, N., Kollmeier, J. A., & Weinberg, D. H., 2011, MNRAS, submitted (ArXiv:1106.1444)
- Penton, Stocke, & Shull (2000) Penton, S. V., Stocke, J. T., & Shull, J. M. 2000, ApJS, 130, 121
- Osterman et al. (2011) Osterman, S., et al. 2011, Ap&SS, in press
- Rasmussen et al. (2007) Rasmussen, A. P., Kahn, S. M., Paerels, F., den Herder, J. W., Kaastra, J., & de Vries, C. 2007, ApJ, 656, 129
- Richter et al. (2004) Richter, P., Savage, B. D., Tripp, T. M., & Sembach, K. R. 2004, ApJS, 153, 165
- Richter et al. (2006) Richter, P., Savage, B. D., Sembach, K. R., & Tripp, T. M. 2006, A&A, 445, 827
- Savage et al. (2005) Savage, B. D., Wakker, B. P., Fox, A. J., & Sembach, K. R. 2005, ApJ, 619, 863
- Sembach et al. (2004) Sembach, K. R., Tripp, T. M., Savage, B. D. & Richter, P., 2004, ApJS, 155, 351
- Shull, Stocke, & Penton (1996) Shull, J. M., Stocke, J. T., & Penton, S. 1996, AJ, 111, 72
- Shull et al. (1998) Shull, J. M., et al. 1998, AJ, 116, 2094
- Shull, Tumlinson, & Giroux (2003) Shull, J. M., Tumlinson, J., & Giroux, M. 2003, ApJ, 594, L107
- Smith et al. (2011) Smith, B. D., Hallman, E. J., Shull, J. M. & O’Shea, B. W. 2011, ApJ, 731: 6
- Stocke, Danforth, & Perlman (2011) Stocke, J. T., Danforth, C. W., & Perlman, E. S. 2011, ApJ, 732, 113
- Thom & Chen (2008) Thom, C., & Chen, H.-W. 2008, ApJ, 683, 22
- Tripp et al. (2008) Tripp, T. M., Sembach, K. R., Bowen, D. V., Savage, B. D., Jenkins, E. B., Lehner, N., & Richter, P. 2008, ApJS, 177, 39
- Wakker et al. (2003) Wakker, B. P., et al. 2003, ApJS, 146, 1
- Wang et al. (2005) Wang, Q. D., Yao, Y., Tripp, T. M., Fang, T.-T., Cui, W., Nicastro, F., Mathur, S., Williams, R. J., Song, L., Croft, R. 2005, ApJ, 635, 386
- Williams et al. (2006) Williams, R. J., Mathur, S., Nicastro, F., & Elvis, M. 2006, ApJ, 642, L95
- Williams et al. (2010) Williams, R. J., Mulchaey, J. S., Kollmeier, J. A., & Cox, T. J. 2010, ApJ, 724, L25
- Yao et al. (2011) Yao, Y., Shull, J. M., & Danforth, C. W. 2011, ApJ, 728, L16
- Zappacosta et al. (2010) Zappacosta, L., Nicastro, F., Maiolino, R., Tagliaferri, G., Buote, D. A., Fang, T., Humphrey, P. J., & Gastaldello, F. 2010, ApJ, 717, 74