11email: georgios.magdis@astro.ox.ac.uk22institutetext: Department of Physics, University of Oxford, Keble Road, Oxford OX1 3RH 33institutetext: Space Science & Technology Department, Rutherford Appleton Laboratory, Chilton, Didcot, Oxfordshire OX11 0QX 44institutetext: National Optical Astronomy Observatory, 950 North Cherry Avenue, Tucson, AZ 85719, USA 55institutetext: Department of Physics & Institute of Theoretical and Computation Physics, University of Crete, GR-71003, Heraklion, Greece 66institutetext: IESL/Foundation for Research & Technology-Hellas, GR-71110, Heraklion, Greece 77institutetext: Chercheur Associé, Observatoire de Paris, F-75014, Paris, France 88institutetext: Spitzer Science Center, California Institute of Technology, Pasadena, CA. 99institutetext: Laboratoire d’Astrophysique de Marseille, OAMP, Université Aix-Marseille, CNRS, 38 rue Frédéric Joliot-Curie, 13388 Marseille Cedex 13 1010institutetext: Institute for Astronomy, University of Hawaii, Manoa, HI 96822, USA; Canada-France-Hawaii Telescope Corp., Kamuela, HI 96743, USA 1111institutetext: Max-Planck-Institut für Extraterrestrische Physik (MPE), Postfach 1312, 85741, Garching, Germany 1212institutetext: Department of Physics and Astronomy, University of British Columbia, Vancouver, BC V6T 1Z1, Canada 1313institutetext: Herschel Science Centre, European Space Astronomy Centre, Villanueva de la Cañada, 28691 Madrid, Spain 1414institutetext: Department of Astronomy University of Massachusetts, LGRT-B 618, 710 North Pleasant Street, Amherst, MA 01003 1515institutetext: Univ Paris-Sud, Laboratoire IAS, UMR8617, 91405, Orsay Cedex, France; CNRS, Orsay, 91405, France
GOODS-Herschel: A population of m dropout sources at 2 ††thanks: Herschel is an ESA space observatory with science instruments provided by European-led Principal Investigator consortia and with important participation from NASA.
Using extremely deep PACS 100- and m Herschel data from the GOODS-Herschel program, we identify 21 infrared bright galaxies previously missed in the deepest m surveys performed by Spitzer/MIPS. These MIPS dropouts are predominantly found in two redshift bins, centred at 0.4 and 1.3. Their / flux density ratios are similar to those of local (ultra-) luminous infrared galaxies (LIRGs and ULIRGs), whose silicate absorption features at m (at 0.4) and m (at 1.3) are shifted into the m MIPS band at these redshifts. The high- sub-sample consists of 11 infrared luminous sources, accounting for 2% of the whole GOODS-Herschel sample and putting strong upper limits on the fraction of LIRGs/ULIRGs at 1.0 1.7 that are missed by the m surveys. We find that a / 43 colour cut selects galaxies with a redshift distribution similar to that of the MIPS dropouts and when combined with a second colour cut, / 4, isolates sources at 1.0 1.7. We show that these sources have elevated specific star formation rates (sSFR) compared to main sequence galaxies at these redshifts and are likely to be compact starbursts with moderate/strong m silicate absorption features in their mid-IR spectra. Herschel data reveal that their infrared luminosities extrapolated from the m flux density are underestimated, on average, by a factor of 3. These silicate break galaxies account for 16% (8%) of the ULIRG (LIRG) population in the GOODS fields, indicating a lower limit in their space density of 2.0 10-5 Mpc-3. Finally, we provide estimates of the fraction of MIPS dropout sources as a function of the 24-, 100-, 160-, 250- and m sensitivity limits, and conclude that previous predictions of a population of silicate break galaxies missed by the major m extragalactic surveys have been overestimated.
Key Words.:
galaxies: active – galaxies: evolution – galaxies: formation – galaxies: starburst – infrared:galaxies1 Introduction
Accurate measurement of star formation rates (SFR) is a key ingredient for studying galaxy evolution and deriving the census of the star formation activity, both in the distant and in the local universe. To this end, it has been shown that the contribution of luminous infrared galaxies (with infrared luminosities 1011 L⊙) to the star formation density is progressively rising as we look back in cosmic time, at least up to 2. Indeed, although they were found to be rare in the local Universe and to account for only 5 of the total infrared energy emitted by galaxies at 0 (Soifer et al. 1991, Kim & Sanders 1998), LIRGs and ULIRGs ( 1012 L⊙), dominate the SFR density at 12, accounting for 70 of the star formation activity at these epochs (Papovich et al. 2004, Le Floc’h et al. 2005, Caputi et al. 2007).
The study of infrared sources was greatly facilitated by the advent of the Spitzer Space Telescope (Spitzer Werner et al. 2004). Extragalactic surveys carried out using the MIPS m band on-board Spitzer confirmed the strong evolution of these sources first indicated by infrared and submillimeter observations using ISO and SCUBA, respectively (Blain et al. 1999a, Elbaz et al. 1999, Serjeant et al. 2001, Dole et al. 2001). Such surveys are believed to detect the bulk of the dusty star forming galaxies up to 2. However there are two important caveats. The first is that the conversion of m flux densities to total (and therefore SFR) is subject to large uncertainties, as it relies on extrapolations that strongly depend on the assumed spectral energy distribution (SED) libraries (Chary & Elbaz 2001; Lagache et al. 2003; Dale & Helou 2002). The second comes from the prominent emission and absorption features between 3- and m in the spectra of star forming galaxies that parade through the m band at various redshifts.
A large number of studies using the Infrared Spectrograph (IRS, Houck et al. 2004) have revealed that the vast majority of local LIRGs and ULIRGs exhibit a broad silicate absorption feature centred at m with silicate optical depths ranging from 0.4 to 4.2 (Brandl et al. 2006; Armus et al. 2007; Pereira-Santaella et al. 2010). Furthermore, using a sample of local ULIRGs, Desai et al. (2007) found strong PAHs and prominent silicate absorption in the H II and LINER sources and weak PAHs and silicate absorption in Seyferts, suggesting that ULIRGs with strong PAHs but weak silicate absorption are rare. Similar features have been observed in the mid-IR spectra of high- galaxies (Higdon et al. 2004, Houck et al. 2005). For example, Menéndez-Delmestre et al. (2009) and Farrah et al. (2008) report a median 0.31 for a sample of submillimetre galaxies (SMGs) and IRAC selected ULIRGs respectively, while Sajina et al. (2007) found deeper silicate absorption features ( 1.1) in a sample of 2 radio-loud galaxies. Although for LIRGs and ULIRGs the identification and measurement of the silicate optical depths is straightforward, this is not the case for normal galaxies ( 1010 L⊙), as for the latter, it is difficult to discriminate between moderate PAH emission superimposed on a silicate-absorbed continuum and strong PAH features with a relatively weak underlying continuum (Smith et al. 2007).
Whatever its origin, the existence of this broad dip in the mid-IR spectra of star forming galaxies m could be of particular importance for galaxies in the redshift range of 1 1.8. At these redshifts the m filter samples this part of the spectrum and sources with such features would appear faint at m or even be undetected in this band (depending on the depth of the m data). A second broad dip that is common in the spectra of star forming galaxies is caused by another silicate absorption feature at m. This feature would have a similar effect for sources at 0.2 0.6.
The impact of these features on the mid-IR colours as a function of redshift were presented in detail by Takagi & Pearson (2005), who predicted a population of infrared luminous galaxies at 1.5 which, due to strong absorption at m, are not detected in the m band. Subsequent studies that focussed on the search for such silicate absorbed systems employed the m IRS peak-up image. Kasliwal et al. (2005) suggested that such objects account for more than half of all the sources at 12 predicted by various models. It has also been proposed that the mid-IR colour anomalies introduced by the silicate absorption feature can serve as a redshift indicator for dusty infrared luminous galaxies at 1.5 (Charmandaris et al. 2004, Teplitz et al. 2011, Armus et al. 2007). Similar claims have also been presented by Pearson et al. (2010), using the AKARI IRC L18W to MIPS24 band colour. These studies raised concerns about a possible bias introduced by the m selection, in the sense that a significant fraction of LIRGs and ULIRGs could remain undetected in m surveys. However, with little or no information about the far-IR part of the spectrum, these studies were subject to large extrapolation and hence suffered from large uncertainties.
With the successful launch of the Herschel Space Observatory (Herschel, Pilbratt et al. 2010), we now have access to wavelengths that directly probe the peak of the far-IR emission of high- galaxies and are in a position to measure with unprecedented accuracy their bolometric output. Deep Herschel extragalactic surveys can be used to determine the accuracy of our extrapolations of the far-IR properties of high- galaxies as well as test previous claims that m surveys miss a population of LIRGs and ULIRGs (m dropouts). In this paper, we use the deepest Herschel observations to date, as part of the GOODS-Herschel (GOODS-H) program (PI D. Elbaz), covering both the north and the south part of the GOODS fields (GOODS-N and GOODS-S respectively), (Dickinson et al. 2003, Giavalisco et al. 2004), to search for such sources. In Section 2 we present the Herschel data, introduce the GOODS-H sample of galaxies, and identify m dropout sources, i.e., sources detected in the PACS bands but not at m. In Section 3 we investigate the properties of this population, while in Section 4 we extend our study to the whole GOODS-H sample. Finally in Section 5 we provide estimates of the fraction of 2 MIPS dropout sources as a function of the m, m and m sensitivity limits and summarize our results.
2 Herschel data and sample selection
Herschel observations were obtained as part of the open time key program GOODS-H (PI D.Elbaz). The full GOODS-N field was imaged with the PACS (Poglitsch et al. 2010) and SPIRE (Griffin et al. 2010) instruments at 100, m (PACS) and 250, 350, m (SPIRE). The total observing time was 124.6 hours ( 2.5h / sky position) and 31.1 hours for PACS and SPIRE respectively. Similarly a part of the GOODS-S field was observed by PACS over a total of 264 hours ( 15h / sky position). Observations of both fields were carried out by adopting the intermediate speed () scan-map mode. Both PACS and SPIRE data were processed through the standard Herschel reduction pipeline, version 6.0.3, within the HCSS environment. Additionally, we employed custom procedures aimed at removing of interference patterns, tracking anomalies, re-centering positional offsets, and mapping. A full description of the data reduction procedures will be given in a companion paper (Leiton et al. 2011 in prep).
2.1 Prior based Source extraction; The GOODS-H sample
Given the large beam size of the Herschel bands, (FWHM 6.7′′, 11.2′′,18.0′′, 25.0′′, 36.0′′ for PACS 100- and m and SPIRE 250, 350 and m), a common approach to performing source extraction has been a guided extraction using priors. Here we will give a brief summary of the procedure as an extensive description of the method is given in Elbaz et al. (2011). Source extraction and photometry were obtained from point source fitting at prior positions defined by m sources with fluxes brighter than 20 Jy for the m maps and down to 30 Jy for the m and m maps. For the other two SPIRE bands, a secondary criterion was needed, as the m sources were far too numerous and would lead to an over-deblending of the actual sources. Hence, only sources with S/N 2 at m were considered as priors for the longer wavelength SPIRE bands. This choice was optimized by Monte Carlo (MC) simulations to avoid artificial over-deblending of a source, but also to give clean residual maps.
Flux uncertainties were based on local estimates of the background noise at the position of the sources from residual images produced after subtracting detected sources, while global noise estimates for the maps were derived from Monte Carlo simulations. This used artificial sources injected into the Herschel maps and source extraction performed in the same manner as for the real sources. The dispersion between input and recovered fluxes provides a secure estimate of the completeness and the noise properties of the map. The two noise estimates were found to be in good agreement.
To construct the GOODS-H sample, we considered sources with flux densities down to 3 in the PACS bands, i.e. 1.0 and 2.6 mJy (0.7 and 2.6 mJy) at 100 and m in GOODS-N (GOODS-S). For the GOODS-N sample, where SPIRE data are available we also considered sources down to the 5 detection limit, i.e. 6.3, 7.1, and 15.0 mJy at 250, 350 and m, respectively. The choice of a higher S/N cut for the SPIRE catalogues was dictated by the larger beam size and the confusion noise that significantly affects the SPIRE observations (for more details see Elbaz et al. 2011). Herschel catalogs were then matched with the existing multi-wavelength data of the GOODS team to create a multi-band merged catalogue of GOODS galaxies including HST ACS BViz, J,K, IRAC, Spitzer MIPS 24 and m, Herschel PACS 100 and m, and Herschel SPIRE 250, 350 and m. Among our sources, 65 have secure spectroscopic redshifts, while for the rest, we use the reliable compilation of photometric redshifts by Le Borgne et al (2009). Hereafter we will refer to this sample as the GOODS-H sample.
2.2 Blind source extraction; The m dropout sample
Since the main aim of this work is to investigate whether Herschel observations reveal a population of galaxies that were previously missed by m surveys, we also performed blind source extraction in the two PACS bands using Starfinder, a point spread function (PSF) fitting code (Diolaiti et al. 2000). We first extracted PSF profiles from the final science maps that were used to perform source extraction. Aperture corrections were derived based on calibration observation of the asteroid Vesta, while the flux uncertainties were derived based both on the error maps and Monte Carlo simulations, as described above. Monte Carlo simulations were also employed to obtain the level of completeness and the fraction of spurious sources. Both the derived fluxes and the noise properties of the maps are in good agreement with those obtained by the prior based source extraction. Finally, a critical parameter in Starfinder is the correlation threshold (ct), a measure of the similarity between the PSF used for source extraction and the profile of the extracted source, with ct=1 corresponding to identical profiles. MC simulations indicate that high ct values result in catalogs immune to spurious detections but with lower completeness levels. Similarly lower ct values correspond to higher completeness but also to higher fractions of spurious sources. For our blind catalogs we consider sources with flux densities above the 4 detection limit at each band and ct 0.67, for which the fraction of spurious sources is 3%.
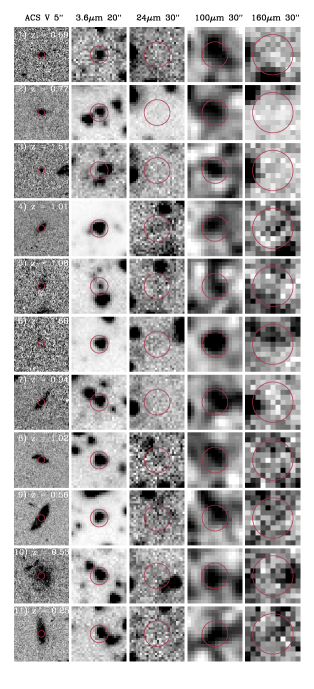
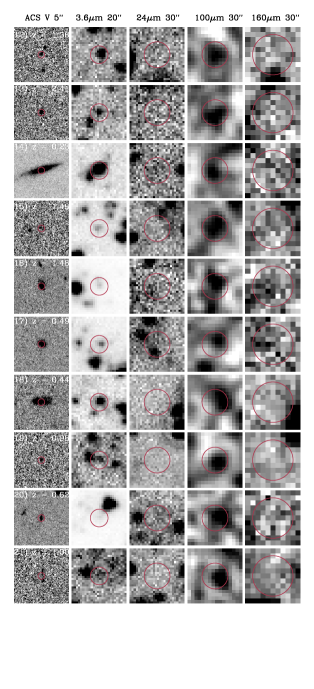
In principle, our aim was to find sources detected in either of the PACS bands but undetected at m. Therefore, we first matched the PACS 100- and m blind catalogs with the MIPSm sample down to 20 Jy (3), i.e. the one that served as a pool for the prior based source extraction, starting from the longest wavelength available and using search radii of and respectively. Sources with m counterparts were omitted while the rest were matched to the IRAC 3.6 m catalogue and subsequently to the master GOODS multi-bands catalogue described in the previous section. We also performed photometry in the m maps at the position of the PACS sources to ensure that there is no m source at this position, possibly missing from the m catalogue. We calculated the corrected Poissonian probability that an association of a PACS source within the search radius is a chance coincidence (see Downes et al. 1986) and all sources were found to have a robust ( 0.05) 3.6 m counterpart. We also note that flux boosting due to insufficient de-blending, which is the main caveat of blind source extraction, should not, by definition, be an issue for the m dropout sample. All sources were also inspected by eye and a quality flag was attributed to them. In particular, sources with multiple IRAC counterparts within the PACS beam and sources close to bright objects in the PACS bands were flagged as low quality sources. The final sample consists of 21 MIPS dropout sources, all detected at m and two at m, accounting for 2% of the total sources detected in the PACS bands. Hence, we find that even at the confusion limit of the 100- and m passbands (0.7- and 2.6 mJy at a 3 level), 98 % of the Herschel sources possess a robust m counterpart brighter than 20 Jy. The 21 MIPS dropout sources are shown in Fig. 1 where we present cutout images at several bands.
3 m dropout sources
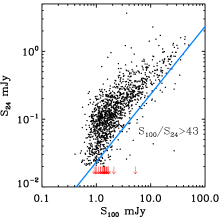
The small number of m dropouts indicates that the vast majority of PACS sources do have a m counterpart. In other words, the “normal” SED behaviour of galaxies in the GOODS sample is the one where the relative sensitivity at m overpowers that of the PACS bands. In Fig. 2 (left) we plot the flux density at m over that at m for the whole GOODS-H sample, as well as for the dropout sources and see that the latter depart from the general trend and are relatively faint at 100m. We also note that similarly to the MIPS dropouts, some sources with m detection tend to exhibit redder / colours than the bulk of the population while they span a wide range of . Here we will study the origin of the departure of the MIPS dropouts from the bulk of the GOODS-H sample and our investigation will be driven by their property that intrigued our interest in the first place i.e. their unusual / colour.
3.1 Far-IR properties
The total infrared luminosity ( = ) of galaxies in the sample was determined from the m flux density using the templates of (Chary & Elbaz 2001, CE01) and Dale & Helou (2002) (DH02). Despite the lack of data points at longer wavelengths, we note that the monochromatic derivations of total IR luminosities from the m flux density tend to be robust up to 1.5 (Elbaz et al. 2010). For the two sources with m detection was determined from the best fit of the two PACS points, using the whole library of SED templates from CE01 independently of their luminosity (i.e. allowing normalization of all SEDs to the observations) as well as the DH02 templates. The derived luminosities range from 8 109 to 2 1012 L⊙, with 11 of the MIPS dropout sources having 1011 L⊙, belonging to the class of luminous infrared galaxies.
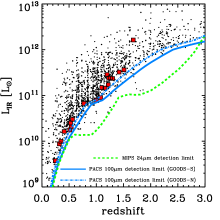
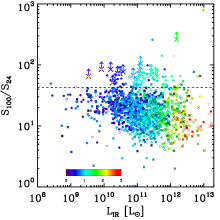
To illustrate the completeness of our sample in terms of , we plot the for the GOODS-H sample, as well as for the drop-out sources as a function of redshift, along with the corresponding detection limits at 100m and 24m (Fig.2 middle). Furthermore, In Fig. 2 (right), we also plot the / colour as a function of as derived from the Herschel data, both for the whole GOODS sample as well as for the MIPS dropouts (crosses with arrows). For the latter we compute lower limits to / assuming the 3 detection limit of the m maps. The points are also colourcoded based on their redshift. We see that m dropouts have values similar to that of the whole GOODS-H sample (for a given redshift), while they exhibit significantly higher / colours for the whole range of luminosities. As we discussed above, scales with . Hence, given the richness of features in the rest frame MIR emission (i.e. Armus et al. 2007), it is more likely that the dropouts have a suppressed emission rather than an excess at when compared to the rest of the GOODS-H sample. In what follows we investigate the origin of this deficit.
3.2 / colour and redshift distribution
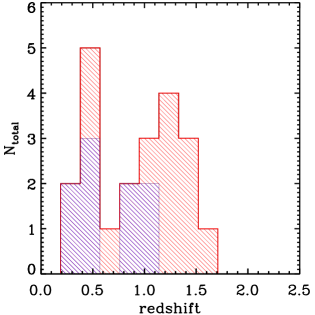
We wish to examine whether the MIPS dropout sources tend to be found at specific redshifts. We note that nine sources have spectroscopic redshift, while for the rest we adopt the photometric redshifts derived by the GOODS team. It appears that m dropouts are distributed in two redshift bins, one centred at 0.4 and one at 1.3 (Fig. 3). This bimodality is verified by a KMM test (Ashman et al. 1994) at a 4.3 confidence level. Therefore, it seems that our sample is populated by low- (0.2 0.6) and high- (0.9 1.7) sources.
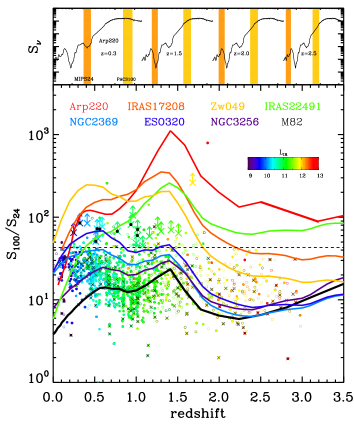
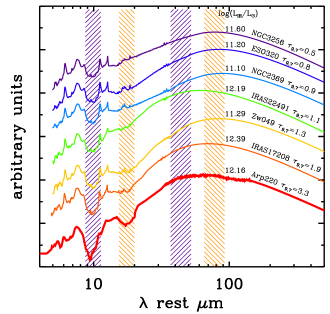
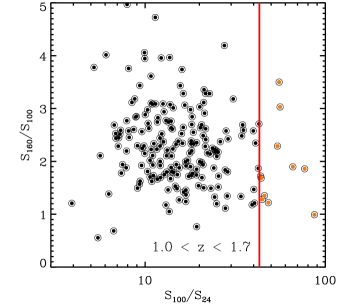
Similarly to Fig. 2, we now plot the / colour as a function of redshift (Fig. 4). In this figure we also overplot the / colour as a function of redshift for a number of local LIRGs/ULIRGs based on their observed SED as constructed by IRS observations of their mid-IR spectrum (Armus et al. 2007) and IRAS observations of their far-IR emission (Rieke et al. 2009). The observed templates were chosen to span a wide range of and silicate optical depths () and their full SEDs are presented in Fig. 5, in order of increasing . The measurements are adopted from Armus et al. (2007) (Arp200, NGC 22491), Pereira-Santaella et al. (2010) (ESO 320-G030, NGC 2369, Zw 049.057, NGC 3256) and da Cunha et al. (2010) (IRAS 17128). On the top of Fig. 4 we also show the SED of Arp220, along with the 24- and m bands at several redshifts. It is evident that the / colour of the templates varies significantly as a function of redshift, mainly due to the presence of the silicate absorption features at 9.7- and m that enter the MIPS m filter at 1.4 and 0.3 respectively. We also note a wide range of / colours for a given redshift, indicative of different amounts of extinction as well as different dust temperatures. Indeed, Fig. 5 suggests a weak trend for SEDs of sources with deeper silicate absorption to peak at shorter wavelengths. Therefore, the / values increase because is suppressed by the silicate absorption features, but are also further elevated due to higher dust (big grain) temperatures and hence values.
Looking back at Fig. 4, we see that m dropouts, although they have higher / values when compared to the whole sample, exhibit colours that are consistent with those of local star formation dominated ULIRGs/LIRGs. The fact that the redshift distribution of m dropouts peaks at redshifts where the 9.7- and m silicate absorption features enter the m band indicates that these sources could have moderate/strong silicate absorption features. On the other hand, the high / ratio could also result from lower levels of observed dust continuum emission at 24m, but as we will see later that our data disfavour this scenario. In any case, all m dropouts fall within the envelope defined by the templates, so they form an extreme rather than an extraordinary population of star forming galaxies. We also note that none of the drop-out sources have an X-ray detection or meet the criteria for a powerlaw AGN.
Previous studies have attempted to identify infrared luminous sources that are undetected at m by combining m IRS peak-up imaging with m data (Kasliwal et al. 2005, Teplitz et al. 2011) and following an approach similar to the one presented in this work. They searched for sources at 1.3, that are faint at m, due to the shift of the silicate absorption features into the MIPS band, but bright at m due to m PAH emission, concluding that sources with / 1.2 tend to be found at 1.1. They also investigated the / colours of several local LIRGs/ULIRGs and report an average ratio of 1-2 for galaxies with strong silicate absorption features. From our m dropout sample, none of the sources are detected at m down to the 3 detection limit ( 40 Jy for GOODS-N and 65 Jy for GOODS-S, Teplitz et al. 2011). Apart from the fact that some of our sources are outside the area covered by the IRS peak-up image in the GOODS fields, the non-detection of the rest of the sources at m is somewhat expected from the discussion above. Even if we adopt a = 20 Jy for all sources in the sample and assume a / = 2.0 (Arp220 case, Armus et al. 2007) then our sources should only be marginally detected at the depth of the m GOODS maps.
3.3 A 1.68 ULIRG, missed by MIPS
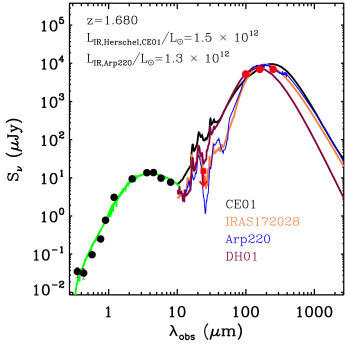
Although the study of the properties of individual m dropout sources is beyond the scope of this study, here we wish to have a closer look at a specific source for which, Herscheldata indicate an infrared luminosity 1012 L⊙. This is the only source in our high- sample with detection at m ( = 5.2 0.42 mJy), m ( = 6.9 1.1mJy) and at m. The source also has also a 6 detection at the GOODS-N VLA 1.4GHz map ( = 32.1 5.1 Jy). Unfortunately, the source is out of the area covered by IRS m peak-up imaging. Cut out images of this galaxy are shown in the sixth row of Fig. 1. To derive the far-IR properties of the source we fit the observed Herschel points with CE01 models, but also with a range of observed SEDs of local ULIRGs, described in the previous section. The observed multi-band photometry, together with the best fit SEDs are shown in Fig. 6.
The derived infrared luminosity of the source is = 1.31.6 1012 L⊙ (depending on the assumed SED), but it is evident that only templates with a strong silicate absorption feature at m can reproduce the non-detection down to 20 Jy at m. Fitting the optical part of the SED with BC03 models, yields a stellar mass of 8.9 (0.5) 1010 M⊙, while based on the slope of the UV spectrum we derive a reddening E(BV) = 2.1, consistent with a heavily obscured source. Assuming a Salpeter IMF and the Kennicutt (1998) relation we convert the Herschelbased to star formation rate and derive SFR 280 M⊙ yr-1. Similarly, we convert the radio flux to (Condon 1992) and subsequently to SFR, finding that the two estimates are in perfect agreement ( = 300 32 M⊙ yr-1). The source is not detected in X-rays and exhibits the m stellar bump, indicating that there is no near-to-mid-IR evidence for the presence of an AGN. The above analysis suggests that this is a heavily obscured starburst galaxy with no signs of AGN activity. Although unique in our sample, this galaxy raises the question of how many such objects we might have missed in the pre-Herschel era and what would be their contribution to the cosmic SFR density. A detailed discussion on this point will be presented in section 5.
4 Silicate-break galaxies
So far, we have demonstrated that Herschel data have revealed a small but interesting class of infrared luminous galaxies, which are undetected at m. The main characteristic of these sources is their atypically red / colour. Furthermore, Fig. 2 (left), reveals that sources with / colours similar to those of the dropouts can be found among sources with m detection. In what follows we extend our study to the whole GOODS-H sample, searching for such objects.
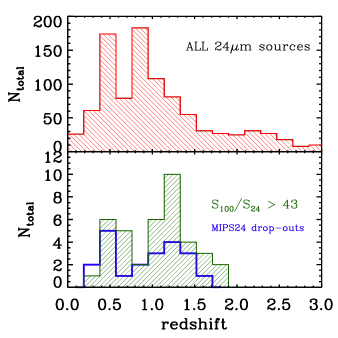
To select them, we adopt a cut off, / 43, that corresponds to the bluest lower limit among the MIPS dropout sample and the colour of the local LIRG ESO320 shifted at . In Fig. 7 we plot the redshift distribution of sources with / 43 (excluding the dropouts), finding that it bears a remarkable resemblance to that of the m dropouts in Fig. 3. Indeed, a K-S test reveals that there is no significant difference between the two samples with a value of 0.61. In contrast, we find that the sample has a redshift distribution quite different than that of the whole GOODS-N sample (Fig. 7, top panel) at a confidence level of 97.5. Similar to the dropout sample, sources with / 43 exhibit a bimodal redshift distribution at the 3.5 level, centred at 0.48 and 1.3. Therefore, in what follows, we suggest that the / colour could serve as redshift indicator.
4.1 / colour as a redshift indicator.
In the pre-Herschel era, there were several attempts to use anomalous MIR colours as a crude redshift indicator. These studies mainly employed the m IRS peak-up imaging and proposed that a blue / colour would peak in a narrow redshift bin, 1.0 1.8 (Armus et al. 2007, Teplitz et al. 2011), as well as being useful for selecting infrared luminous galaxies in this redshift bin that were undetected by the m band. The main idea behind this criterion is that at these redshifts the m silicate absorption feature enters in the m passband, while the strong PAH emission features at 6.2- and 7.7 m are shifted into the m band, producing a distinctive blue / colour. For example, Kasliwal et al. (2005) used a / 1.2 ratio to select objects at 1.1 1.6, and called them “silicate-break galaxies”, attributing their blue / colour to the existence of a strong silicate absorption feature at m. This approach had two main caveats. First, the blue / colour is not necessarily produced by a silicate absorption feature, as similar colours can appear for sources with strong PAHs and low dust continuum. Second, many objects at lower redshifts fall within the same colour cut (Teplitz et al. 2005). A more recent attempt by Teplitz et al. (2011), reports that a higher ratio (/ 1.4), would eliminate many but not all of the low- interlopers.
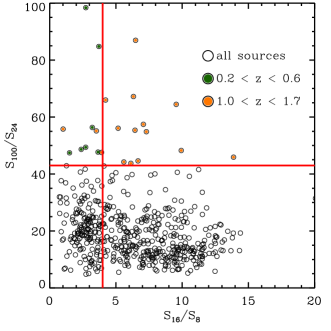
Here, we face the same situation. The cut in the / ratio that we have adopted selects sources in two redshifts bins. In order to reject the low- sources in our sample, simply increasing the / cut is not useful as apart from the low-, we also miss many high- sources and the selection is still not pure enough. Alternatively, we can employ a second colour criterion, based on the m and m flux densities. In Fig. 8 we plot the / vs / colour colour diagram for sources that have a 16- and m detection. We see that if a ratio cut of / 4 is combined with a / cut 43, then we successfully reject all low- interlopers, while selecting sources in the 1.0 1.7 redshift bin. The selection of / as a second colour criterion was driven by the fact that at 1.0 1.7 the m band probes the PAH complex (6.2 7.7m), boosting the value of while for the low redshift sources only traces emission from a warm dust continuum at m. We note that none of our sources is classified as an AGN, based on their X-ray emission, their optical spectra or their mid-IR colours (i.e. power law AGNs). It therefore seems that we have found a way to select star-forming high- galaxies in a narrow redshift bin. In what follows we argue that these sources are compact starbursts with moderate/strong silicate features in their MIR spectrum.
4.2 Evidence for silicate absorption
We have already discussed in the Introduction, that for normal galaxies, i.e. those with 1010 L⊙, discriminating between moderate PAH emission superposed on a silicate-absorbed continuum and strong PAH features with a relatively weak underlying continuum is a difficult task (e.g. Smith et al. 2007), even when high quality mid-IR spectra are available. A typical example is M82, for which Sturm et al. (2000) suggests that there is no silicate absorption since the m dip can be reproduced by a superposition of strong PAHs and VSG continuum. On the other hand, things are more straightforward for more luminous infrared sources, where there is clear evidence for the existence of a wide range of silicate optical depths, both for local and high- LIRGs and ULIRGs (Armus et al. 2007, Pereira-Santaella et al. 2010). Unlike the sample based on the blue / colour, for which the estimates were based on large/uncertain extrapolations, our study benefits from more robust Herschelbased estimates. The fact that all sources with / 43 at 1.0 1.7 in our sample (including the high- m dropouts) have 1011 L⊙, coupled with the lack of observational evidence of sources with similar luminosities and low dust continuum emission, is a first hint that these sources have a silicate absorption feature at m.
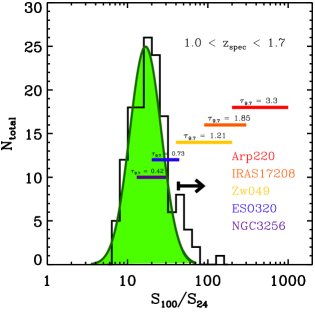
We have already demonstrated in Fig. 4, that these sources have / colours consistent with those of local templates of LIRGs and ULIRGs with moderate/high silicate strength. To further investigate this, we plot the distribution of the / colour of the GOODS-H (GOODS-N and GOODS-S) sources with spectroscopic redshift at 1.0 1.7, along with the range of the / colour at this redshift range for 5 LIRG/ULIRG observed templates with a wide range of values (Fig. 9). In practice, this plot examines the detailed distribution of galaxies in the 1.0 1.7 region of Fig. 4. Fitting the colour distribution with a Gaussian indicates a clear excess in the red tail due to sources with / 43. It is crucial to stress that this excess is absent in other redshifts bins. Furthermore, we see that based on the template SEDs, sources with higher optical depth exhibit redder / colours in this redshift bin. In other words, it seems that the / colour could serve as a rough indicator of the silicate strength. Our sources, i.e. those with / 43, have colours consistent with 0.7 1.9, while it appears that none of them have a silicate feature as strong as that of Arp220. We note however, that we cannot rule out a source in our sample with stronger silicate but colder .
An alternative explanation of the high / ratios of these sources would be enhanced m emission, simply because the sources are warmer, and hence their SEDs peak at shorter wavelengths. To test this, we investigate the / colour as a function of dust temperature, as indicated by the / ratio. In Fig. 10, we present this colourcolour diagram for sources at 1.0 1.7, which are detected at 160-and m. It appears that the adopted / cut does not introduce a bias towards warmer sources (i.e. sources with low / colours), as it selects sources with a wide range of dust temperatures similar to that found for the whole GOODS-H sample in this redshift bin, suggesting that an enhanced is not the main reason for their high / ratios. We note that a large dispersion of dust temperature of high- galaxies has recently been demonstrated by Hwang et al. (2010) and Magdis et al. (2010d).
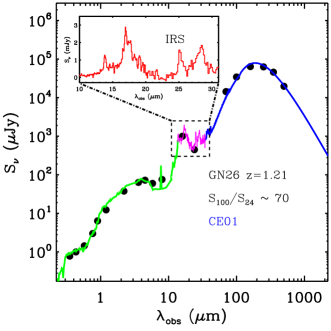
One of the sources that meets the selection criteria is the well studied sub-millimetre source at = 1.21, GN26 for which Pope et al. (2008) have published an IRS spectrum. The detection of this source in the PACS bands has also been discussed by Dannerbauer et al. (2010) and Magnelli et al. (2010) while Frayer et al. (2008) has reported the detection of CO(21) emission. In Fig. 11, we show the full SED of the source, overlaid with the best CE01 template for the far-IR part and the observed IRS spectrum for the mid-IR part of the SED. The IRS spectrum of GN26 is also presented separately in an inset panel. This source has / 70, and according to Fig. 9, it should have a silicate optical depth of 1. Although the S/N of the IRS spectrum does not allow for a robust measurement of , its IRS spectrum is very similar to that of the composite spectrum of SMGs presented in Pope et al. (2008), and for which they report 1 in excellent agreement with what we expected based on this source’s / colour. We should also note that GN26 was one of the 13 sources used for the construction of the composite spectrum. Taken together, the evidence suggests that the red / colour of our sample is caused by the existence of a moderate/strong silicate absorption feature at m, that enters the m band at these redshifts. We therefore choose to characterize these sources as silicate-absorbed galaxies.
4.3 The far-IR properties of the high- sample
In the pre-Herschel era the far-IR properties of large samples of galaxies were derived based on large extrapolations of their m flux density using SED templates based on local IR-luminous galaxies. Recent studies using Herschel data have confirmed the validity of these extrapolations, demonstrating that the m flux density is a good proxy of the total , at least up to 1.5 (Elbaz et al. 2010). On the other hand, here we have found a population of high- sources (1.0 1.7), that exhibit atypically red / colours. For these sources, we expect that estimates based on their , and using average template SEDs, such as CE01 and DH02, would be severely underestimated.
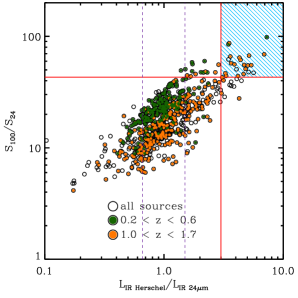
In Fig. 12 we plot the / colour of all GOODS-H galaxies as a function of the ratio between the Herschel based and the one derived using only the m flux density. Although for the majority of the sources the two estimates are in good agreement (within a factor of 1.5), for the high- sources with / 43 the m flux density would underestimate the true on average by a factor of 3. This is not the case for the low- sample where the two estimates are in better agreement. For the high- sample there is a clear trend between the / colour and the ratio of the two estimates, in the sense that the true is progressively underestimated for sources with redder / colours, depicting the limited variety of SEDs used for the derivation of the . This indicates that although the average template SEDs are representative for the bulk of the galaxy population at 1.5, this is not the case for a population at 1.0 1.7 with very red / colours ( 43 for this study).
4.4 The starburst nature of the high- sample
As the silicate absorption feature merely requires a mass of warm dust obscured by a significant column of cooler dust, it does not provide any insight into the mechanism that is heating the warm dust. Hence, it is difficult to establish a correlation between the strength of this feature and the source that powers the mid-IR emission of infrared luminous galaxies, as it could equally be produced by a deeply buried AGN or a compact starburst (Farrah et al. 2008, Imanishi et al. 2009, Armus et al. 2007).
We have already reported than none of our sources show direct signs of AGN activity, since none of them are either (a) detected in X-rays in the 2 Msec Chandra observations (Alexander et al. 2003), (b) satisfies the criteria of powerlaw AGN or (c) has high excitation lines in their optical spectra (where available). A deeply obscured AGN though, cannot be ruled out. To investigate this, we stack the Chandra X-ray data on these sources. We find a strong detection (7) in the 0.52 keV band corresponding to = 3 1041 erg sec-1 and no detection in the 27keV band (3 upper limit 1.28 10-17 erg cm-2 s-1). The derived upper limit in the hard band along the stacking results in the soft band suggest that the sources are dominated by star formation (Nandra et al. 2002, Lehmer et al. 2008). Furthermore, in most cases the radio based is in good agreement with that derived by Herschel, again indicating that those sources are dominated by a nuclear starburst, rather than an AGN.
It has recently been shown that normal starforming galaxies exhibit a correlation between their SFR and stellar mass at any given redshift. This correlation was first found among 0 galaxies (Brinchmann et al. 2004) and was subsequently extended to higher redshifts, 1 Elbaz et al. (2007), Noeske et al. (2007), 2 Daddi et al. (2007), Pannella et al. (2009), 3 Magdis et al. (2010a,b,c) and 4 Daddi et al. (2009). It has also been shown that star forming galaxies that do not follow this correlation tend to undergo a rapid starburst phase and have more compact geometries (Elbaz et al. 2011). For instance, at 0 and z 2, respectively, local ULIRGs and SMGs have SFRs that greatly exceed the SFRM∗ correlation. Both classes of objects are thought to host compact starbursts (Daddi et al. 2010, Tacconi et al. 2010). It would therefore be interesting to investigate the position of the sources with red / colour in the SFR - M⋆ diagram.
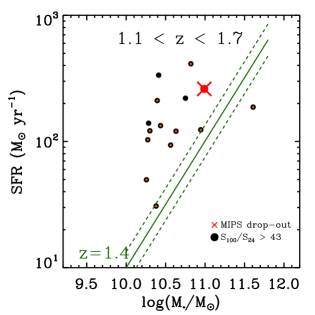
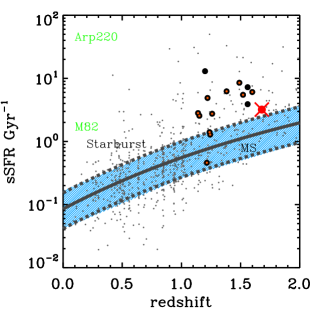
Using the Kennicutt 1998 relation and a Salpeter IMF, we convert the Herschel based to SFR for the sources with / 43 and 1.1 1.7 and we plot the derived SFR versus the stellar mass of the galaxies (Fig. 13, left). We also overplot the SFRM⋆ correlation at the median redshift of the sample i.e., = 1.4 (Elbaz et al. 2011). Clearly the sources are off the correlation, exhibiting enhanced star formation activity for their stellar mass. Similarly the ULIRG dropout source that we presented in section 3.3 is also off the correlation. To eliminate the effect of the evolution of the SFRM⋆ with redshift, we also show the specific star formation rate (sSFR), defined as SFR/M∗, as function of redshift for sources with / 43, as well as for the whole GOODS-H sample (Fig. 13, right). We also overplot the evolution of sSFR with time as derived by Elbaz et al. (2011), based both on detected sources and stacking analysis of the GOODS-H sample. According to Elbaz et al. (2011), sources within the blue shaded area are main sequence, normal star forming galaxies galaxies while sources above it, are considered to undergo a starburst phase. We find that sources with / 43 tend to have higher specific star formation rates when compared to main sequence star forming galaxies at this redshift range, and populate the starbursts region. This result is coherent with the picture where these sources are compact starbursts with high sSFR and where (like local ULIRGs) a strong silicate absorption feature at m is present in their mid-IR spectra.
5 Discussion
Previous studies predicted that the number of such silicate break sources could reach 900 to 1500 sources per square degree, depending on the assumed model (e.g. Tagagi & Pearson 2005). Furthermore, Kasliwal et al. (2005), based on m IRS data, reported that such sources account for more than half of all galaxies at 12 predicted by various models. The samples of silicate-break galaxies and MIPS dropout sources that we have found here can place strong limits on the number of 1.0 2.0 infrared luminous galaxies with similar properties.
In the 250 arcmin2 covered by PACS in the two GOODS fields, we have detected 30 (7) silicate absorbed candidates at 1.0 2.0 with / 43 and 1011 L⊙ ( 1012 L⊙). Assuming that all sources with / 43 at this redshift are silicate absorbed starbursts, and neglecting the effects of cosmic variance, this implies a surface density of 540 (220) sources deg-2, significantly lower than previous predictions. Using the co-moving volume within 1 2, this implies a space density of Si absorbed ULIRGs in this redshift bin of 2.0 ( 0.3) 10-5 Mpc-3. Comparing the numbers with the rest high- sample of GOODS-H, we find that these sources account for the 8% and 16% of the 1011 L⊙ and 1012 L⊙ sources at 1.0 2.0. We note though, that our sample is not complete. As illustrated in Fig. 9, sources with silicate absorption feature but cold have / 43 and are missed from the selection. We therefore conclude that this estimate is a rather conservative lower limit. Moving to the dropout sample, we have identified 11 sources with 1011 L⊙, accounting for approximately 12% of the population of 1 2 infrared luminous galaxies in GOODS-H as a whole. We note that by comparing to the whole GOODS-H sample in the same redshift range, all effects of incompleteness are taken into account. Finally, these number should be treated as upper limits, given that some of these could be spurious detections, as discussed in Section 2.
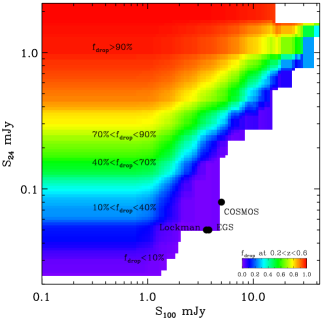
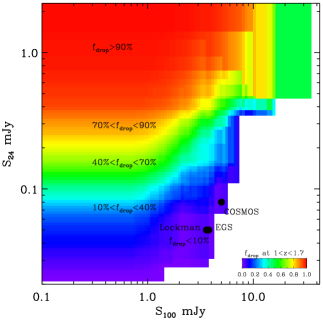
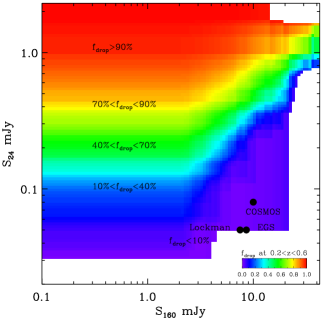
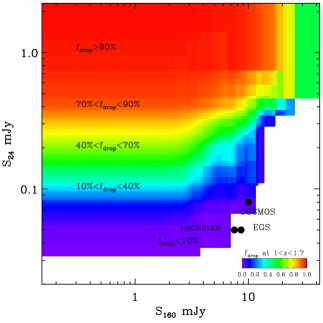
These estimates confirm that for the GOODS surveys, m observations recover the vast majority of 2 sources and do not introduce a strong selection bias. Furthermore, we confirm that using the m catalogues to define priors for the extraction of PACS sources should only miss a small fraction of high-z sources. Of course the ratio between the number of sources missed by the m band and the total number of sources in the PACS bands strongly depends on the depth of the MIPS m and PACS observations. This is illustrated in Fig. 14, where we show the fraction of the expected dropouts at 0.2 0.6 and 1.0 1.7 as a function of the 24- to m and the 24- to m depth. These estimates are solely based on observations (i.e. on the GOODS-H sample), without any further assumptions. We simply calculate the ratio of :
where and are free parameters. These diagrams can be used as diagnostic of the fraction of sources that will be missed by a source extraction method based on m priors for several extragalactic Herschel surveys, e.g. PEP (Lutz et al. 2011), HerMES (Oliver et al. in prep). We conclude that for the major extragalactic surveys, there is not a large population of silicate break galaxies that would have been undetected in m Spitzer data as some authors have previously suggested. This discrepancy could be indicative of an evolution of the strength of the silicate absorption feature with time. If the silicate features were weaker in early galaxies due to more extended star forming regions, then theoretical models based on local templates would grossly overestimate the number density of such sources. This scenario is in line with recent findings, where the star formation activity of the majority of high galaxies (including those with high ), is similar to that of local spiral galaxies (e.g. Daddi et al. 2010, Genzel et al. 2010).
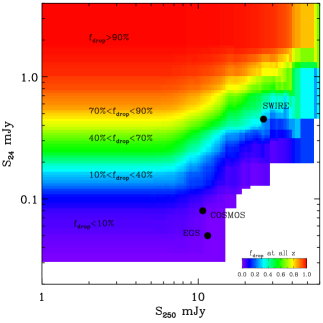
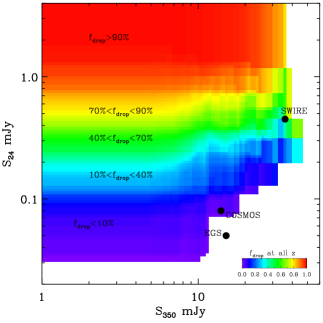
Finally, although in this work we have mainly focused on PACS data, it is worth attempting to quantify the fraction of sources that would be missed by a m prior based source extraction in the SPIRE bands. The philosophy behind Fig. 15 is identical to that of Fig. 14, but this time considering the whole redshift range of the sources and the (left) and (right) flux density limits. We note that these detection limits, indicate the expected instrumental noise and do not take into account the confusion noise, which is dominant in the SPIRE bands.
6 Conclusions
We have presented a study dedicated to sources that exhibit atypical / colours using the deepest PACS data to date, obtained as part of the GOODS-H program. By performing blind source extraction we searched for sources that are bright in the far-IR but undetected at m, i.e. for m dropout galaxies. Then we investigated the properties of sources in the GOODS-H sample with red / colours searching for the population of silicate-break galaxies. The main results are summarized below:
-
•
We have identified 21 PACS sources that are undetected at m (down to a 3 detection limit of 20 Jy). These m dropout sources are found to have a bimodal redshift distribution, with peaks centred at 0.4 and 1.3, and are expected to exhibit strong silicate absorption features, responsible for their depressed m emission. Among the sources in higher redshift we identify 10 LIRGs and one ULIRG at 1.68. This enables us to place upper limits in the fraction of LIRGs/ULIRGs that are missed by m surveys.
-
•
The vast majority of Herschel PACS sources are detected at m, indicating that a priorbased source extraction based on the m emission of the galaxies suffers only very modest incompleteness, with MIPS dropout sources accounting only for 2% of the infrared luminous population in the GOODS fields. Although this fraction is negligible for the GOODS surveys, m dropouts may be a concern for other Herschel extragalactic surveys with shallower m data.
-
•
Based on the mid- and far-IR colours of sources in the GOODS-H sample, we demonstrated that sources with / 43 and / 4 are located in a narrow redshift bin, . Furthermore, we provided evidence that sources selected in this manner are starburstdominated and with compact geometries. Similarly to the dropouts, the red / colours of these sources are attributed to the m silicate absorption feature in their mid-IR spectra that enters into the m band. We characterize them as silicate-absorbed galaxies.
-
•
The infrared luminosity of these silicate-absorbed galaxies, when derived based on their monochromatic m flux density, is on average underestimated by a factor 3. They account for about 16% of the ULIRGs in the GOODS fields with a space density of 2.0 10-5 Mpc-3.
-
•
We provide diagnostic diagrams to estimate the fraction of sources expected to be missed in the m band for several Herschel extragalactic surveys, and predict that for most of them that fraction is less that 10%.
Acknowledgements.
G.E.M. acknowledge the support of the Centre National de la Research Scientifique (CNRS) and the University of Oxford. H.S.H and D.E. acknowledge the support of the Centre National d’Etudes Spatiales (CNES) PACS has been developed by a consortium of institutes led by MPE (Germany) and including UVIE (Austria); KU Leuven, CSL, IMEC (Belgium); CEA, LAM (France); MPIA (Germany); INAFIFSI/OAA/OAP/OAT, LENS, SISSA (Italy) and IAC (Spain). This development has been supported by the funding agencies BMVIT (Austria), ESA-PRODEX (Belgium), CEA/CNES (France), DLR (Germany), ASI/INAF (Italy), and CICYT/MCYT (Spain). SPIRE has been developed by a consortium of institutes led by Cardiff University (UK) and including Univ. Lethbridge (Canada); NAOC (China); CEA, LAM (France); IFSI, Univ. Padova (Italy); IAC (Spain); SNSB (Sweden); Imperial College London, RAL, UCL-MSSL, UKATC, Univ. Sussex (UK); and Caltech, JPL, NHSC, Univ. Colorado (USA). This development has been supported by national funding agencies: CSA (Canada); NAOC (China); CEA, CNES, CNRS (France); ASI (Italy); MCINN (Spain); Stockholm Observatory (Sweden); STFC (UK); and NASA (USA). This work is based [in part] on observations made with Herschel, a European Space Agency Cornerstone Mission with significant participation by NASA. Support for this work was provided by NASA through an award issued by JPL/Caltech.References
- (1) Armus, L., Charmandaris, V., Bernard-Salas, J., et al. 2007, ApJ, 656, 148
- (2) Ashman, K. M., Bird, C. M., & Zepf, S. E. 1994, AJ, 108, 2348
- (3) Blain, A. W., Smail, I., Ivison, R. J., & Kneib, J. 1999, MNRAS, 302, 632
- (4) Brandl, B. R., Bernard-Salas, J., Spoon, H. W. W., et al. 2006, ApJ, 653, 1129
- (5) Brinchmann, J., Charlot, S.,White, S. D. M., et al. 2004, MNRAS, 351, 1151
- (6) Caputi, K. I., Lagache, G., Yan, L., et al. 2007, ApJ, 660, 97
- (7) Charmandaris, V., Uchida, K. I., Weedman, D., et al. 2004, ApJS, 154, 142
- (8) Chary, R. & Elbaz, D. 2001, ApJ, 556, 562
- (9) Condon, J. J. 1992, ARA& A, 30, 575
- (10) da Cunha, E., Charmandaris, V., D´ıaz-Santos, T., et al. 2010, A & A, 523, A78
- (11) Daddi, E., Dannerbauer, H., Stern, D., et al. 2009, ApJ, 694, 1517
- (12) Daddi, E., Dickinson, M., Morrison, G., et al. 2007, ApJ, 670, 156
- (13) Daddi, E., Elbaz, D., Walter, F., et al. 2010, ApJ, 714, L118
- (14) Dale, D. A. & Helou, G. 2002, ApJ, 576, 159
- (15) Dannerbauer, H., Daddi, E., Morrison, G. E., et al. 2010, ApJ, 720, L144
- (16) Desai, V., Armus, L., Spoon, H. W. W., et al. 2007, ApJ, 669, 810
- (17) Dickinson, M., Papovich, C., Ferguson, H. C., & Budav´ari, T. 2003, ApJ, 587,25
- (18) Diolaiti, E., Bendinelli, O., Bonaccini, D., et al. 2000, in Astronomical Society of the Pacific Conference Series, Vol. 216, Astronomical Data Analysis
- (19) Software and Systems IX, ed. N. Manset, C. Veillet, & D. Crabtree, 623
- (20) Dole, H., Gispert, R., Lagache, G., et al. 2001, A&A, 372, 364
- (21) Elbaz, D., Cesarsky, C. J., Fadda, D., et al. 1999, A&A, 351, L37
- (22) Elbaz, D., Daddi, E., Le Borgne, D., et al. 2007, A&A, 468, 33
- (23) Elbaz, D., Dickinson, M., Hwang, H. S., et al. 2011, ArXiv e-prints
- (24) Elbaz, D., Hwang, H. S., Magnelli, B., et al. 2010, A&A, 518, L29
- (25) Farrah, D., Lonsdale, C. J.,Weedman, D. W., et al. 2008, ApJ, 677, 957
- (26) Frayer, D. T., Koda, J., Pope, A., et al. 2008, ApJ, 680, L21
- (27) Giavalisco, M., Ferguson, H. C., Koekemoer, A. M., et al. 2004, ApJ, 600, L93
- (28) Griffin, M. J., Abergel, A., Abreu, A., et al. 2010, A&A, 518, L3
- (29) Higdon, S. J. U.,Weedman, D., Higdon, J. L., et al. 2004, ApJS, 154, 174
- (30) Houck, J. R., Roellig, T. L., van Cleve, J., et al. 2004, ApJS, 154, 18
- (31) Houck, J. R., Soifer, B. T., Weedman, D., et al. 2005, ApJ, 622, L105
- (32) Hwang, H. S., Elbaz, D., Magdis, G., et al. 2010, MNRAS, 409, 75
- (33) Imanishi, M. 2009, ApJ, 694, 751
- (34) Kasliwal, M. M., Charmandaris, V., Weedman, D., et al. 2005, ApJ, 634, L1
- (35) Kennicutt, Jr., R. C. 1998, ARA&A, 36, 189
- (36) Kim, D. & Sanders, D. B. 1998, ApJS, 119, 41
- (37) Lagache, G., Dole, H., & Puget, J. 2003, MNRAS, 338, 555
- (38) Le Floc’h, E., Papovich, C., Dole, H., et al. 2005, ApJ, 632, 169
- (39) Lehmer, B. D., Brandt, W. N., Alexander, D. M., et al. 2008, ApJ, 681, 1163
- (40) Lutz, D., Poglitsch, A., Altieri, B., et al. 2011, ArXiv e-prints
- (41) Magdis, G. E., Elbaz, D., Daddi, E., et al. 2010a, ApJ, 714, 1740
- (42) Magdis, G. E., Elbaz, D., Hwang, H. S., et al. 2010b, MNRAS, 409, 22
- (43) Magdis, G. E., Elbaz, D., Hwang, H. S., et al. 2010c, ApJ, 720, L185
- (44) Magdis, G. E., Rigopoulou, D., Huang, J., & Fazio, G. G. 2010d, MNRAS, 401,1521
- (45) Magnelli, B., Lutz, D., Berta, S., et al. 2010, A&A, 518, L28
- (46) Nandra, K., Mushotzky, R. F., Arnaud, K., et al. 2002, ApJ, 576, 625
- (47) Noeske, K. G., Weiner, B. J., Faber, S. M., et al. 2007, ApJ, 660, L43
- (48) Pannella, M., Carilli, C. L., Daddi, E., et al. 2009, ApJ, 698, L116
- (49) Papovich, C., Dole, H., Egami, E., et al. 2004, ApJS, 154, 70
- (50) Pearson, C. P., Serjeant, S., Negrello, M., et al. 2010, A&A, 514, A9
- (51) Pereira-Santaella, M., Alonso-Herrero, A., Rieke, G. H., et al. 2010, ApJS, 188, 447
- (52) Pilbratt, G. L., Riedinger, J. R., Passvogel, T., et al. 2010, A&A, 518, L1
- (53) Poglitsch, A., Waelkens, C., Geis, N., et al. 2010, A&A, 518, L2
- (54) Pope, A., Chary, R., Alexander, D. M., et al. 2008, ApJ, 675, 1171
- (55) Rieke, G. H., Alonso-Herrero, A., Weiner, B. J., et al. 2009, ApJ, 692, 556
- (56) Sajina, A., Yan, L., Lacy, M., & Huynh, M. 2007, ApJ, 667, L17
- (57) Serjeant, S., Efstathiou, A., Oliver, S., et al. 2001, MNRAS, 322, 262
- (58) Smith, J. D. T., Draine, B. T., Dale, D. A., et al. 2007, ApJ, 656, 770
- (59) Soifer, B. T. & Neugebauer, G. 1991, AJ, 101, 354
- (60) Sturm, E., Lutz, D., Tran, D., et al. 2000, A& A, 358, 481
- (61) Tacconi, L. J., Genzel, R., Neri, R., et al. 2010, Nature, 463, 781
- (62) Takagi, T. & Pearson, C. P. 2005, MNRAS, 357, 165
- (63) Teplitz, H. I., Charmandaris, V., Chary, R., et al. 2005, ApJ, 634, 128
- (64) Teplitz, H. I., Chary, R., Elbaz, D., et al. 2011, AJ, 141, 1
- (65) Werner, M. W., Roellig, T. L., Low, F. J., et al. 2004, ApJS, 154, 1