New brown dwarfs in the south part of the Upper Scorpius Association
Abstract
This paper presents the results of a search for brown dwarfs in the Upper Scorpius Association using data from the UKIRT Infrared Deep Sky Survey (UKIDSS) Galactic Cluster Survey. Candidate young brown dwarfs were first chosen by their position in colour magnitude diagrams with further selection based on proper motions to ensure Upper Scorpius membership. Proper motions were derived by comparing UKIDSS and 2MASS data. Using that method we identify 19 new brown dwarfs in the southern part of the association. In addition there are up to 8 likely members with slightly higher dispersion velocity. The ratio of brown dwarfs to stars was found to be consistent with other areas in Upper Scorpius. It was also found to be similar to other results from young clusters with OB associations, and lower than those without, suggesting the brown dwarf formation rate may be a function of environment.
keywords:
techniques: photometric – techniques: brown dwarfs – open clusters and associations: individual: Upper Scorpius – infrared: stars.1 Introduction
The shape of the initial mass function (IMF) is well established and constrained for stars greater than 0.5. In comparison, determining the low mass part of the IMF, particularly in the substellar regime below 0.08, has proven more challenging. In this mass range, the mass function may be affected by turbulent fragmentation, dynamical interactions, fragmentation of massive disks, photo-erosion of cores or other processes (see reviews by Whitworth et al. (2007); Bonnell et al. (2007)). Hence, in some theoretical scenarios, there could be wide variations in the form of the IMF below about 0.3 depending on the environment. To test these ideas, it is essential to carry out surveys for brown dwarfs in diverse environments.
Brown dwarfs are difficult to observe because they cool down rapidly with age. After 1 Myr a very low-mass star near the hydrogen burning boundary will have a luminosity only slightly greater than that of the highest mass brown dwarf, but after 1 Gyr the brown dwarf will have a luminosity an order of magnitude below the star (Oppenheimer et al., 1999). Because of their low temperatures and luminosity, searching for them is best done in the near infra-red in nearby young open clusters and star forming regions. The availability of wide-field near-infrared surveys such as 2MASS and UKIDSS thus greatly facilitates searches for substellar objects.
Most nearby star forming regions have been searched for brown dwarfs over the past decade (see review by Luhman et al. (2007)). In some clusters, the surveys have revealed a population of objects with masses below the Deuterium burning limit of 0.015 (Zaptero Osorio et al., 2000; Lucas & Roche, 2000). The ratio between the number of low-mass stars (0.08-1.0) and the number of brown dwarfs (0.03-0.08) – an empirical constraint on the IMF – has been determined to be between 3.3 and 8.5 (Andersen et al., 2008) and in one region 1.50.3 (Scholz et al., 2009). This might be a first indication for environmental effects on the IMF.
As of today, the brown dwarf surveys in star forming regions suffer from two problems: a) The surveys are incomplete at the low mass end, primarily due to strong and variable extinction in the molecular clouds. b) Most nearby star forming regions are rather similar in their physical characterics, for example, most of them do not harbour massive stars.
Here we report on a new brown dwarf survey in a part of the Upper Scorpius (hereafter UpSco) star forming region. UpSco is a favorable area for such a project, because it suffers from negligible extinction. At a distance of pc (de Zeeuw et al., 1999) it is the nearest OB assocation, and it represents our best chance of constraining the impact of massive stars on the formation of very low mass objects. With an age of about 5 Myr (Preibisch et al., 2002) UpSco is the youngest part of the Scorpius Centaurus Association, i.e. it has one of the better combinations of proximity and youth for a successful brown dwarf search. UpSco is spread over approximately 250 deg2 of the sky but wide-field surveys now cover a significant portion of this area.
This paper analyses an infra-red 12 deg2 survey of part of UpSco, which lies roughly within R.A. 15h 40m to 16h 20m and Dec. -30 to -27 and is generally free of extinction with (Ardila et al., 2000). Despite its youth (stars later than F type have yet to reach the main sequence) star formation appears to have finished in the association within 1 Myr of commencing (Preibisch & Mamajek, 2008; de Zeeuw et al., 1999) so all members of the association are coeval. In Section 2 details of the survey and the data obtained are presented. Section 3 describes the selection of young brown dwarf candidates from photometric and proper motion analysis. The results of this selection are used to analyse the IMF of Upper Scorpius in Section 4. Finally, in Section 5, our conclusions are drawn.
2 Survey And Data Sets
The United Kingdom Infra-Red Telescope (UKIRT) is currently conducting the United Kingdom Infra-red Deep Sky Survey (UKIDSS) - the results of which are being made available in a series of releases. This work used the 8th Data Release (DR8Plus).
0 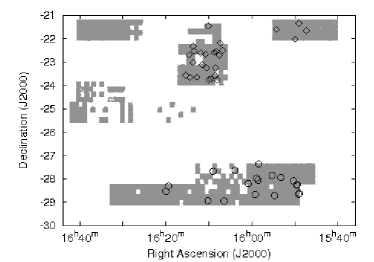
UKIDSS is made up of several components but the one of interest here is the Galactic Cluster Survey (GCS). Described in detail in Lawrence et al. (2007) the GCS is a survey of ten large open star clusters and star forming regions, including UpSco. One of the primary goals of the GCS is to conduct a census of very low mass brown dwarfs in order to investigate the form of the sub-stellar IMF.
The GCS takes infra-red images via five passband filters - Z, Y, J, H and K with effective wavelengths of m, m, m, m, and m respectively, and magnitude limits of Z=20.4, Y=20.3, J= 19.5, H=18.6 and K=18.6. The instrument used to take the images is the Wide Field Camera (WFCAM). Data collected by the WFCAM is subject to an automated process that detects and parameterises objects and performs photometric and astrometric calibrations. The resulting reduced image frames and catalogues are then placed in the WFCAM Science Archive (WSA). The WSA can be interrogated using Structured Query Language (SQL).
A set of five papers provide the reference technical documentation for UKIDSS. Casali et al. (2007) presents technical details of the WFCAM, Hodgkin et al. (2009) describes the WFCAM photometric system, Hambly et al. (2008) describes the WSA and offers instruction on how to extract information from it using SQL. As previously mentioned Lawrence et al. (2007) presents the details of the different UKIDSS surveys, including the GCS. The fifth paper (Irwin et al., in preparation) will describe the details of the data reduction pipeline which is run by the Cambridge University Astronomical Survey Unit (CASU), but sufficient information for an overview of the data reduction pipeline can be gleaned from the other four papers and by referring to Dye et al. (2006) and Warren et al. (2007)111For more details of the data reduction process see http://casu.ast.cam.ac.uk/surveys-projects/wfcam/technical..
As shown in figure 1, the area in UpSco investigated here and surveyed for DR8Plus covers 12 deg2. The data for objects in the target area were obtained via an SQL query (see Appendix A for a typical query) to the UKIDSS GCS database. All queries were structured to include only point source objects in order to avoid contamination by extended sources (e.g. relatively nearby galaxies). Objects in the WSA are given what is known as a discrete image classification, with point sources having values between -2 and -1. The lines in the query that refer to “passband”class, e.g. zclass, values of between -2 and -1, are designed to filter out extended sources. Note that requiring this value to be between -2 and -1 in every passband may exclude some sources with very low signal to noise ratios. As every object with photometric characteristics consistent with a brown dwarf had its proper motion assessed, in order to check whether it is likely a member of UpSco, each query submitted also correlated all objects found in the UKIRT GCS databases with those found in 2MASS databases (Skrutskie et al., 2006). The 2MASS data is used as a first epoch for the purposes of proper motion calculation.
3 Selection Of Brown Dwarf Candidate Members Of Upper Scorpius Association
3.1 Photometry
|
|
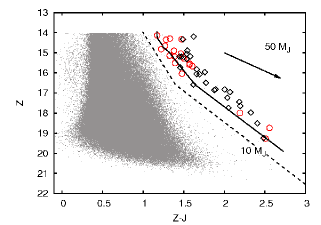
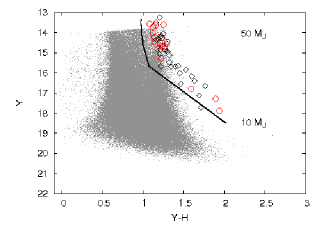
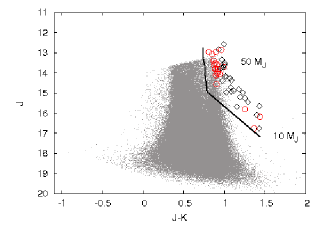
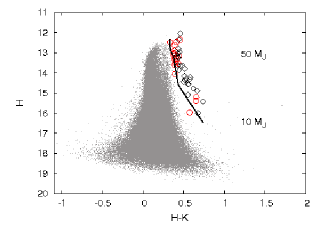
The query shown in Appendix A was submitted to the WSA. The query returned 282,938 objects and the colour magnitude diagrams shown in figure 2 were plotted. Known brown dwarfs from other studies (Martin et al., 2004; Slesnick et al., 2006; Lodieu et al., 2008, 2011) are shown as open diamonds and the 19 brown dwarf candidates found in this study are shown as open circles. Theoretical isochrones for 5 Myr old sub-stellar objects are also shown over-plotted on the diagrams. These isochrones are based on the DUSTY models derived by Chabrier et al. (2000) and obtained from both I. Baraffe (private communication) and N. Lodieu (private communication). The isochrones were computed by I. Baraffe using the UKIDSS filter profile. Reddening caused by extinction shifts the position of objects to the right and down on colour magnitude diagrams. Therefore all brown dwarf candidates should be either on or to the right hand side of the isochrones. The query limited selection to objects with magnitudes in Z greater than 14.0. This choice of a limiting magnitude was motivated in part by an examination of colour magnitude diagrams, including those in figure 2, which showed that at brighter magnitudes the isochrones for the young brown dwarf/very low mass star sequence of objects were no longer sufficiently distinct from other objects on the diagrams. Also, the DUSTY models of Chabrier et al. (2000) indicated that this choice would put an upper limit on the mass selected of 0.09, massive enough to make sure of including 5 Myr old brown dwarfs at 145pc distant. Note that WFCAM Z is on a Vega system, so it is not directly comparable with the SDSS z magnitudes on the AB system.
Evident from figure 2 is that some colour magnitude diagrams show a much clearer separation between brown dwarfs and main sequence stars than others. The (Z-J,Z) colour magnitude diagram shows the separation clearly and was chosen as the basis for the photometric cut. Thus to further refine the search, a new query was submitted to the WSA eliminating all objects to the left of the line from (Z-J,Z) = (1.0, 14.0) through (1.4, 16.6) to (3.0, 21.55) (dashed line in figure 2). This query left 51 objects which were examined again in the (Z-J,Z) colour magnitude diagram. 17 of the objects to the left of the line (Z-J,Z) = (1.1, 14.0) through (1.1, 14.3), (1.2, 14.9), (1.3, 15.2) to (1.6, 17.0) were rejected for being too far from the isochrone on the blue side, leaving 34 photometric candidates. Most of the candidates are slightly redder than predicted by the isochrones, which could be due to extinction or problems with the isochrones.
3.2 Proper Motion
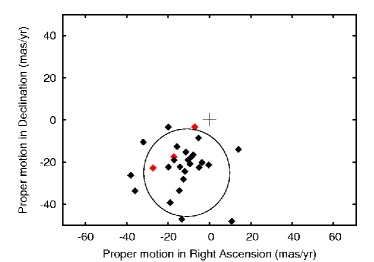
The 34 photometric candidates were then examined to find their proper motion. Proper motions were calculated using the query shown in appendix A. The difference in position of the objects in the GCS and 2MASS catalogues is obtained in milliarcseconds. This is then divided by the difference in the two epochs, converted from Julian dates to years. The lines in the query that list their results “as pmRA” and “as pmDEC” perform this task. The resulting vector point diagram is shown in figure 3. The known proper motions of UpSco in right ascension and declination are about -11mas/yr and -25mas/yr respectively (de Bruijne et al., 1997; Preibisch et al., 2002). Of the 34 candidates, 1 was too faint to be recorded in 2MASS leaving 33 candidates with proper motion data calculated. The remaining 33 candidates included 6 with proper motions greater than the range of figure 3 (Table 2). These 6 objects might be red or brown dwarfs located much closer to the Sun than UpSco. de Bruijne (1999) notes that the velocity dispersion in UpSco is very small at 1.3km/s, corresponding to about 2mas/yr.
The greatest contribution to the spread in the proper motions therefore comes from errors in UKIDSS and 2MASS measurements. To assess the errors the original selection of 282,938 objects had their proper motions examined. The proper motions were found to have a normal distribution about the origin with a standard deviation of 10.2mas/yr in both right ascension and declination. Factoring this error back into the de Bruijne (1999) figure noted above showed that a 2 selection circle for UpSco members would have a radius of 20.8mas/yr. This error has only a slight dependence on magnitude for objects with a magnitude in Z between 14.0 and 17.0. For the objects fainter than this the standard deviation is 20mas/yr. There are 3 objects among the final 27 candidates with magnitudes in Z greater than 17.0.
All 27 candidates shown in figure 3 are predominantly centred around the (-11,-25) position. The 3 candidates with magnitudes in Z greater than 17.0 noted above are marked in red. There is no clustering of objects around the (0,0) position indicating that the sample is not contaminated by more distant objects e.g. AGB stars which have similar surface temperatures and colours to brown dwarfs, but much greater intrinsic luminosities. The 19 candidates within the 2 selection circle were then classified as members of UpSco. These objects so selected (Table 1) have the photometric and proper motion characteristics of a 5 Myr old brown dwarf member of UpSco. Given that there are 19 objects within the 2 selection circle statistically it is to be expected that possibly 1 of the 8 objects outside is also a brown dwarf member of UpSco. However all of the other 8 objects shown in figure 3 are clustered immediately outside the 2 selection circle and not scattered around the vector point diagram as would be expected for random contaminants. As these 8 objects have the same range of magnitudes as the 19 within the selection circle (Table 1) they are not subject to any systemically larger proper motion errors caused by being fainter. Thus it is likely that these 8 objects are also members of UpSco with slightly higher dispersion velocity. Finally we note that none of the brown dwarf candidates listed here have been identified before in previous surveys.
Given the low contamination in our sample with proper motions, the one object which is not detected in 2MASS (Table 1) has a high likelihood of being a brown dwarf in UpSco as well (28/34, i.e. 82%).
3.3 Estimate of Contamination/Completeness
In order to be certain that the candidates found in this study are in fact brown dwarfs spectra should be obtained. However, figure 3 indicates that there is negligible contamination from background stars among the sample.
As a further test of the method outlined above, it was also used to investigate the 10.5 deg2 area covered by UKIDSS in the two areas shown to the north of figure 1. The area is also part of UpSco (de Zeeuw et al., 1999) and therefore any brown dwarf here will share similar photometric and proper motion characteristics of those from the area to the south. After the analysis of the 10.5 deg2 area was complete, 49 objects in it were identified as possible brown dwarfs. All 49 were previously identified by Lodieu et al. (2007, 2008) as brown dwarf candidates. Spectra have been taken of 26 of the 49 objects (Martin et al., 2004; Slesnick et al., 2006; Lodieu et al., 2008, 2011) and all 26 have been confirmed as brown dwarfs. This result underlines the reliability of the method as a means of discriminating brown dwarfs from other objects in UpSco.
In order to estimate completeness levels in all passbands the data from the original 282,938 objects was analysed. Objects were grouped in bins of 0.1 magnitude and examined to see where numbers detected in each bin began to fall. The resulting estimates of 100% completeness were: Z=18.0, Y=17.4, J=17.2, H=16.2, K=16.1. In the Z and J passbands these would be the expected magnitudes of UpSco member objects in the 0.01 - 0.02 mass range. The histograms in all five passbands showed that completeness fell gradually at these magnitudes and was still at an 80% level another magnitude deeper. Note that the lower mass range achieved in this survey is not limited by the completeness of UKIDSS but by that of 2MASS (J16) due to the need for proper motion measurements. However, of the 34 photometric candidates, only one object was fainter than the sensitivity limit of 2MASS and did not have its proper motion calculated.
| Name | R.A. | Dec. | Z Mag. | Y Mag. | J Mag. | H Mag. | K Mag. | ||
| mas/yr | mas/yr | ||||||||
| 2MASSJ15582376-2721435 | 15:58:23.76 | -27:21:43.7 | 14.35 | 13.72 | 13.07 | 12.60 | 12.22 | -17.20 | -19.05 |
| 2MASSJ16090168-2740521 | 16:09:01.68 | -27:40:52.3 | 14.33 | 13.60 | 12.86 | 12.35 | 11.89 | -8.75 | -17.46 |
| 2MASSJ16035573-2738248 | 16:03:55.73 | -27:38:25.1 | 15.19 | 14.48 | 13.80 | 13.28 | 12.88 | -12.64 | -28.09 |
| 2MASSJ15585793-2758083 | 15:58:57.93 | -27:58:08.5 | 15.13 | 14.45 | 13.81 | 13.31 | 12.93 | -9.46 | -20.79 |
| 2MASSJ15531698-2756369 | 15:53:16.98 | -27:56:37.2 | 15.53 | 14.68 | 13.96 | 13.45 | 13.04 | -14.61 | -33.48 |
| 2MASSJ15551960-2751207 | 15:55:19.59 | -27:51:21.0 | 15.59 | 14.77 | 14.02 | 13.51 | 13.11 | -19.02 | -39.21 |
| 2MASSJ15501958-2805237 | 15:50:19.58 | -28:05:23.9 | 16.04 | 15.27 | 14.56 | 14.05 | 13.66 | -5.02 | -22.51 |
| 2MASSJ15583403-2803243 | 15:58:34.03 | -28:03:24.5 | 15.21 | 14.46 | 13.72 | 13.17 | 12.73 | -3.61 | -20.20 |
| 2MASSJ16005265-2812087 | 16:00:52.66 | -28:12:09.0 | 15.03 | 14.27 | 13.57 | 13.04 | 12.66 | -0.38 | -21.28 |
| 2MASSJ15492909-2815384 | 15:49:29.08 | -28:15:38.6 | 14.29 | 13.62 | 12.96 | 12.47 | 12.06 | -14.25 | -22.20 |
| 2MASSJ15493660-2815141 | 15:49:36.59 | -28:15:14.3 | 14.66 | 14.02 | 13.39 | 12.91 | 12.52 | -11.87 | -24.36 |
| 2MASSJ16192399-2818374 | 16:19:23.99 | -28:18:37.5 | 15.29 | 14.52 | 13.78 | 13.31 | 12.90 | -5.33 | -8.51 |
| 2MASSJ15490803-2839550 | 15:49:08.02 | -28:39:55.2 | 14.82 | 14.23 | 13.60 | 13.09 | 12.72 | -19.86 | -22.31 |
| 2MASSJ15485777-2837332 | 15:48:57.76 | -28:37:33.4 | 17.99 | 16.79 | 15.80 | 15.20 | 14.55 | -17.24 | -17.39 |
| 2MASSJ16195827-2832276 | 16:19:58.26 | -28:32:27.8 | 18.74 | 17.29 | 16.18 | 15.39 | 14.74 | -27.34 | -22.75 |
| 2MASSJ15544486-2843078 | 15:54:44.85 | -28:43:07.9 | 15.51 | 14.79 | 14.12 | 13.61 | 13.22 | -15.80 | -12.59 |
| 2MASSJ15591513-2840411 | 15:59:15.12 | -28:40:41.3 | 14.13 | 13.56 | 12.96 | 12.49 | 12.15 | -11.40 | -15.19 |
| 2MASSJ16062870-2856580 | 16:06:28.70 | -28:56:58.2 | 14.90 | 14.21 | 13.52 | 13.01 | 12.63 | -7.91 | -16.46 |
| 2MASSJ16101316-2856308 | 16:10:13.15 | -28:56:31.0 | 15.67 | 14.81 | 14.06 | 13.54 | 13.11 | -10.36 | -18.99 |
| 2MASSJ16051544-2802520 | 16:05:15.44 | -28:02:52.0 | 17.92 | 16.66 | 15.69 | 15.05 | 14.47 | -7.11 | -3.30 |
| 2MASSJ15552513-2801085 | 15:55:25.11 | -28:01:08.8 | 14.12 | 13.51 | 12.88 | 12.47 | 12.01 | -38.10 | -26.24 |
| 2MASSJ15502934-2835535 | 15:50:29.32 | -28:35:53.9 | 16.05 | 15.32 | 14.59 | 14.03 | 13.63 | -36.07 | -33.63 |
| 2MASSJ16190983-2831390 | 16:19:09.82 | -28:31:39.5 | 16.63 | 15.67 | 14.70 | 14.17 | 13.67 | -13.41 | -47.04 |
| 2MASSJ16035601-2743335 | 16:03:56.00 | -27:43:33.6 | 14.41 | 13.91 | 13.26 | 12.64 | 12.29 | -19.94 | -3.33 |
| 2MASSJ16145936-2826214 | 16:14:59.37 | -28:26:21.8 | 14.68 | 14.12 | 13.50 | 12.83 | 12.48 | +10.75 | -48.05 |
| 2MASSJ15551768-2856579 | 15:55:17.70 | -28:56:58.1 | 14.32 | 13.80 | 13.19 | 12.66 | 12.33 | +14.02 | -13.91 |
| 2MASSJ15504920-2900030 | 15:50:49.19 | -29:00:03.1 | 14.35 | 13.82 | 13.21 | 12.64 | 12.34 | -32.06 | -10.49 |
| UGCSJ154723.32-272907.3 | 15:47:23.33 | -27:29:07.3 | 19.27 | 17.91 | 16.76 | 15.97 | 15.40 | —– | —– |
4 The substellar population in Upper Scorpius
We re-examined the 19 high probability members listed in Table 1 in the (Z-J,Z) colour magnitude diagram and assigned masses based on their Z band magnitude. They cover a mass range from 0.01 to 0.09, 7 are below 0.03 and 2 of those are below 0.02. The 100% completeness limit in the Z and J passbands corresponds to a mass of less than 0.02. At 0.01 the photometric survey is still at least 80% complete.
Andersen et al. (2008) performed a combined analysis of the low-mass IMF in seven star forming regions, not including UpSco. The method used a ratio of stars with masses 0.08 - 1.0 to brown dwarfs with masses 0.03 - 0.08 (30 - 80) from each region to allow for direct comparison.
In order to follow that method a new query was submitted to the WSA to extract UpSco member stars in the mass range 0.09 - 1.0. This new query returned 11,041 objects which were then examined in a (Z-J,Z) colour magnitude diagram. Unlike the brown dwarfs, the space the UpSco stars occupy in the colour magnitude diagram is not as distinct from the main sequence. The isochrones used to guide this selection of UpSco members were the DUSTY isochrone used previously and the NexGen isochrone also derived from the models of Chabrier et al. (2000). Initially, all objects to the left of a line from (0.75,10.32) to (1.17,14.15) were eliminated from consideration.
The remaining objects then had their proper motion examined in the vector point diagram as shown in figure 4. The UpSco cluster motion is clearly identifiable but is not as free from contamination as the brown dwarf selection was. To estimate contamination, the number of objects contained within selection circles of similar size centred on the points (11,25),(25,-11) and (-25,11) were counted (see figure 4). 22 objects were found in all three circles so the number of contaminants in the original selection circle was estimated at 7. This left a sample of 37 members of the UpSco within the mass range 0.09 - 1.0 extracted from an initial selection of 11,041 objects. Among the brown dwarfs in Table 1, 11 are judged to be in the range 0.03 - 0.08. Note that the brown dwarf numbers are extracted from the 19 objects within the 2 selection circle only. This is to ensure that both star and brown dwarf numbers in the ratios are arrived at using the same criteria. So the ratio of low-mass stars to brown dwarfs in the selected mass range was found to be 38/11 = 3.5 (errors are Poissonian).
The same analysis was then done for 10.5deg2 to the north where 49 brown dwarf candidates had been identified. 26 objects were assigned masses of between 0.03 - 0.08. Stars in the mass range 0.08 - 1.0 and deemed UpSco members because of their photometry and their proper motion, as shown in figure 4, numbered 102. So the ratio of stars to brown dwarfs in those areas was found to be 102/26 = 3.9, consistent with the south. Overall, the combined figures give a ratio of 140/37 = 3.8 (again, errors are Poissonian).
These numbers can be compared with the ratios published by Andersen et al. (2008, their Table 1). From their sample of 7 clusters, we exclude the Pleiades because it is significantly older than all other regions and Mon R2 which has a small population of members causing large statistical uncertainties. Only two of the remaining clusters belong to OB associations (ONC, NGC2024), and they feature the lowest star/brown dwarf ratios in the sample (3.3 and 3.8). These values are similar to the ones derived for the OB association UpSco (3.5 and 3.9, see above). In contrast the clusters without OB associations (Chamaeleon, Taurus, IC348) in the sample of Andersen et al. (2008) have higher star to brown dwarf ratios of 4.0, 6.0 and 8.3, respectively.
Thus, based on the current data it seems possible that the presence of OB stars is related to a low star to brown dwarf ratio, i.e. a higher abundancy of brown dwarfs. This could be a sign that the radiation field of OB stars favours the formation of brown dwarfs. It has been suggested that substellar and planetary-mass objects can be formed via photoerosion of cores by the ionizing radiation from an OB star (Whitworth & Zinnecker, 2004). At face value this would provide an additional formation channel for brown dwarfs in OB associations, lowering the star to brown dwarf ratio. Given the substantial uncertainties in these ratios, this conclusion is certainly preliminary and needs to be substantiated by future surveys.


|
| Name | R.A. | Dec. | Z Mag. | Y Mag. | J Mag. | H Mag. | K Mag. | ||
|---|---|---|---|---|---|---|---|---|---|
| mas/yr | mas/yr | ||||||||
| 2MASSJ15583064-2802357 | 15:58:30.63 | -28:02:36.3 | 16.53 | 15.75 | 14.99 | 14.47 | 14.03 | -28.27 | -66.30 |
| 2MASSJ16035915-2806086 | 16:03:58.76 | -28:06:09.6 | 16.78 | 15.82 | 15.02 | 14.46 | 14.00 | -2.19 | -115.84 |
| 2MASSJ15530915-2828366 | 15:53:09.13 | -28:28:37.3 | 14.81 | 14.18 | 13.51 | 13.00 | 12.63 | -46.20 | -75.62 |
| 2MASSJ15492508-2843527 | 15:49:24.85 | -28:43:51.6 | 14.15 | 13.49 | 12.84 | 12.39 | 12.02 | -384.23 | +138.80 |
| 2MASSJ16151681-2907007 | 16:15:16.28 | -29:07:01.3 | 14.10 | 13.40 | 12.86 | 12.23 | 11.96 | +15.06 | -60.37 |
| 2MASSJ15481934-2748512 | 15:48:19.30 | -27:48:51.3 | 19.77 | 17.56 | 16.73 | 16.15 | 15.83 | -74.00 | -8.34 |
5 Conclusions
We have carried out a survey for brown dwarfs in the 5 Myr old UpSco star forming region based on photometry and proper motions from a combination of the UKIDSS Galactic Cluster Survey and 2MASS. 19 new substellar objects with estimated masses between 0.01 and 0.09 are identified. These objects are located in the southern part of the association which has not been covered by previous brown dwarf surveys. 8 other objects with slightly higher proper motion have also been identified. These may be UpSco members with slightly higher dispersion velocity than the stellar members. Although spectroscopic confirmation has not been obtained yet, the level of contamination appears negligible.
The ratio of stars to brown dwarfs in the South of UpSco was found to be 3.5, in the same range as elsewhere in UpSco. Comparing with literature findings, young clusters with OB associations tend to have lower ratios than clusters without OB stars, which might indicate that brown dwarf formation is a function of environment.
Acknowledgements
The authors would like to thank Nicolas Lodieu of the Instituto de Astrofisica de Canarias and Isabelle Baraffe of the Centre de Recherche Astrophysique de Lyon for supplying model data. This work was supported by the Science Foundation Ireland within the Research Frontiers Programme under grant no. 10/RFP/AST2780. This publication makes use of data products from the Two Micron All Sky Survey, which is a joint project of the University of Massachusetts and the Infrared Processing and Analysis Center/California Institute of Technology, funded by the National Aeronautics and Space Administration and the National Science Foundation. We would also like to thank the UKIDSS Team for the excellent database they have made available to the community.
References
- Andersen et al. (2008) Andersen M., Meyer M. R., Greissl J., Aversa A., 2008, ApJ, 683, L183.
- Ardila et al. (2000) Ardila D., Martín E., Basri G., 2000, AJ, 120, 479.
- Barrado y Navascues et al. (2002) Barrado y Navascues D., Bouvier J., Stauffer J.R., Lodieu N., McCaughrean M.J., 2002, A& A, 395, 813B.
- Bejar et al. (2001) Bejar V.J.S., Martin E.L., Zapatero Osorio M.R., Rebolo R., Barrado y Navascues D., Bailer-Jones C.A.L., Mundt R., Baraffe I., Chabrier G., Allard F., 2001, ApJ, 556, 830.
- Bonnell et al. (2007) Bonnell I.A., Larson R.B., Zinnecker H., 2007, in Protostars and Planets V, ed. B. Reipurth, D. Jewitt, K. Keil (Tucson: Univ. Arizona Press), 149.
- Casali et al. (2007) Casali M., Adamson A., Alves de Oliveira C., Almaini O., Burch K., Chuter T., Elliot J., Folger M., Foucaud S., Hambly N., Hastie M., Henry D., Hirst P., Irwin M., Ives D., Lawrence A., Laidlaw K., Lee D., Lewis J., Lunney D., McLay S., Montgomery D., Pickup A., Read M., Rees N., Robson I., Sekiguchi K., Vick A., Warren S., Woodward B., 2007, A& A, 467, 777.
- Chabrier et al. (2000) Chabrier G., Baraffe I., Allard F., Hauschildt P., 2000, ApJ, 542, 464.
- de Bruijne et al. (1997) de Bruijne J.H.J., Hoogerwerf R., Brown A.G.A., Aguilar L.A., de Zeeuw P.T., 1997, in ESA SP-402: Hipparcos - Venice ’97 Improved Methods for Identifying Moving Groups. pp 575-578
- de Bruijne (1999) de Bruijne J.H.J., 1999, MNRAS, 310, 585.
- de Zeeuw et al. (1999) de Zeeuw P.T., Hoogerwerf R., de Bruijne J.H.J., Brown A.G.A., Blaauw A., 1999, AJ, 117, 354.
- Dye et al. (2006) Dye S., Warren S.J., Hambly N.C., Cross N.J.G., Hodgkin S.T., Irwin M.J., Lawrence A., Adamson A.J., Almaini O., Edge A.C., Hirst P., Jameson R.F., Lucas P.W., van Breukelen C., Bryant J., Casali M., Collins R.S., Dalton G.B., Davies J.I., Davis C.J., Emerson J.P., Evans D.W., Foucaud S., Gonzales-Solares E.A., Hewett P.C., Kendall T.R., Kerr T.H., Leggett S.K., Lodieu N., Loveday J., Lewis J.R., Mann R.G., McMahon R.G., Mortlock D.J., Nakajima Y., Pinfield D.J., Rawlings M.G., Read M.A., Riello M., Sekiguchi K., Smith A.J., Sutorius E.T.W., Varricatt W., Walton N.A., Weatherley S.J., 2006, MNRAS, 372, 1227.
- Hambly et al. (2008) Hambly N.C., Collins R.S., Cross N.J.G., Mann R.G., Read M.A., Sutorius E.T.W., Bond I., Bryant J., Emerson J.P., Lawrence A., Rimoldini L., Stewart J.M., Williams P.M., Adamson A., Hirst P., Dye S., Warren S.J., 2008, MNRAS, 384, 637.
- Hennebelle & Chabrier (2008) Hennebelle P., Chabrier G., 2008, ApJ, 684, 395.
- Hodgkin et al. (2009) Hodgkin S.T., Irwin M.J., Hewett P.C., Warren S.J., 2009, MNRAS, 394, 675.
- Irwin et al. (in preparation) Irwin M.J. et al., in preparation.
- Kroupa (2001) Kroupa. P., 2001, MNRAS, 322, 231.
- Kroupa (2002) Kroupa. P., 2002, Science, 295, 82.
- Lawrence et al. (2007) Lawrence A., Warren S.J., Almaini O., Edge A.C., Hambly N.C., Jameson R.F., Lucas P., Casali M., Adamson A., Dye S., Emerson J.P., Foucaud S., Hewett P., Hirst P., Hodgkin S.T., Irwin M.J., Lodieu N., McMahon R.G., Simpson C., Smail I., Mortlock D., Folger M., 2007, MNRAS, 379, 1599.
- Lodieu et al. (2007) Lodieu N., Hambly N.C., Jameson R.F., Hodgkin S.T., Carraro G., Kendall T.R., 2007, MNRAS, 374, 372.
- Lodieu et al. (2008) Lodieu N., Hambly N.C., Jameson R.F., Hodgkin S.T., 2008, MNRAS, 383, 1385.
- Lodieu et al. (2011) Lodieu N., Dobbie P.D., Hambly N.C., 2011, A&A, 527A, 24L.
- Lucas & Roche (2000) Lucas P. W., Roche P. F., 2000, MNRAS, 314, 858L.
- Luhman et al. (2007) Luhman K. L., Joergens V., Lada C., Muzerolle J., Pascucci I., White R., 2007, in Protostars and Planets V, ed. B. Reipurth, D. Jewitt, K. Keil (Tucson: Univ. Arizona Press), 443.
- Martin et al. (2004) Martin E.L., Delfosse X., Guieu S., 2004, AJ, 127, 449.
- Oliveira et al. (2008) Oliveira J.M., Jeffries R.D., van Loon J. Th., 2009, MNRAS, 392, 10340.
- Oppenheimer et al. (1999) Oppenheimer B.R., Kulkarni S.R., Stauffer J. R., 1999, in Mannings V., Boss A., Russell S., eds, Protostars and Planets IV, Tucson: Univ. Arizona Press.
- Preibisch et al. (2002) Preibisch T., Guenther E., Zinnecker H., Sterzik M., Frink S., Roser S., 1998, A&A, 333, 619.
- Preibisch et al. (2002) Preibisch T., Brown A.G.A., Bridges T., Guenther E., Zinnecker H., 2002, AJ, 124, 404.
- Preibisch & Mamajek (2008) Preibisch T., Mamajek E., 2008, in Handbook of Star Forming Regions, Vol, II, ed B. Reipurth (San Francisco, CA: ASP), 235.
- Scholz et al. (2009) Scholz A., Geers V., Jayawardhana R., Fissel L., Lee E., Lafreniere D., Tamura M., 2009, ApJ, 702, 805S.
- Skrutskie et al. (2006) Skrutskie M.F., Cutri R.M., Stiening R., Weinberg M.D., Schneider S., Carpenter J.M., Beichman C., Capps R., Chester T., Elias J., Huchra J., Liebert J., Lonsdale C., Monet D.G., Price S., Seitzer P., Jarrett T., Kirkpatrick J.D., Gizis J., Howard E., Evans T., Fowler J., Fullmer L., Hurt R., Light R., Kopan E.L., Marsh K.A., McCallon H.L., Tam R., Van Dyck S., Wheelock S., 2006, AJ, 131, 1163.
- Slesnick et al. (2006) Slesnick C.L., Carpenter J.M., Hillenbrand L.A., 2006, AJ, 131, 3016.
- Tej et al. (2002) Tej A., Sahu K.C., Chandrasekhar T., Ashok N.M., 2002, ApJ, 578, 523.
- Thies & Kroupa (2008) Thies I., Kroupa P., 2008, MNRAS, 390, 1200.
- Warren et al. (2007) Warren S.J., Hambly N.C., Dye S., Almaini O., Cross N.J.G., Edge A.C., Foucaud S., Hewett P.C., Hodgkin S.T., Irwin M.J., Jameson R.F., Lawrence A., Lucas P.W., Adamson A.J., Bandyopadhyay R.M., Bryant J., Collins R.S., Davis C.J., Dunlop J.S., Emerson J.P., Evans D.W., Gonzales-Solares E.A., Hirst P., Jarvis M.J., Kendall T.R., Kerr T.H., Leggett S.K., Lewis J.R., Mann R.G., McLure R.J., McMahon R.G., Mortlock D.J., Rawlings M.G., Read M.A., Riello M., Simpson C., Smith D.J.B., Sutorius E.T.W., Targett T.A., Varicatt W.P., 2007, MNRAS, 375, 213.
- Weidner & Kroupa (2006) Weidner C., Kroupa P., 2006, MNRAS, 365, 1333.
- Whitworth & Zinnecker (2004) Whitworth A., Zinnecker H., 2004, A&A, 427, 299.
- Whitworth et al. (2007) Whitworth A., Bate M.R., Nordlund A., Reipurth B., Zinnecker H., 2007, in Protostars and Planets V, ed. B. Reipurth, D. Jewitt, K. Keil (Tucson: Univ. Arizona Press), 459.
- Zaptero Osorio et al. (2000) Zapatero Osorio M. R., Bejar V.J.S., Martin E.L., Rebolo R., Barrado y Navascues D., Bailer-Jones, C.A.L., Mundt R., 2000, Science, 290, 103.
Appendix A Sample SQL Query
Shown below is the SQL query submitted to the WSA to find the first set of sources in the Upper Scorpius association. The query returned 282,938 rows of data.
Select
g.ra, g.dec, zmypnt, ymjpnt, jmhpnt, hmk_1pnt, zapermag3, yapermag3, japermag3, hapermag3, k_1apermag3, 3.6e6*cos(radians(g.dec))*
(g.ra-T2.ra)/((mj.mjdobs - T2.jdate+2400000.5)/365.25) as
pmRA, 3.6e6*(g.dec-T2.dec)/
((mj.mjdobs - T2.jdate+2400000.5)/365.25) as pmDEC
From
gcsmergelog as I, multiframe as mj, (Select t.ra as ra, t.dec as dec, x.slaveobjid as slaveobjid, x.masterobjid as masterobjid, t.j_m, t.h_m, t.k_m, t.jdate From gcssourcextwomass_psc as x, twomass..twomass_psc as t Where x.slaveobjid=t.pts_key And distancemins
In (Select Min(distancemins) From gcssourcextwomass_psc Where
masterobjid=x.masterobjid)) As T2 Right Outer Join gcssource
As g On (g.sourceid=T2.masterobjid)
Where
(g.ra Between 235.0 And 245.0)
And (g.dec Between -30.0 And -27.0)
And zapermag3 > 14.0 And yapermag3 > 11.5 And japermag3 > 12.0 And hapermag3 > 10.0 And k_1apermag3 > 9.5
And zxi Between -1.0 And +1.0 And yxi Between -1.0 And +1.0 And jxi Between -1.0 And +1.0 And hxi Between -1.0 And +1.0 And k_1xi Between -1.0 And +1.0
And zeta Between -1.0 And +1.0 And yeta Between -1.0 And +1.0 And jeta Between -1.0 And +1.0 And heta Between -1.0 And +1.0 And k_1eta Between -1.0 And +1.0
And zclass Between -2 And -1 And yclass Between -2 And -1 And jclass Between -2 And -1 And hclass Between -2 And -1 And k_1class Between -2 And -1
And (priorsec = 0 Or priorsec = g.framesetid)
And g.framesetid=I.framesetid
And I.jmfid=mj.multiframeid