On The Gas Temperature of Molecular Cloud Cores
Abstract
We investigate the uncertainties affecting the temperature profiles of dense cores of interstellar clouds. In regions shielded from external ultraviolet radiation, the problem is reduced to the balance between cosmic ray heating, line cooling, and the coupling between gas and dust. We show that variations in the gas phase abundances, the grain size distribution, and the velocity field can each change the predicted core temperatures by one or two degrees. We emphasize the role of non-local radiative transfer effects that often are not taken into account, for example, when modelling the core chemistry. These include the radiative coupling between regions of different temperature and the enhanced line cooling near the cloud surface. The uncertainty of the temperature profiles does not necessarily translate to a significant error in the column density derived from observations. However, depletion processes are very temperature sensitive and a two degree difference can mean that a given molecule no longer traces the physical conditions in the core centre.
1 Introduction
The gas kinetic temperature is a central parameter for the stability of the clouds, their evolution, and their chemistry (e.g. Galli et al., 2002; Keto & Field, 2005). The properties of pre-stellar cores are of particular interest because they have a direct impact on the ensuing star formation. The understanding of the temperature variations within the cores is thus crucial for the interpretation of observations and for the development of the theory of star formation (Bergin & Tafalla, 2007).
The early models of the cloud cores were spherically symmetric and isothermal, in the case of both stable and collapsing cores (e.g. Bonnor, 1956; Shu, 1977). The spherical symmetry will eventually break down because of rotational flattening or core fragmentation but, in early evolutionary stages, it is often a reasonable first approximation (e.g. Evans et al., 2005; Alves et al., 2001). The observations of the detailed temperatures structure can be more difficult because the measured intensities are non-linear averages of the emission originating in different regions along the line-of-sight. The dust colour temperature is known to be a biased estimate of the true grain temperature (Shetty et al., 2009; Malinen et al., 2011). The situation is potentially even worse for where, because of abundance variations, the observations may represent conditions in a small fraction of the source. This is particularly true for cold pre-stellar cores where many molecules are severely depleted (e.g. Bergin & Langer, 1997; Belloche & André, 2004; Whittet, 2010; Ford & Shirley, 2011; Parise et al., 2011). There are measurements suggesting that, in the centre of a starless core, the kinetic temperature can decrease down to 6 K (Crapsi et al., 2007; Harju et al., 2008). However, our knowledge of the radial temperature variations depends heavily on models that also form the basis for the interpretation of molecular line data.
The principles of the thermal balance of dense clouds are well understood, the main factors being the heating by cosmic rays, the cooling by line emission, and the energy exchange between gas and dust (Goldsmith & Langer, 1978; Goldsmith, 2001). Despite the apparent simplicity of the problem, reliable predictions of are not easy to obtain because of the uncertainty of the fractional abundances and dust grain sizes, and the potentially complex radiative transfer effects. The problem of line cooling has been examined separately, with the Large Velocity Gradient (LVG) approximation (Neufeld, Lepp & Melnick, 1995) and with Monte Carlo methods (Juvela et al., 2001), the latter also enabling the study of the role of an inhomogeneous medium.
In this paper, we investigate the uncertainties of the modelled profiles of dense cloud cores. The cores are known or are suspected to have significant radial variations in the gas phase abundances, grain size distributions, and the velocity field. We wish estimate the maximum effects on that could arise from these systematic changes. This is important for the evaluation of the uncertainties of chemical model and, more directly, the interpretation of any line observations of dense cores.
2 The Modelling
We examine the thermal balance of spherical clouds without small scale inhomogeneity. All models are divided to one hundred concentric shells, the innermost shell being 6% and the outermost shell 0.6% of the outer radius. The same discretization is used for in continuum and line radiative transfer calculations and for the determination of the temperature profiles. To separate the radiative transfer effects from those of the density, we start by examining homogeneous clouds. The dust temperatures are determined with Monte Carlo radiative transfer calculations (Juvela, 2005), using the dust model of Draine (2003) and the interstellar radiation field (ISRF) given by Black (1994). The rate for the energy exchange between gas and dust is calculated from
| (1) |
and the rate for cosmic ray heating from
| (2) |
(Goldsmith, 2001). Following Goldsmith (2001), we calculate the line cooling by 12CO, 13CO, C18O, C, CS, and o-H2O, multiplying the last two rates by 10 and two, respectively, to take into account the cooling by other species. The radiative transfer problem is solved with Monte Carlo methods (Juvela et al., 2001), with abundances given in Table 1 in Goldsmith (2001). As part of the Monte Carlo simulation, the program saves the net radiative cooling rates for each model cell.
As a more realistic cloud model we examine a one solar mass, marginally stable Bonnor-Ebert sphere with a value of the stability parameter (Bonnor, 1956). The radial density profile is calculated assuming a constant temperature of 10 K. The variations of kinetic temperature modify the density profile only slightly (Evans et al., 2001) and this will not affect the conclusions drawn from the models. An external UV field can affect the cloud temperatures but, in principle, only in a thin surface layer. We consider this heating through the photoelectric effect in connection with some Bonnor-Ebert models. To estimate the photoelectric heating rate , we first calculate the energy that dust absorbs in the energy range 6–13.6 eV. The values are obtained from the continuum radiative transfer calculations. Following Juvela et al. (2003), is obtained by multiplying these energies with an constant efficiency of . The dust temperatures are calculated assuming the clouds are heated by the normal ISRF, even when UV heating of gas is ignored. Photoelectric heating is almost completely eliminated if the cloud is surrounded by a dust layer of (see Sect. 3.2.1). This would reduce the central dust temperature only by 0.5 degrees, less than the uncertainty associated with the selection of a dust model.
Below we modify several model parameters to determine how their variations are reflected on the gas temperature. These include (1) the thermal coupling between gas and dust, , that depends on the grain size distribution, (2) the abundances of the cooling species that depend on the degree of depletion, (3) the cosmic ray heating that depends on the rate of cosmic rays, and finally (4) the large scale infall motion and (5) the small scale velocity field that both affect the radiative cooling . The degree of modification for each parameter is indicated in Table 1 and discussed further in the following section.
3 Results
3.1 Homogeneous models
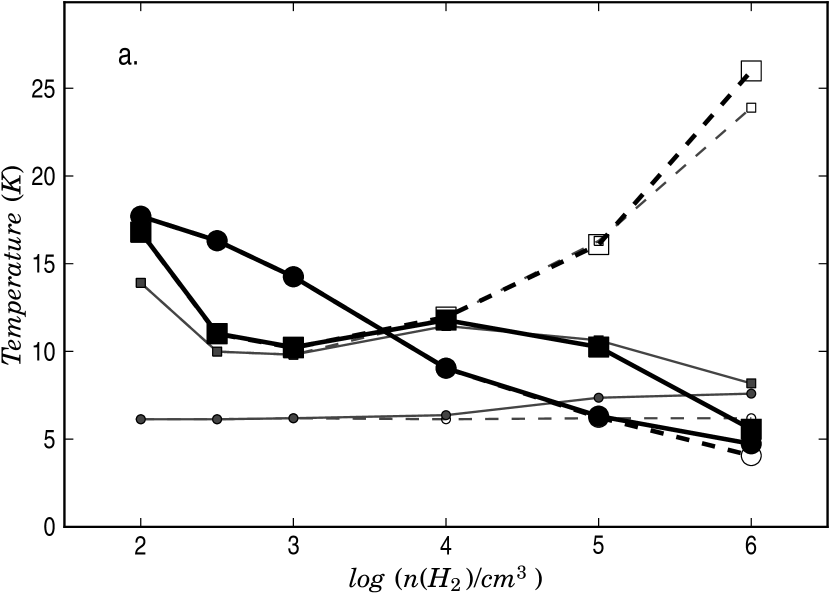
As a first test, before modifying any parameters listed in Table 1, we compared our calculations with those of Goldsmith (2001) who estimated the line cooling with LVG modelling assuming a velocity gradient of 1 km s-1 pc-1. The cloud is taken to be well shielded from the external UV field so that the heating through the photoelectric effect can be neglected. Corresponding to the idea of the LVG models, we calculated at the centre of homogeneous, microturbulent spheres with a radius of pc and the line Doppler width equal to 1 km s-1. The correspondence was found to be good, mostly within 10% in (see Fig. 1a), in spite several basic differences in the respective models. Firstly, Goldsmith (2001) calculated the dust temperature for a constant shielding that, in the absence of gas-dust coupling resulted in a temperature of 6 K. In our calculations the dust temperature was solved self-consistently. The model was assumed to be illuminated by the full ISRF, and the radiation field inside the cloud was solved with radiative transfer calculations (Juvela, 2005). The difference in dust temperature has no effect on at low . At cm-3 is close to the value used by Goldsmith (2001) and the values are in very good agreement. Secondly, in our model the excitation temperature varies as a function of radius so that the LVG assumption of a uniform medium is not valid. This affects the radiative connection between different parts of the model, is reflected in the excitation, and can thus affect the cooling rates. Thirdly, the photon escape probabilities in the LVG model and our Monte Carlo model are not identical even when the total optical depths are equal. In our calculations, even at high optical depths, some photons can always escape in the line wings. These effects do not appear important for the estimated central temperature of the cores. There are also some differences. For example, in our calculations the gas-dust coupling has a smaller effect on at high densities, apparently because our dust cooling rate is higher than that given by Goldsmith (2001) Eq. 13.
We used the homogeneous models to investigate the effect of the grain size distribution. The gas–dust coupling becomes significant around cm-3 depending, however, on the total grain area. Equation. 1 is valid for a size distribution with in the range 0.01–1.0 m. If the lower limit is reduced to 10Å (e.g. Li & Draine, 2001), without modifying the gas-to-dust ratio, increases by a factor of 3. On the other hand, at the centre of dense cores the size of the large grains increases through grain coagulation while small grains may disappear entirely (e.g. Stepnik et al., 2003; Ormel et al., 2009; Steinacker et al., 2010). If the lower limit of grain sizes increases to 500Å, the rate is reduced by 60%. If the upper limit is further increased to 2 m, the effect is a factor of three. The value of is similarly increased (decreased) by a factor of three if the powerlaw exponent of the size distribution is decreased (increased) by , without modifying the size limits.
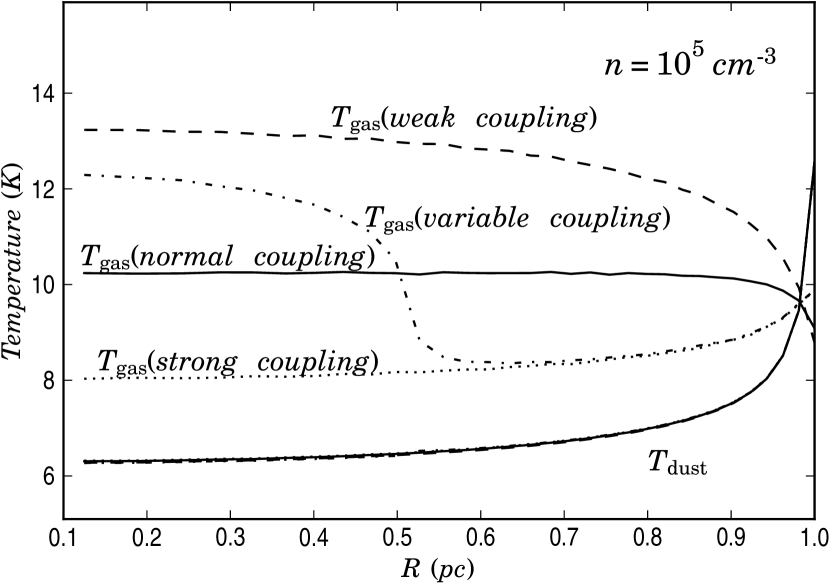
Figure 2 illustrates the consequences for the gas temperature. The solid lines show the radial profiles of and for the model cm-3 of Fig. 1. The increased photon escape probability always decreases at the cloud surface in spite of the increasing (Eq. 1). The other curves correspond to a three times stronger and a three times weaker gas-dust coupling. The dash-dotted line is schematically the expected behaviour where, for given density, the coupling becomes weaker in the central part because of the grain growth. This is not to be taken so much as a model of an actual core as an illustration of the uncertainty of .
3.2 Bonnor-Ebert spheres
As more realistic models of dense cores, we examine critically stable 0.5 and 1.0 solar mass Bonnor-Ebert spheres. We will first investigate different factors that could affect their radial temperature profiles and then have a look at the predicted line profiles.
3.2.1 Temperature profiles
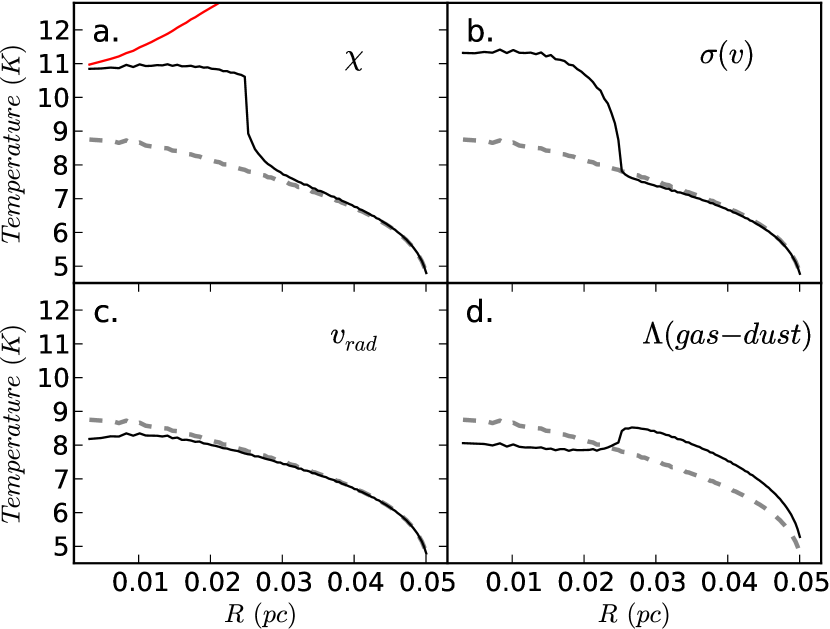
We investigate first the one solar mass Bonnor-Ebert sphere. The basic model has a constant turbulent line width of km s-1 and no large scale gas motions. The central density rises above cm-3 but, because of the smaller cloud size, the column densities are lower than in the Sect. 3.1 models of similar density. The photon escape probability increases outwards and the model predicts a significant decrease of towards the cloud surface. This is in contrast with the Galli et al. (2002) calculations that employed a parameterization of LVG results to estimate (see their Fig. 3; note also the difference in due to a different dust model). The actual surface temperature will be sensitive to the abundance profiles and will depend on the amount of UV and cooling line radiation entering the cloud from the outside, both effects ignored in the present model.
Figure 3 shows the quantitative effects resulting from possible variations of the abundances, the velocity field, and . The question of depletion was already examined by Goldsmith (2001). To illustrate the effect in the context of our model, we decrease the abundance of all cooling species by a factor of ten in the cloud centre, within a radius of 0.025 pc (Fig. 3a). Because many lines are already optically thick, is not expected to decrease linearly with the abundances. In the model, increases by 2 degrees in the inner part, with only a small effect reflected in the outer cloud.
In quiescent cores the line widths are sometimes observed to be close to that determined by thermal broadening (e.g. Harju et al., 2008). When the turbulent line width is reduced to km s-1 within innermost 0.025 pc, the central temperature again increases by about two degrees (Fig. 3b). The observed linewidths will remain much broader because of the thermal and opacity broadening and because of the emission from the outer cloud layers where the turbulent line width is still km s-1.
Although the Bonnor-Ebert model is static, we can introduce a large scale velocity field to check its importance on the escape of line emission. We add an infall velocity that is zero at the cloud surface and increases linearly to 1 km s-1 in the centre. This is a very simplistic model of the velocity field but the magnitude of the velocity gradient is realistic (e.g. Zhou et al., 1993) and the model should capture the main effect on the radiative transfer. In the very central part of the model, the gas temperature by reduced little less than one degree (Fig. 3c). Both the large scale and small scale velocity fields affect through the line optical depths.
The density of the one solar mass model ranges from 1.4 to 2 cm-3, a region of densities where the coupling between gas and dust becomes important. As discussed in Sect. 3.1, changes in the grain size distribution are reflected on the efficiency of so that it could be decreased by up to a factor of three in the cloud centre and enhanced by up to a factor of three at the surface. It may be very improbable that a single source would exhibit the full range of variation. However, Fig. 3d shows this case where the efficiency of jumps from one extreme to the other again at 0.025 pc radius. Because the dust temperature is above the gas temperature, the weaker coupling reduces in the centre of the cloud. The effect is again of the order of one degree.
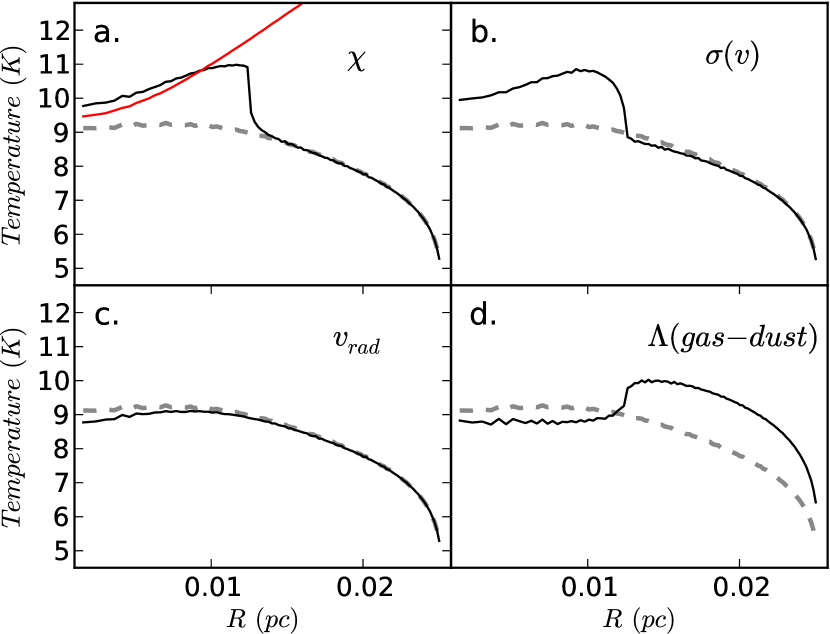
Figure 4 shows the corresponding results for a half solar mass cloud where the central density is four times the value of the previous model. The main differences result from the enhanced gas-dust coupling that, together with lower dust temperature, reduces the central gas temperature by K in the cases of low abundances and low velocity dispersion. On the other hand, the outer cloud is warmer by a similar amount, both because of the stronger but also because of the general density dependence already seen in Fig. 1.
An external UV field can directly impact the cloud temperature at least at its surface. We examined another set of one solar mass Bonnor-Ebert spheres where the photoelectric heating was included and calculated as described in Sect. 2. The ISRF impinging on the cloud is attenuated by =0, 1, or 2m, corresponding to a shielding dust layer that is thought to exist around the actual model cloud. This applies to the calculation of both and . The resulting temperature profiles inside the model are shown in Fig. 5. The effect of photoelectric heating becomes negligible once the cloud is shielded by . However, in an unshielded cloud the UV field has a small effect, 0.4 K, even in the cloud centre. This is caused not by a direct photoelectric heating but by the change of the excitation in the outer cloud layers (cf. Sect. 4, Fig. 1b). Again, the actual effect will depend critically on the molecular abundances in the region heated by .
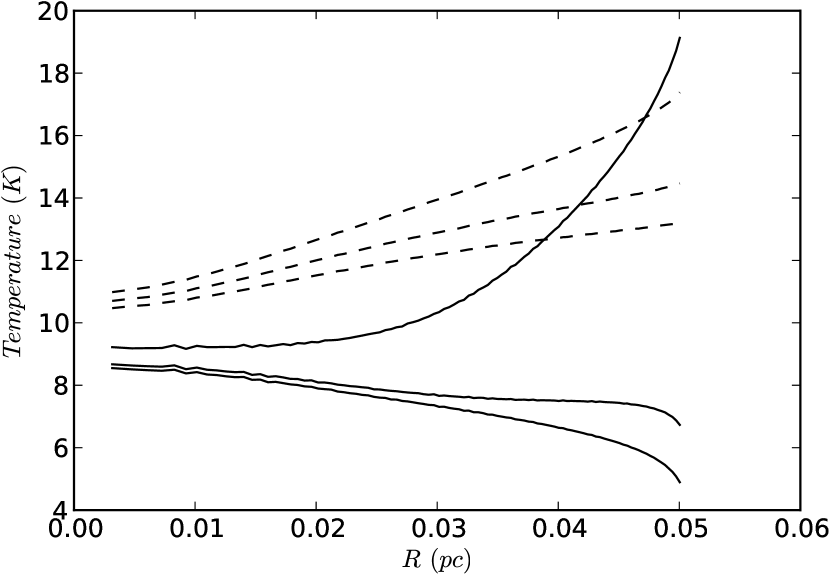
As a final source of uncertainty we consider the rate of cosmic rays. The heating term is based on the assumption of a rate s-1 but, in diffuse clouds, there are reports of rates that are up to two orders of magnitude higher (e.g. McCall et al., 2003; Liszt, 2003; Shaw et al., 2006). To reflect this uncertainty we calculated temperature profiles with scaled by factors 1, 2, 5, and 10. Figure 6 shows the resulting temperature profiles, again for the one solar mass model. With the highest rate, s-1, the central temperature has risen from the original 7.5 K to 17 K. For comparison, we show temperatures calculated with the parameterization given by Goldsmith (2001). The calculation is done shell by shell using the local density and the local dust temperature ( and are as in our calculations). These rates correspond to a model that has much higher column density (per velocity interval and for given density) than the Bonnor-Ebert spheres. Therefore, also the derived values are higher. Furthermore, the parameterization does not catch the increased photon escape probability at the cloud surface that, in our Monte Carlo calculations, results in the decrease of temperature in the outer part.
3.2.2 Spectral lines
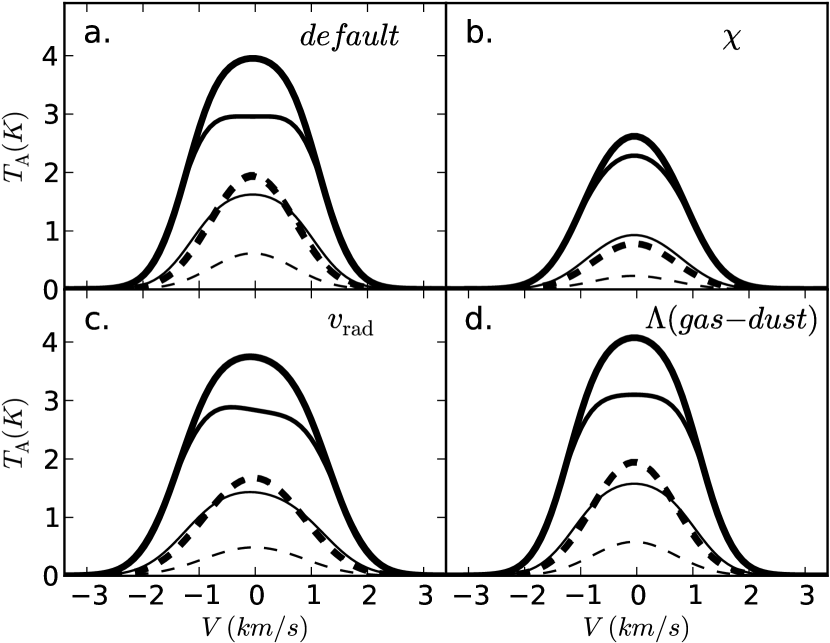
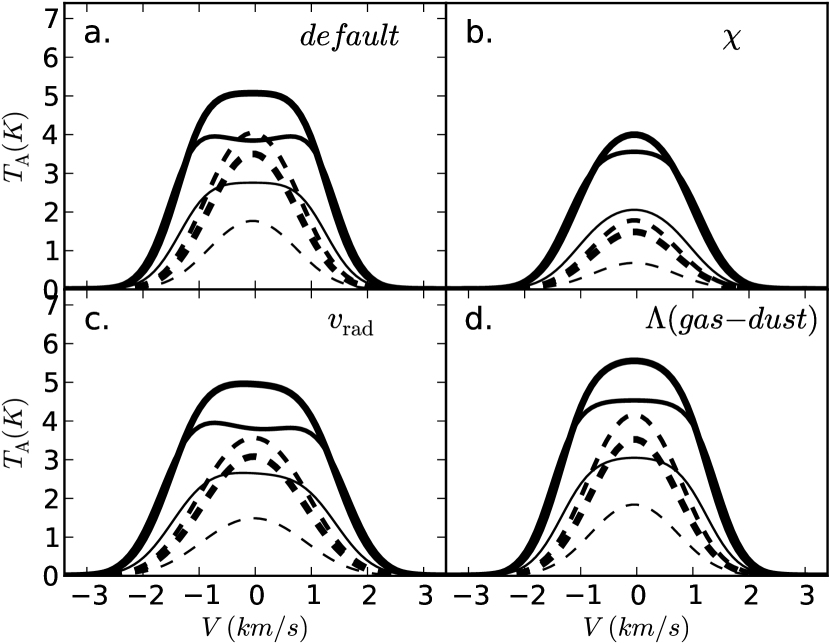
Figures 7 and 8 show 13CO and C18O line profiles that were calculated for the models of Figs. 3 and 4. The 1–0, 2–1, and 3–2 spectra were calculated as observed towards the centre of the cloud with a beam with the FWHM equal to the half of the cloud radius. At 100 pc distance, this corresponds to 52″and 26″for the 1.0 and the 0.5 models, respectively.
In the one solar mass model, the 13CO(1–0) beam averaged optical depth is only 2.5 through the cloud. In the 0.5 the corresponding optical depth is 7.5 meaning that there the 13CO transitions and C18O lines originate partially in different regions with different kinetic temperatures. One example of this are the line profiles of the 0.5 cloud with the infall velocity. The 13CO(2-1) line shows the expected infall profile while in the optically thinner 1-0 line (=3.9 vs =6.5 for the second transition) the effect is weaker. The beam averaged C18O(1–0) lines remain symmetric. When observed with a pencil beam, the C18O =1–0 and =2–1 lines would show slight asymmetry but with line profiles with stronger emission on the red shifted side. This is caused by the which decreases towards the cloud centre (see Fig. 4c).
We carried out LTE analysis of the 13CO and C18O lines to check how accurate those column density estimates would be. We used the method described by Myers et al. (1983). The ratio of the 13CO and C18O lines is used to calculate the optical depth , and the excitation temperature of C18O, , is solved from the radiative transfer equation (see Myers et al., 1983, Eqs. 3-4). Assuming Gaussian line shapes, the column density of C18O in the state is
| (3) |
where and K. The total C18O column density is obtained by summing all levels, assuming they are populated according to . Table 2 summarizes the results when the line parameters are taken from Gaussian fits to the modelled spectral profiles. The errors of these estimates are less than 5% which shows that the temperature gradients have little impact on the column density estimates.
4 The importance of non-local radiative couplings
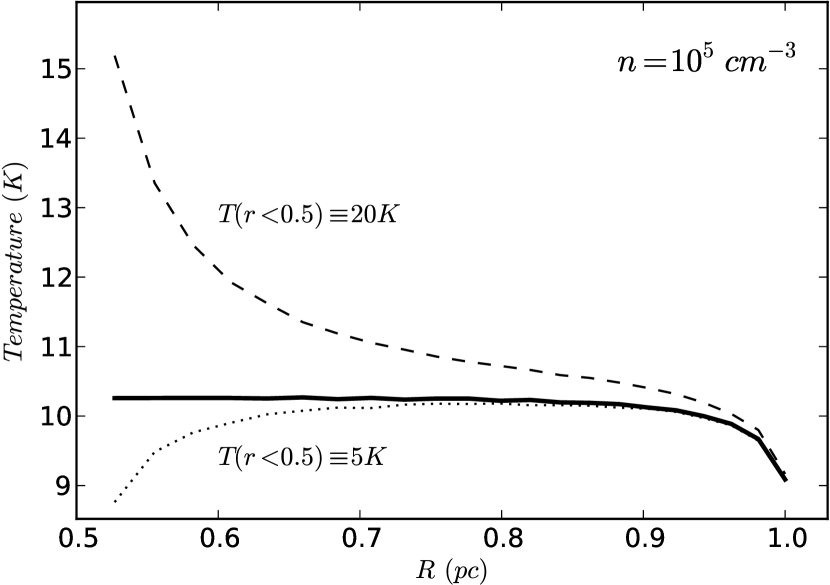
The LVG method is based on the assumption that the excitation is constant within the radiatively coupled volume. This is not a good approximation in dense cores where the gas velocities are small and the radial gradients of are large. To illustrate the potential problem further in a schematic way, we took from Fig. 1 the cm-3 model and forced the inner part, pc, to local thermodynamic equilibrium (LTE) at 5 K or 20 K. Fig. 9 shows the resulting values in the outer part of the cloud, pc. The assumed excitation of the inner cloud has a strong impact on the remaining cloud volume. The same effect was seen in Sect. 3.2, where the increased surface temperature caused by photoelectric heating was reflected all the way to the centre of the optically thick cloud.
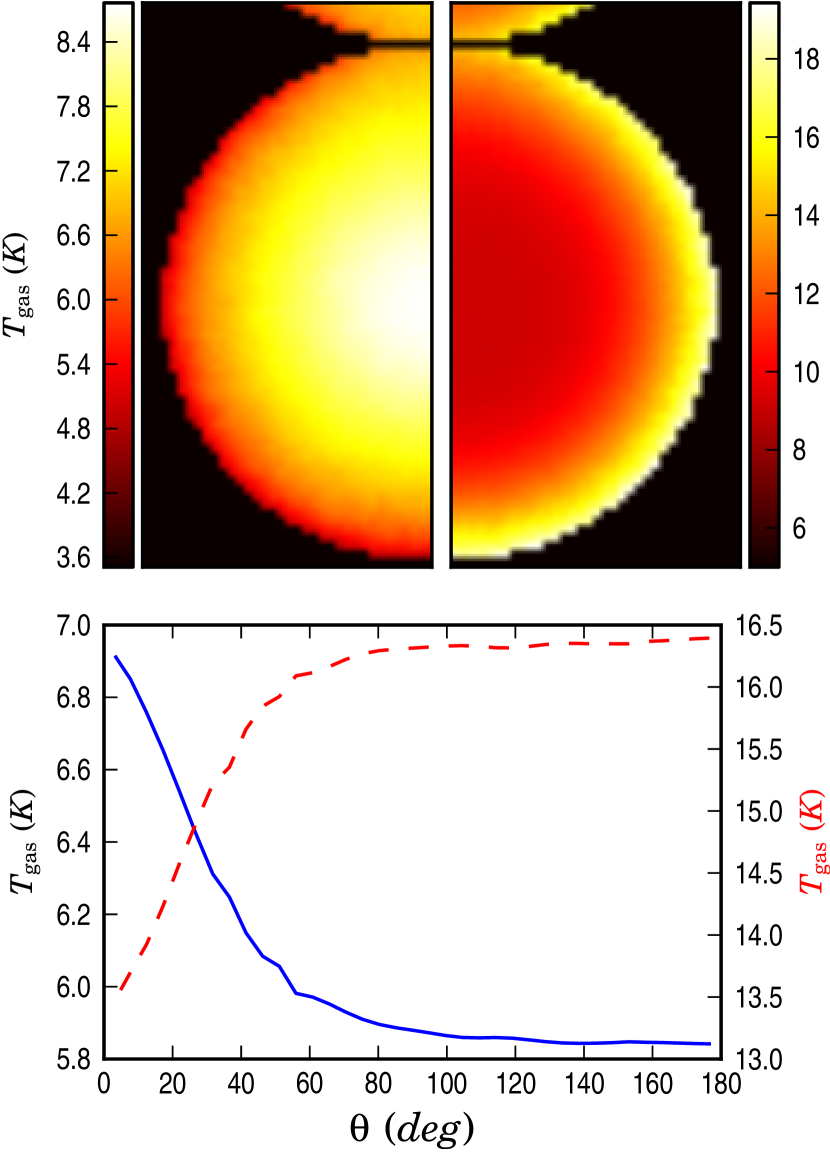
Our final example of a system with non-trivial radiative couplings consists of two Bonnor-Ebert spheres with properties identical to those in Sect. 3.2. The spheres are touching each other and the mutual shielding and exchange of radiative energy modifies the temperature distributions. Figure 10 shows the estimated without and with photoelectric heating. The calculations were carried out with the same continuum and line radiative transfer programs as in the case of spherical models but discretizing the cloud onto a 1283 cartesian grid. When photoelectric heating is not considered, the absorption of line radiation from the other core increases the temperatures between the cores. The effect on is degree at the surface between the two cores. When UV heating is included, the mutual shielding becomes important and is reduced by up to 3 K between the cores. Compared to the gravitational attraction between the spheres, the force exerted by the resulting pressure asymmetry is of the order of one percent (assuming the change of K affects a few percent of the surface area). However, if the spheres were to partially coalesce, the affected area and the temperature asymmetry would both increase making the effect potentially even dynamically important.
5 Discussion
We have modelled the gas and dust temperature of dense clouds. The results emphasize the difference between the distributions obtained with consistent radiative transfer calculation and those resulting from the blind application of LVG model results. If LVG calculations are used, also the increased photon escape probability near cloud surface must be taken into account. The effect can be several degrees and this will have consequences for chemical models and the interpretation of observations. The photoelectric heating is capable of raising the surface temperature significantly but only if the cloud is shielded by less than of extinction. However, the indirect impact of this heating is felt well beyond the region directly penetrated by UV photons. The details of the radial temperature profile will depend on the abundances of the outer cloud layers and the external radiation field, both in terms of line radiation and the UV flux. Further studies coupling the chemistry and the modelling of the thermal balance are clearly needed.
We examined the effects on resulting from such spatial variation of molecular abundances, velocity field, and dust grain size distribution that are expected in dense cores. Each factor alone can change by 1 K or more. In the core, a strong depletion of molecules and the reduction of turbulent motions is capable of rising the temperature by several degrees. As pointed out by Goldsmith (2001), the effect of depletion will become less important at higher densities when dominates over line cooling. The same applies to any effect resulting from the velocity field. However, the increase of grain sizes will significantly decrease the coupling between gas and dust. When and the density is close to cm-3, this can compensate some of the temperature increase predicted for the inner core. There is no observational evidence of a temperature increase at the centre of quiescent cores but also this possibility should be considered when interpreting observations. In more opaque clouds (especially in conjunction with dust coagulation) will be reduced below and, at high enough densities, will eventually force gas temperature down at the centre of starless cores. An increase in the grain sizes can shift this transition to densities higher than usually assumed. However, because of the long time scale of dust coagulation (e.g. Ormel et al., 2009), the effect is often likely to be smaller than in our model.
The value of is particularly uncertain at the cloud surface where the photoelectric heating and the dissociation of CO produce strong temperature gradients. However, for the dense clouds the largest source of uncertainty still appears to be the rate of cosmic ray heating. In the case of the one solar mass Bonnor-Ebert sphere, a factor of five increase in would raise the central temperature by five degrees to 12.5 K. This may already be excluded by direct observational evidence of much lower gas temperatures in dense clouds (Crapsi et al., 2007; Harju et al., 2008). Nevertheless, the theoretical prediction of the temperatures – and temperature profiles – of dense cores still contains significant uncertainty.
The observed temperature gradients will not strongly modify the radial density distribution of cores nor significantly affect the core stability (e.g. Harju et al., 2008; Galli et al., 2002). However, in the critically stable Bonnor-Ebert models of one solar mass, the difference between isothermal temperatures of 8 K and 10 K corresponds to a factor of two increase in the central density. This shows that even small temperature changes are important in theoretical studies. In Figs. 3 and 4 we examined separately the effect of various parameters on . In more dense cores, with , the effects of the , , and parameters could accumulate, making the temperature gradients more pronounced. If gas is not coupled to dust, could in the central parts remain several degrees above the temperature of the outer cloud. However, in the centre of the 0.5 model cloud the gas temperature was already largely determined by the gas-dust coupling. In that case the question of the dust properties becomes important because different dust models can, in the cloud centre, lead to values differing by more than one degree (e.g. our vs. the (Galli et al., 2002) models). The case of the two Bonnor-Ebert spheres in Sect. 4 suggests that even small temperature anisotropies may sometimes play a role in the long term evolution of clouds. Further studies are also required to find out how the early evolution of spherical cores is modified relative to the isothermal case.
However, the main importance of small variations may come via chemistry. The gas temperature directly affects chemical reaction rates and, in particular, the depletion onto dust grains. Therefore, the precise value of the gas temperature is relevant for interpretation of both line and continuum data. Because the collision rates are only proportional to , the direct effect on the time scales of depletion and grain mantle accumulation is small, less than 50% for the kind of temperature variations observed in our models. However, the effect on steady state abundances is more noticeable. Aikawa et al. (2005) studied chemical evolution in collapsing clouds with initial conditions close to critical Bonnor-Ebert spheres. If the evolution was slow enough, significant depletion was observed in the central parts of the model clouds. In particular, Aikawa et al. (2005) included a comparison of identical models (central density cm-3) with kinetic temperatures of 10 K, 12 K, and 15 K. The ice composition was found to be very sensitive to the temperature and this was reflected in the gas phase abundances. A difference of two degrees could modify some abundances by a factor of two and, in the centre where the depletion becomes significant, by an order of magnitude or even more (e.g. NH3 and N2H+, see Aikawa et al., 2005, Figs. 2 and 6). It is conceivable that in some cases the depletion will be regulated by the temperature rise that results from the decreasing line cooling.
When observations are analyzed, there is no guarantee that different lines (e.g., different isotopomers or different transitions of the same molecule) would originate in identical gas volume. We already noted that, depending on the opacity of the lines, the spatial resolution, and the radial profile, it is possible to observe both blueshifted and redshifted spectra towards a collapsing cloud. In the same fashion, the kinetic temperature measured, e.g. with NH3, may not be representative for other lines. This could lead to errors that are propagated to the derived column densities. The evaluation of these uncertainties requires simultaneous modelling of the thermal balance, radiative transfer and, in particular, of the chemistry. Such a full study is beyond the scope of the present paper. However, we did carry out LTE analysis of the 13CO and C18O lines calculated for the Bonnor-Ebert models. The temperature gradients did not affect the column density estimates by more than 5% and, at least in this case, the LTE analysis would produce accurate estimates for the total 13CO and C18O column density. Thus, the temperature variations examined in this paper mainly affect our expectations of the radial abundance profiles. These are important considerations when line data are used to estimate the central density or temperature of a dense core. The direct implications on the stability or dynamic evolution of the cores are probably of secondary importance.
References
- Aikawa et al. (2005) Aikawa, Y., Herbst, E., Roberts, H., Caselli, P. 2005, ApJ620, 330
- Akyilmaz et al. (2007) Akyilmaz, M., Flower, D.R., Hily-Blant, P., Pineau des Forêts, G., Walmsley, C.M. 2007, A&A462, 221
- Belloche & André (2004) Belloche, A., André, P. 2004, A&A419, 35
- Bergin & Langer (1997) Bergin, E.A., Langer, W.D. 1997, ApJ486, 316
- Black (1994) Black, J.H. 1994, in The First Symposium on the Infrared CASP Conf. Ser., 58, 355
- Burke & Hollenbach (1983) Burke, J.R., & Hollenbach, D.J. 1983, ApJ265, 223
- Alves et al. (2001) Alves, J.F., Lada, C.J., Lada, E.A. 2001, Nature 409, 159
- Bergin & Tafalla (2007) Bergin, E.A., & Tafalla, M. 2007, ARA&A45, 339
- Bonnor (1956) Bonnor, W.B. 1956, MNRAS 116, 351
- Crapsi et al. (2007) Crapsi, A., Caselli, P., Walmsley, M.C., Tafalla, M. 2007, A&A470, 221
- Draine (2003) Draine, B., 2003, ApJ598, 1017
- Evans et al. (2001) Evans, N.J. II, Rawlings, J.M.C., Shirley, Y.L., Mundy, L.G. 2005, ApJ557, 193
- Evans et al. (2005) Evans, N.J. II, Lee, J., Rawlings, J.M.C., Choi, M. 2005, ApJ626, 919
- Ford & Shirley (2011) Ford, A.N., & Shirley, Y.L. 2011, ApJ728, 144
- Galli et al. (2002) Galli, D., Walmsley, M., Goncalves, J. 2002, A&A394, 275
- Goldsmith & Langer (1978) Goldsmith, P.F., Langer, W.D. 1978, ApJ222, 881
- Goldsmith (2001) Goldsmith, P.F. 2001, ApJ557, 736
- Harju et al. (2008) Harju, J., Juvela, M., Schlemmer, S., Haikala, L.K., Lehtinen, K., Mattila, K. 2008, A&A482, 535
- Juvela et al. (2001) Juvela, M., Padoan, P., Nordlund, Å. 2001 ApJ563, 853
- Juvela et al. (2003) Juvela, M., Padoan, P., Jimenez, R. 2003, ApJ591, 258
- Juvela (2005) Juvela, M. 2005, A&A, 440, 531
- Keto & Field (2005) Keto, E., & Field, G. 2005, ApJ635, 1151
- Li & Draine (2001) Li, A., & Draine, B.T. 2001, ApJ554, 778
- Liszt (2003) Liszt, H. 2003, A&A398, 621
- Malinen et al. (2011) Malinen, J., Juvela, M., Collins, D.C., Lunttila, T., Padoan, P. 2011, A&A, in press, arXiv 1009:4580
- McCall et al. (2003) McCall, B.J., Huneycutt, A.J., Saykally, R.J., et al. 2003, Nature 422, 500
- Myers et al. (1983) Myers, P.C., Linke, R.A., Benson, P.J. 1983, ApJ264, 517
- Neufeld, Lepp & Melnick (1995) Neufeld, D.A., Lepp, S., Melnick, G.J. 1995, ApJS100, 132
- Neufeld & Kaufman (1993) Neufeld, D.A., & Kaufman, M.J. 1993, ApJ418, 263
- Ormel et al. (2009) Ormel, C.W., Paszun, D., Dominik, C., Tielens, A.G.G.M. 2009, A&A502, 845
- Parise et al. (2011) Parise, B., Belloch, A., Du, F., Gusten, R., Menten, K.M. 2011, A&A526, 31
- Shaw et al. (2006) Shaw, G., Ferland, G. J., Srianand, R., & Abel, N. P. 2006, ApJ639, 941
- Shetty et al. (2009) Shetty, R., Kauffmann, J., Schnee, S., Goodman, A., Ercolano, B. 2009, ApJ696, 2234
- Shu (1977) Shu, F.H. 1977, ApJ214, 488
- Stepnik et al. (2003) Stepnik, B., Abergel, A., Bernard, J.-P., et al. 2003, A&A398, 551
- Steinacker et al. (2010) Steinacker, J., Pagani, L., Bacmann, A., Guieu, S. 2010, A&A511, A9
- Whittet (2010) Whittet, D.C.B., Goldsmith, P.F., & Pineda, J.L. 2010, ApJ720, 259
- Zhou et al. (1993) Zhou, S., Evans, N.E. II, Kömpe, C., Walmsley, C.M. 1993, ApJ404, 232

| Model version | 1.0 model | 0.5 model | ||
|---|---|---|---|---|
| (C18O) | (C18O)LTE | (C18O) | (C18O)LTE | |
| (cm-2) | (cm-2) | (cm-2) | (cm-2) | |
| Default | 1.79 | 1.88 | 3.57 | 3.75 |
| Modified | 6.72 | 6.97 | 1.34 | 1.38 |
| Modified | 1.79 | 1.88 | 3.57 | 3.74 |
| Modified | 1.79 | 1.89 | 3.57 | 3.74 |