Nonequilibrium Quasiparticle Relaxation Dynamics in Single Crystals of Hole and Electron doped BaFe2As2
Abstract
We report on the nonequilibrium quasiparticle dynamics in BaFe2As2 on both the hole doped () and electron doped () sides of the phase diagram using ultrafast pump-probe spectroscopy. Below , measurements conducted at low photoinjected quasiparticle densities in the optimally and overdoped samples reveal two distinct relaxation processes: a fast component whose decay rate increases linearly with excitation density and a slow component with an excitation density independent decay rate. We argue that these two processes reflect the recombination of quasiparticles in the two hole bands through intraband and interband processes. We also find that the thermal recombination rate of quasiparticles increases quadratically with temperature in these samples. The temperature and excitation density dependence of the decays indicates fully gapped hole bands and nodal or very anisotropic electron bands. At higher excitation densities and lower hole dopings, the dependence of the dynamics on quasiparticle density disappears as the data are more readily understood in terms of a model which accounts for the quasiequilibrium temperature attained by the sample. In the samples, dependence of the recombination rate on quasiparticle density at low dopings (i.e., ) is suppressed upon submergence of the inner hole band and quasiparticle relaxation occurs in a slow, density independent manner.
pacs:
74.25.Gz, 78.47.+pI Introduction
The discovery of the iron-pnictide superconductorsKamihara et al. (2008); Rotter et al. (2008) has opened a new chapter in the study of high-temperature superconductivity. Although they display a lower degree of electronic correlation than the cupratesQazilbash et al. (2009), there are a number of similarities between the two material classes. Perhaps the most striking of these is the close correspondence between their phase diagrams. In both classes, superconductivity is achieved by the doping of either electrons or holes into a “parent” material which displays magnetic ordering at lower temperatures, i.e., spin density wave (SDW) ordering in the pnictidesde la Cruz et al. (2008); Huang et al. (2008) or antiferromagnetic ordering in the cuprates. As this static magnetic ordering is suppressed with doping, superconductivity emerges, increasing in transition temperature to a maximum at optimal doping before receding with the addition of further carriers.
With these shared characteristics come shared mysteries, including the natures of the pseudogap state, of the coexistence between magnetic and superconducting order (i.e., homogeneous vs. heterogeneous), and, arguably the most fundamental, the binding boson itself. The presence of a resonance in neutron scattering spectra below in the pnictidesChristianson et al. (2008); Lumsden et al. (2009) and the suppression of magnetic ordering upon the addition of carriers suggests that antiferromagnetic spin fluctuations mediate pairing, implying that the superconducting order parameter switches sign in the Brillouin zone. Therefore, definitive determination of the gap structure and symmetry would serve as a significant step towards understanding the mechanism of superconductivity. In the cuprates, experiments clearly show -wave pairingTsuei and Kirtley (2000). The picture in the pnictides is a lot murkier, in part due to their multiband character and the fact that interband interactions likely play a role in superconductivityMazin et al. (2008); Wang et al. (2009); Chubukov et al. (2008). This complexity may be at the origin of the seemingly conflicting sets of experimental evidence concerning the symmetry of . Angle Resolved Photoemission (ARPES) studies have consistently revealed a fully gapped Fermi surfaceDing et al. (2008a, b); Wray et al. (2008), while NMRFukazawa et al. (2009) and magnetic penetration depthMartin et al. (2009) measurements suggest the presence of nodes. Confronted with these data, theorists have proposed a diverse collection of order parameters, including an symmetry with nodesGraser et al. (2009), symmetry Yanagi et al. (2008), and the prevailing nodeless order parameterMazin et al. (2008) with interband impurity scatteringChubukov et al. (2008).
In this study, we use optical pump-probe spectroscopy to investigate the gap symmetry and interband interactions in the Ba-122 system of the iron pnictides. Pump-probe spectroscopy is a powerful technique in which absorption of an ultrashort “pump” pulse results in the injection of a transient population density of nonequilibrium quasiparticlesParker and Williams (1972). A second “probe” pulse then records the return of the system to equilibrium through measurement of the time-resolved change in reflectivity (), assumed linearly proportional to . These measurements have been successfully employed in the cuprates to examine, e.g., gap symmetryGedik et al. (2004, 2005a) and the strength of electron-boson coupling Demsar et al. (2003); Gadermaier et al. (2010). In the pnictides, pump-probe spectroscopy has probed the existence of a pseudogap stateMertelj et al. (2009), the competition between SDW and SC orderingChia et al. (2010), coherent lattice vibrations to rule out their role in superconductivityMansart et al. (2009), and the role of interband interactions and gap symmetry in nonequilibrium quasiparticle relaxationTorchinsky et al. (2010). As prior ultrafast experiments have focused on one side of the phase diagram at a time, there is a need for a systematic study of the pnictides as a function of doping across the phase diagram.
Building upon our prior workTorchinsky et al. (2010), we study both the hole-doped Ba1-xKxFe2As2 and the electron-doped BaFe2-yCoyAs2 series of the 122 pnictides. In the optimal to overdoped hole doped samples (), the signal () is composed of two distinct features. The first is a fast component whose decay rate depends on excitation fluence which, aided by ARPESDing et al. (2008a); Richard et al. (2009); Wray et al. (2008) measurements and LDA calculationsMa et al. (2008), we argue arises from the inner hole bands. The second is a slow, fluence independent decay we attribute to the outer hole band. An analysis of the fast component based on the Rothwarf-TaylorRothwarf and Taylor (1967); Gedik et al. (2004) coupled differential equations reveals a dependence of the thermal population of quasiparticles on temperature, suggesting the presence of nodes on the Fermi Surface. At the same time, the number of photoinduced quasiparticles that contribute to the overall signal increases linearly with laser fluence, reflecting the fully gapped character of these bands. We thus argue that these observations are consistent with fully gapped hole pockets at zone center and nodal or highly anisotropic electron pockets at the zone boundary.
In the normal state, we observe oscillations in the reflectivity transients due to coherent acoustic phonons. These thermally driven acoustic waves are suppressed below due to a significant decrease in the thermal expansion coefficient below the transitionBud’ko et al. (2009); Hardy et al. (2009); da Luz et al. (2009) – except at the highest fluences, suggesting a dichotomy between the low and high fluence regimes.
These arguments provide a framework for understanding the rest of the available phase diagram. At lower hole doping levels (i.e., , ) and higher excitation fluences, the data represent the normal-state behavior seen at higher dopings. In the low fluence regime, however, these samples do not exhibit the density-dependent recombination seen for the optimally and overdoped samples, precluding an analysis to determine Fermi surface topology. Rather, these data are qualitatively explained by a simple model that accounts for the spatially integrated nature of the pump-probe measurement.
In the Co-doped samples, low-fluence measurements below in an underdoped () sample indicate quasiparticle recombination that is weakly dependent on incident fluence. This intensity dependent recombination disappears as further electron doping submerges the innermost hole pocket below the Fermi level; for large values of Co-doping, the only observed relaxation is the slow decay we previously assigned to the outer hole band.
II Experimental Setup
We employed a Ti:sapphire oscillator system which produces 60 fs pulses at central wavelength 795 nm (photon energy 1.5 eV) at an 80 MHz repetition rate. After passing through a prism compressor designed to account for the dispersion of the setup, the repetition rate of the laser was reduced to 1.6 MHz with an electro-optic pulse-picker in order to eliminate the effects of cumulative heating of the sample. The beam was then split into two paths with a 9:1 ratio between the pump and probe. The horizontally polarized pump beam was chopped at 102 kHz by a photoelastic modulator/polarizer pair for lock-in detection and then passed through neutral density filters in order to tune the incident pump fluence from to . After attenuation, the pump beam was passed through a fast scanning delay stage which swept the pump delay by 40 ps at a rate of 30 Hz before being focused to a FWHM spot-size on the sample.
After being split from the pump, the probe beam passed through a computer-controlled motorized delay stage and was rotated to vertical polarization before being focused to a FWHM spot-size on the sample in the same location as the pump. The reflected probe beam was separated from the pump by spatial and polarization filtering, then focused onto a photodiode. The photodiode output was low-pass filtered and measured by a lockin amplifier synched with the photoelastic modulator. We used a fast time constant () so that the lockin output could be input to an oscilloscope triggered to the fast scanning stage. We averaged several fast-scan stage sweeps to record each data trace.
All samples were grown using the self-flux method in proportions given by their chemical formula. A variety of sample characterization methods were employed with the most rigorous testing reserved for the optimally hole-doped () sample as follows: the induction-coupled plasma (ICP) technique was used to determine the Ba/K ratio, the uncertainty of which was determined to be less than 2%Chen et al. (2008). Energy-dispersive X-ray (EDX) spectroscopy was used to determine spatial variation in sample doping homogeneity. A plot of the resulting EDX analysis pattern may be found in Figure 1b of Ref. Chen et al., 2008. In a recent EDX analysis on a different batch of samples, the maximum spatial variation was found to range from to . Resistivity and magnetic susceptibility measurements have been independently performed and presentedWray et al. (2008); the sharpness of the transition was used as a gauge of sample purity. These results are shown in Figs. 1a and 1b of Ref. Wray et al., 2008.
A number of other studies on samples from the same batch of optimally-hole doped compounds have been performed, including ARPESWray et al. (2008); Ding et al. (2008a); Richard et al. (2009), Infrared spectroscopyLi et al. (2008), and thermal conductivityCheckelsky et al. (2008); further information regarding sample purity and homogeneity may be found therein. We performed SQUID magnetometry on all the samples used in this study and measured K at each sample’s transition temperature.
III Results and Discussion
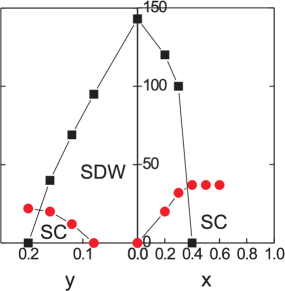
A schematic representation of the Ba-122 phase diagram is presented in Fig. 1. The data points indicate the and values for the samples used in this study. Specifically, we examined hole-doped Ba1-xKxFe2As2 with in increments of 0.1, spanning the regime from underdoping to overdoping. On the electron-doped side of the phase diagram, we studied BaFe2-yCoyAs2 samples at doping levels of in increments of 0.04, which spans underdoped to optimally doped samples. The parent compound was also measured.
We start by describing our measurements in Ba1-xKxFe2As2 in the optimally () to overdoped () regime at the low excitation densities. Shifting our attention to the high fluence regime provides a framework for measurements in the underdoped samples, which we follow with a discussion of measurements in the parent compound and BaFe2-xCoxAs2 at all dopings.
III.1 Ba1-xKxFe2As2: The Low Fluence Regime
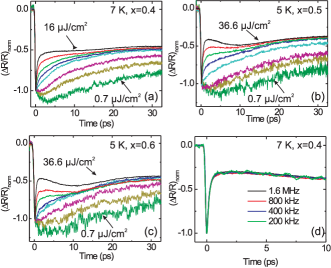
Characteristic short-time traces of the normalized change in reflectivity as a function of time at various fluences are shown in Fig. 2a for the sample at =7 K. There is an initial decrease of the reflectivity at the arrival of the pump beam at time . Recovery to equilibrium depends strongly on the incident fluence with higher fluences exhibiting a faster initial relaxation rate than lower ones. Qualitatively identical intensity dependence is observed in the samples, as shown in Figs. 2b and 2c. In all cases, higher fluences are marked by faster initial relaxation of the signal than for lower fluences. We note the presence of the beginning of a heavily damped oscillation in the highest fluences of this Figure (not shown for the sample, although it is was observed) due to Stimulated Brillouin Scattering (SBS) which disappears with decreasing fluence. This characteristic of the data will be described in further detail below within the context of the high-fluence regime measurements.
In order to rule out steady state heating as the source of this intensity dependence, we used a pulse picker to vary the repetition rate. Figure 2d shows 7 K transients taken with an absorbed pump fluence J/cm2 at repetition rates ranging from 200 kHz to 1.6 MHz. We observe no discernible change in the recovery dynamics. Measurements performed above exhibited an absence of the intensity dependence of Figs. 2a-c, verifying its origin in superconductivityTorchinsky et al. (2010).
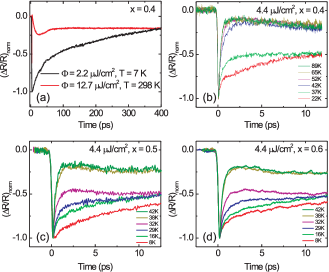
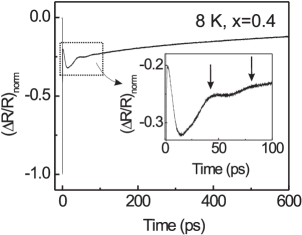
The reflectivity transients of Figs. 2a-c tend to an offset at the end of the 30 ps measurement time window. This offset is the beginning of a slow, intensity-independent decay with a characteristic decay time of 500 psTorchinsky et al. (2010), represented for the sample at 7 K by the black trace in Fig. 3a. As with the fast, intensity dependent component, the slowly decreasing offset is observed to abruptly shut off for all samples at their respective transition temperatures, leading to a much longer decay of lower magnitude, as seen in the red trace of Fig. 3a. This switching off of the long-time component was also a universal characteristic of the samples, which is demonstrated by Figs. 3b-d.
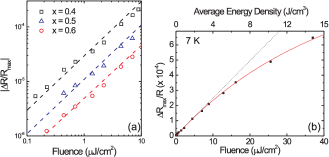
Further insight into the data is obtained by considering the initial amplitude of the reflectivity transients. Fig. 4a presents as a function of the absorbed pump fluence in the low-fluence regime at K in the samples. Lines of slope 1 are shown with the data, indicating that at these fluences, is directly proportional to . This linear proportionality signifies that these experiments represent the low-fluence regime. Significantly, a linear dependence of on is an indication that the photoinduced excitations are fully gapped; the number of excitations is simply proportional to the laser energy absorbed Gedik et al. (2004). In the presence of a line node in the gap of the probed excitations, a linear dependence of the density of states on energy produces an estimate for the total energy absorbed by the quasiparticles as . In such a case, the total number of excited quasiparticles is given as . Thus, the number of quasiparticles in terms of the energy deposited is given as . Thus, a line node in the vicinity of the photoexcited quasiparticles should yield a sublinear dependence of the initial reflectivity transients , which is not observed.
With increasing , displays saturation behavior at high excitation densities, as seen for the sample 7 K data in Fig. 4b. We fit these data to a simple saturation model which accounts for the exponential penetration of the light into the sample, given by
| (1) |
where is the laser fluence at a depth of beneath the sample surface, is the change in reflectivity at saturation and is the optical penetration depth (26 nm in optimally doped Li et al. (2008)). The fit yields a saturation fluence of and = . Below, we restrict our analysis to which is clearly in the linear range of Fig. 4b for all three dopings.
In the low-excitation regime, the dynamics of the photoinduced quasiparticles may be understood within the framework of the Rothwarf-Taylor model. This phenomenological model was originally developed to describe nonequilibrium quasiparticle recombination in tunneling experimentsRothwarf and Taylor (1967). Here, the coupled recovery of a nonequilibrium concentration of quasiparticles and their binding boson may be described by the rate equations
| (2) | |||||
| (3) |
where, and are the external quasiparticle and boson generation rates, respectively, is the pair creation rate via annihilation of gap energy bosons, is the equilibrium boson number density, is the boson escape rate, and is the bi-molecular recombination constant. The rates , and describe the three different relaxation pathways for the energy deposited into the system by the ultrashort pulse.
Depending on the relative magnitudes of these three rates, the solutions of these equations display different characteristics. In the simplest case, if or then the pair creation term in the first equation can be ignored and the two equations decouple. In this limit, quasiparticles display simple bimolecular kinetics governed by the recombination coefficient , as is observed, e.g., in Figs. 2a-c. In the limit where , quasiparticles and bosons come to a quasiequilibrium and the combined population decays with a slow rate proportional to . This regime, known as the phonon bottleneck, is consistent with the slow component of the signal, shown in Fig. 3a.
In the decoupled regime, the RT equations permit determination of the thermal decay rate of quasiparticles () and the recombination coefficient Gedik et al. (2004). This may be seen by explicitly drawing a distinction between photoinduced quasiparticles () and thermally present ones () and rewriting . Eq. 2 then becomes
| (4) |
where the second term represents the recombination of photoinduced quasiparticles with their thermally populated counterparts. We consider the initial recombination rate , defined as
| (5) | |||||
| (6) |
where are the photoinduced and thermal decay rates.
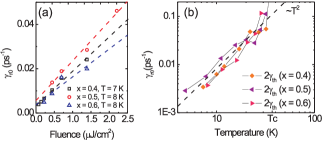
Experimentally, we deduce from the initial slope of the reflectivity transients following the peak. As suggested by Eq. 6, we obtain by extrapolating the linear fits to zero excitation density (i.e., ) for each temperature, as shown in Fig. 5a at 7 and 8 K. The slope of the fits is proportional to , which we observed did not strongly depend on the temperature for any of these samples. The intercept was observed to increase with due to the greater thermal quasiparticle population. We shall examine each quantity in turn.
In order to determine the value of , an estimate of for a given is required, which we will conveniently pick as the saturation fluence. The average energy density deposited by the pump beam within the penetration depth at saturation is , using the value for determined above. We compare this value with an estimate based on the assumption that saturation occurs when the quasiparticle system receives an energy comparable to the condensation energy, which we approximate from the BCS theory as . Here, is the density of states at the Fermi level and is the superconducting gap energy. Using an average gap size of =10 meV and per unit cell Ding et al. (2008a), we obtain a condensation energy of . This value is significantly smaller than the experimentally measured saturation energy of . Hence, only of the energy goes into creating quasiparticle pairs. Using this value to convert the laser fluence into excitation density, we obtain . For a BCS superconductor in the dirty limit, is proportional to the ratio of the electron phonon coupling constant to the density of states at the Fermi energy Kaplan et al. (1976). In the case of pnictide superconductors with multiple gaps, a detailed theoretical model for the quasiparticle recombination is necessary to further interpret the measured value of .
Figure 5b presents as a function of temperature for . Significantly, the data presented in this Figure reveal that the thermal decay rate is proportional to below for these doping levels. This suggests the presence of a node in the gap around which , as opposed to the exponential dependence expected from an isotropic gap. However, the linear dependence of the magnitude of on at weak excitation levels (Fig. 4a) argues against the presence of nodal quasiparticles, which would lead to , as discussed above.
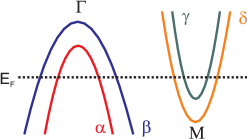
The phenomenological consistency of the pump-probe measurements in the doping range indicate that the physics of these materials is consistent with the band-dependent picture we have developed for the materialTorchinsky et al. (2010). As this picture is central to our understanding of nonequilibrium quasiparticle dynamics in the pnictides, we briefly summarize it using the simplified representation of a pnictide band structure in Fig. 6.
LDA calculationsMa et al. (2008) have shown a lack of states 1.5 eV above and (accounting for renormalizationWray et al. (2008)) below the Fermi level at the M point of the Brillouin zone, implying that the probe wavelength used in these experiments is not able to couple to quasiparticle dynamics at this location in the zone. This point is bolstered by an estimate of the Sommerfeld parameter, which shows the density of states of the hole bands to be several times larger than at the electron pocketsDing et al. (2008a), resulting in a much greater number of photoinduced quasiparticles at the hole pockets as compared with the electron pockets.
Thus, the electron bands do not contribute significantly to signal, i.e., derives almost exclusively from the hole bands. In particular, strong coupling between the carriers in the bands with those in Richard et al. (2009); Wray et al. (2008) leads to the observed excitation density dependent dynamics, while the isolation of carriers in from the other bands is represented by their slow, bottlenecked decay. Furthermore, since the entirety of the signal is due to the hole bands, we may thus interpret the observation to indicate that it is these bands which possess fully gapped excitations.
As the excitation density is lowered, the thermal quasiparticle population becomes comparable to, and then exceeds, the photoinduced one. Nonequilibrium quasiparticle recombination is then dominated by the second term in Eq. 4, which represents a photoinduced quasiparticle recombining with a thermal one. This measurement thus becomes particularly sensitive to the presence of either a highly anisotropic gap or a node on the Fermi surface, as the locally small gap energy leads to a relatively higher concentration of thermal quasiparticles in its vicinity.
Here, the observation that may be indicative of either a highly anisotropic gap or node on the electron pockets, as interband scattering may be dominated by photoexcited carriers in recombining with a relatively large population of thermally present carriers in . This scenario is compatible with an order parameter with impurity scattering to account for the behavior, although it does not require it. The fact that does not change up to doping levels of suggests that the Fermi surface topology is consistent up to this doping.
III.2 Ba1-xKxFe2As2: The High Fluence Regime
We now shift our attention to phenomena that require a different framework than that developed above, i.e., the observation of coherent oscillations in all samples at the highest fluences (J/cm2) and the dynamics of the underdoped hole-doped samples where .
At fluences greater than J/cm2, we observe the onset of highly damped oscillations in the short time transients shown in Figs 2b and 2c that become more apparent with increasing fluence. A clearer depiction of this effect is provided by Fig. 7 by extending the measurement window for the sample. These oscillations are due to stimulated Brillouin Scattering Thomsen et al. (1986), where interference between the portion of the probe beam reflected from the sample surface and from the propagating strain pulse launched by the pump modulates the signal in the time domain. The observed period of 40 ps is consistent with the expected value of Thomsen et al. (1986) where is the wavelength of the probe, the angle of incidence, the speed of sound Zbiri et al. (2009) and the refractive index. The fast damping rate is set by the small optical penetration depth of the light ().
The strength of the SBS signal is linearly proportional to the thermal expansion coefficient. Thus, the disappearance of the oscillations in the low fluence data below is a manifestation of its large drop at the transition temperature for all Ba-122 pnictides. This drop is due to the thermodynamic relationship between and the expansivityBud’ko et al. (2009); Hardy et al. (2009); da Luz et al. (2009) and is more pronounced for expansion along the -axis as a result of the layered nature of the pnictidesda Luz et al. (2009). The presence of an acoustic wave may be an indication that the sample has been partially driven into the normal state, even at the relatively modest fluences used here ().
We examine the plausibility of this scenario by simple energy conservation arguments. We recall that the experimentally measured saturation energy, estimated above as , supports the hypothesis that high fluences deplete the superconducting condensate. However, this also indicates that a large fraction of the energy deposited by the laser is transferred into other internal degrees of freedom or is carried out of the probed region by through-plane transport of the excited electrons. The large excitation gradient that results from the short penetration depth of the pump may result in fast diffusion of the excited electrons, quickly transporting a significant fraction of the absorbed energy out of the experimentally probed region.
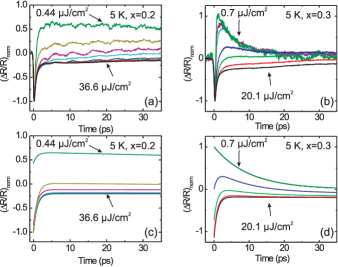
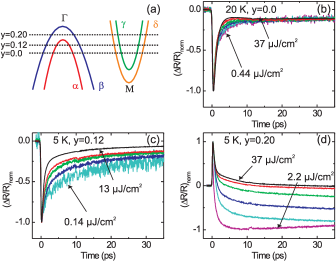
Shifting focus to the underdoped samples, Figs. 8a and 8b show the K reflectivity transients in the and samples. In the material, K and a spin-density wave transition occurs at K. In the sample, is suppressed to 100 K and is elevated to KChen et al. (2009). The dynamics observed here are markedly different than those of the optimally and overdoped samples. In the compound, the high fluence traces resemble the normal state of the samples. With reduced fluence, we see the emergence of an intensity-independent, slowly-decaying positive component reminiscent of the slow dynamics of Fig. 3a.
The dynamics of the sample shown in Fig. 8 reveal behavior similar to those of the sample at the highest fluences, again in contrast with the measurements of Figs. 2a-c. Here, we observe that with a reduction of the incident laser fluence, a positive component of the signal emerges whose recovery dynamics are intensity independent and decay on the relatively quick ps timescale.
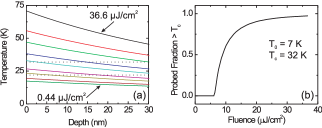
The absence of a bimolecular intensity dependence may be interpreted within the framework of the Rothwarf-Taylor equations as bottlenecked recombination. Unfortunately, this precludes an analysis to determine gap symmetry. However, we may understand these data by applying a simple model which considers the quasi-equilibrium temperature of the sample as a function of depth in the sample after excitation, the results of which are shown in Figs. 8c and 8d. Conservation of energy provides an expression for :
| (7) |
Here, the specific heat was modelled as a fifth-order polynomial using published data on the compoundNi et al. (2008). Equation 7 was then integrated and inverted numerically to reproduce the initial temperature profile, depicted in Fig. 9a. We note that high fluences produce a significant increase in temperature. In contrast, this increase is very modest at the low fluences examined in Sec. III.1.
The pump-probe measurement is an integrated measurement in depth. We therefore calculate the fraction of the sample which has been brought above the transition temperature from
| (8) |
where if and otherwise. The factor of two in the above equation accounts for the reflection of the beam back through the sample. In practice, this integral was numerically evaluated to 3 penetration depths. The result is shown in Fig. 9b. For an initial temperature of 7 K, the entire sample remains below for and achieves a 90:10 distribution between normal and superconducting state at . The small discrepancy between the value obtained from this simple model and the experimentally measured saturation fluence may be due to through-plane electronic diffusion mentioned above.
We consider the signal to comprise two parts. The first is a fast decaying negative component of timescale with an offset as to represent the normal state contribution. The second is a slow, positive component for the superconducting contribution of timescale as . The two components are then added in the proportion , where the coefficient is defined as the fraction of the sample seen by the probe beam with . Here, we compute as a weighted average of the temperature, as in Eq. 8.
The results of this calculation using , ps and ps are shown in Fig. 8c for the sample. Fig. 8d uses the same vales for and but a value of ps for the . In both cases, we observe excellent qualitative agreement between the experimental data and the model using no fitted parameters. Data acquired at higher initial temperatures showed similar agreement with this model for both and .
We note that this model is not able to replicate the dynamics of the optimally doped and overdoped samples discussed in the previous section. Even when accounting for the change in sign of the phenomenological superconducting component from positive to negative, no combination of simulation parameters can produce an initial decay rate that depends linearly on excitation fluence. This provides further evidence that the intensity dependence observed in the samples arises from bimolecular recombination kinetics. We thus emphasize that this analysis has no impact on the analysis performed in the low-fluence regime. First, in those traces, we deduced the gap symmetry from the initial quasiparticle decay rate , which was obtained from the slope of the reflectivity transients immediately after the peak, i.e., ps. This is much shorter than the time required for an equilibrium temperature to be established between the electronic system and the phonons. Second, all the data used in the analysis of Sec. III.1 were at such low fluences that the simulated equilibrium sample temperature did not depart significantly from the initial value.
The physical processes at play in the and samples may also be understood within the framework of the band-dependent dynamics discussed in the previous section. Ultrafast measurements on the Ba1-xKxFe2As2 samples for values of indicate a competition for itinerant electrons between the SDW state and the superconducting stateChia et al. (2010). This observation is consistent with ARPES measurements on Ba0.75K0.25Fe2As2 which have shown that the superconducting fraction in and are suppressed due to their contribution to SDW order via Fermi surface nestingXu et al. (2009). At , this nesting is even slightly more favored and hence the bulk of the optical pump-probe response in the superconducting state arises from the slow, intensity independent decay in the outer hole band with little to no contribution to the signal from the other bands.
In the sample, the absence of intensity dependence is again due to the presence of a SDW state between and which competes with superconductivity for carriers in these bands. It is, however, unclear at present why the dynamics change from slow to fast at this particular doping.
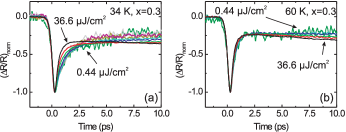
The presence of a pseudogap state in the 1111 system has already been argued for based on ultrafast pump-probe measurementsMertelj et al. (2009); ARPESXu et al. (2009) and optical conductivityKwon et al. (2010) have indicated the same for underdoped Ba1-xKxFe2As2 samples. In the context of the intensity dependent dynamics studied here, pseudogap behavior is suggested by the intensity dependence present above in Fig. 3c of Ref. Torchinsky et al., 2010 for . A clearer demonstration of such fluence dependence is depicted in the time-resolved reflectivity transients of Fig. 10a, which were measured in the sample 2 K above the transition temperature. There is a discernable tendency towards faster initial relaxation of the reflectivity transients with an increase in temperature. This disappears by 60 K, as may be seen in Fig. 10b.
In light of the band-dependent relaxation dynamics discussed above, we posit that those carriers participating in the pseudogap state must derive from the band because these carriers give rise to intensity dependent recombination in the superconducting state. This conclusion is consistent with prior ARPES measurements on Ba0.75K0.25Fe2As2 which show the presence of a pseudogap in but not in the other bandsXu et al. (2009).
III.3 BaFe2-yCoyAs2
We now shift our focus to the electron doped side of the phase diagram. Fig. 11a depicts the qualitative effect of doping on the Fermi level. As electrons are added to the system, the Fermi level rises in a rigid band manner, as has been observed by Brouet et al.Brouet et al. (2009) At a Co-doping of , the band begins to submerge below the Fermi level at various points along Sekiba et al. (2009). By the point of optimal Co-doping at , has been submerged well below the Fermi level.
The reflectivity transients of Fig. 11 exhibit the consequences of the disappearance of . As a point of comparison, Fig. 11b shows data from the parent compound taken at 20 K, well below the SDW transition temperature K. None of the intensity dependent relaxation dynamics associated with the hole-doped samples were observed in the undoped sample. We note the small effect of the suppression of the thermal expansion predominantly along the -axisHardy et al. (2009); da Luz et al. (2009); Bud’ko et al. (2009) which inhibits the generation of an acoustic wave. Qualitatively identical behavior was observed in an underdoped sample (, not shown) for which the SDW transition is suppressed to 95 K but which does not superconduct at low temperatures.
Fig. 11c shows raw data for ( K) taken at different fluences ranging from 0.14 to 13 . As with the samples, we observe a fast intensity dependence of the signal at short times with higher laser intensities corresponding to faster initial recombination rates. We note that the relatively low K of the sample does not allow us to use the initial decay-rate analysis employed above to determine Fermi surface topology.
With the submergence of the inner hole band at Sekiba et al. (2009), the characteristics of change markedly. Although qualitatively similar behavior was observed in the ( K) sample, these dynamics are most clearly represented by the sample due to its slightly higher K. As may be seen in Fig. 11d, traces scaled to the initial electronic response at are qualitatively identical (within a sign) to those of the underdoped hole-doped sample in Fig 8a. Indeed, we observe that the polarity of the signal has changed from the underdoped to the optimally doped side of the phase diagram. A similar effect has also been observed in the (BSCCO) system of cuprate superconductorsGedik et al. (2005b).
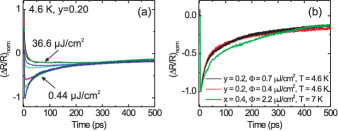
In order to better interpret the dynamics of Fig. 11d, we modelled the heat flow out of the excited region after the establishment of an initial equilibrium temperature. This was done by numerically solving the heat diffusion equation using literature temperature-dependent thermal conductivityCheckelsky et al. (2008) and heat capacityNi et al. (2008) data while assuming a temperature-independent density. The initial condition was specified using Eq. 7 and the incident fluence. In the limit of bottlenecked recombination, should be independent of initial quasiparticle density once the entire probed region is below . This indicates that the data should be scaled at the time when the entire sample becomes superconducting.
Reflectivity transients were acquired out to 600 ps and then rescaled at the point in time at which the entire probed depth is below . This rescaling is shown in Fig. 12a, where we observe a remarkable convergence of the data at long times. The highest fluences measured produce the normal state response, i.e., an initial “spike” followed by a quasi-steady state that does not decay within the time window. As the excitation fluence is reduced, the initial recovery gradually transitions to bottlenecked quasiparticle recombination at earlier and earlier times. At the lowest fluences ( and ), the entire probed region is below and there is an intensity independent, bottlenecked relaxation of the signal.
This behavior recalls the slow dynamics of the optimally hole-doped sample shown in Fig. 3a. A comparison of these two data sets is provided in Fig. 12b which plots data from the optimally hole-doped sample () at 2.2 alongside data recorded at the lowest fluences in the optimally electron-doped sample (). We observe nearly identical behavior, suggesting that these decays arise from the same set of dynamics. As mentioned above, this slow decay was observed to switch off in both samples abruptly at their respective superconducting transition temperatures, indicating that it originates from superconductivity.
We posit that the similarities between the long-time reflectivity transients produced by Ba0.6K0.4Fe2As2 and BaFe1.8Co0.2As2 may also account for the differences between the data in Figs. 11c and 11d. That is, the disappearance of bimolecular recombination with the doping of electrons derives from the band-dependent recombination dynamics presented above in Sec. III.1. The addition of electrons disrupts the near-perfect nesting of with , weakening the effect of the magnetic resonance on Cooper pairing and resulting in a diminished intensity dependence of the sample of Fig. 11c. Further doping of electrons leads to the submergence of and thus the remaining relaxation in the sample is the slow decay of photoinduced carriers in .
IV Summary and Conclusion
We have presented an ultrafast pump-probe study of the Ba-122 pnictides as a function of fluence and doping on both sides of the phase diagram that provides evidence for band-dependent dynamics. For optimally doped Ba1-xKxFe2As2, the initial recovery rate of the reflectivity transients depends linearly on the incident laser fluence in the low excitation limit. This component of the signal was argued to derive from the inner hole band . A Rothwarf-Taylor analysis of this intensity dependence in the low-fluence limit yields a behavior for the thermal population of quasiparticles. At long times, tended towards a slow, intensity independent decay which originates from the outer hole band, . These observations were unchanged with an increase of K-doping up to levels of . Our results thus indicate fully gapped hole bands with nodal or strongly anisotropic electron bands in these samples.
In underdoped samples (), the intensity dependence disappears as electrons in are taken up by SDW ordering and hence unable to participate in superconductivity. The fluence dependence of is then governed by the decay in in a proportion which may be estimated by considering the fraction of the probed depth which is driven above by the pump.
In the BaFe2-yCoyAs2 samples, we observed intensity dependent recombination at low doping levels () which completely disappeared with the submergence of the inner hole band by the doping of electrons. The long-time dynamics of these samples were consistent with bottlenecked behavior due to quasiparticle recombination in the outer hole band .
Intensity dependence was observed to persist above the transition temperature for samples with K-doping at levels of and was taken as evidence for a pseudogap state. This pseudogap behavior was posited to arise from , consistent with prior ARPES measurements. No such behavior is observed on the electron doped side of the phase diagram.
Stimulated Brillouin scattering was observed in all samples above the superconducting transition temperature but disappeared immediately below the transition temperature due to a large decrease of the thermal expansion coefficient at . The presence of Brillouin Scattering below the transition temperature for the highest incident fluences used in this study (e.g., ) is an indication that, even at these relatively modest fluences, the optical pulse was able to bring the sample into the normal state within the penetration depth of the excitation. At the highest fluences, this picture correlated well with basic modelling of reflectivity transients in terms of a linear combination of a normal-state response and a superconducting, bottlenecked quasiparticle recombination, the relative proportions of which are dictated by a simple equilibrium temperature model. In the low fluence regime, however, where no part of the probed region could reach a temperature greater than , either only bottlenecked or bare bimolecular recombination were observed.
V Acknowledgments
The authors thank Prof. B. Andrei Bernevig and Alex Frenzel for useful discussions. This work was supported by DOE Grant No. DE-FG02-08ER46521, the MRSEC Program of the National Science Foundation under award number DMR - 0819762, the NSFC, CAS and the 973 project of the MOST of China.
References
- Kamihara et al. (2008) Y. Kamihara, T. Watanabe, M. Hirano, and H. Hosono, Journal of the American Chemical Society 130, 3296 (2008).
- Rotter et al. (2008) M. Rotter, M. Tegel, and D. Johrendt, Phys. Rev. Lett. 101, 107006 (2008).
- Qazilbash et al. (2009) M. M. Qazilbash, J. J. Hamlin, R. E. Baumbach, L. Zhang, D. J. Singh, M. B. Maple, and D. N. Basov, Nature Physics 5, 647 (2009).
- de la Cruz et al. (2008) C. de la Cruz, Q. Huang, J. W. Lynn, J. Li, W. Ratcliff, J. L. Zarestky, H. a. Mook, G. F. Chen, J. L. Luo, N. L. Wang, and P. Dai, Nature 453, 899 (2008).
- Huang et al. (2008) Q. Huang, Y. Qiu, W. Bao, M. a. Green, J. W. Lynn, Y. C. Gasparovic, T. Wu, G. Wu, and X. H. Chen, Phys. Rev. Lett. 101, 2 (2008).
- Christianson et al. (2008) A. D. Christianson et al., Nature 456, 930 (2008).
- Lumsden et al. (2009) M. D. Lumsden et al., Phys. Rev. Lett. 102, 107005 (2009).
- Tsuei and Kirtley (2000) C. C. Tsuei and J. R. Kirtley, Rev. Mod. Phys. 72, 969 (2000).
- Mazin et al. (2008) I. I. Mazin et al., Phys. Rev. Lett. 101, 057003 (2008).
- Wang et al. (2009) F. Wang, H. Zhai, Y. Ran, A. Vishwanath, and D.-H. Lee, Phys. Rev. Lett. 102, 047005 (2009).
- Chubukov et al. (2008) A. V. Chubukov, D. V. Efremov, and I. Eremin, Phys. Rev. B 78, 134512 (2008).
- Ding et al. (2008a) H. Ding et al., arXiv:0812.0534 (2008a).
- Ding et al. (2008b) H. Ding et al., Europhys. Lett. 83, 47001 (2008b).
- Wray et al. (2008) L. Wray et al., Phys. Rev. B 78, 184508 (2008).
- Fukazawa et al. (2009) H. Fukazawa et al., J. Phys. Soc. Jpn. 78, 033704 (2009).
- Martin et al. (2009) C. Martin et al., Phys. Rev. B 80, 020501 (2009).
- Graser et al. (2009) S. Graser et al., New Journal of Physics 11, 025016 (2009).
- Yanagi et al. (2008) Y. Yanagi, Y. Yamakawa, and Y. Ono, Journal of the Physical Society of Japan 77, 123701 (2008).
- Parker and Williams (1972) W. H. Parker and W. D. Williams, Phys. Rev. Lett. 29, 924 (1972).
- Gedik et al. (2004) N. Gedik et al., Phys. Rev. B 70, 014504 (2004).
- Gedik et al. (2005a) N. Gedik et al., Phys. Rev. Lett. 95, 117005 (2005a).
- Demsar et al. (2003) J. Demsar et al., Phys. Rev. Lett. 91, 267002 (2003).
- Gadermaier et al. (2010) C. Gadermaier, A. S. Alexandrov, V. V. Kabanov, P. Kusar, T. Mertelj, X. Yao, C. Manzoni, D. Brida, G. Cerullo, and D. Mihailovic, Phys. Rev. Lett. 105, 257001 (2010).
- Mertelj et al. (2009) T. Mertelj et al., Phys. Rev. Lett. 102, 117002 (2009).
- Chia et al. (2010) E. E. M. Chia et al., Phys. Rev. Lett. 104, 027003 (2010).
- Mansart et al. (2009) B. Mansart et al., Phys. Rev. B 80, 172504 (2009).
- Torchinsky et al. (2010) D. H. Torchinsky, G. F. Chen, J. L. Luo, N. L. Wang, and N. Gedik, Phys. Rev. Lett. 105, 027005 (2010).
- Richard et al. (2009) P. Richard et al., Phys. Rev. Lett. 102, 047003 (2009).
- Ma et al. (2008) F. Ma, Z.-Y. Lu, and T. Xiang, arXiv:0806.3526 (2008).
- Rothwarf and Taylor (1967) A. Rothwarf and B. N. Taylor, Phys. Rev. Lett. 19, 27 (1967).
- Bud’ko et al. (2009) S. L. Bud’ko, N. Ni, S. Nandi, G. M. Schmiedeshoff, and P. C. Canfield, Phys. Rev. B 79, 054525 (2009).
- Hardy et al. (2009) F. Hardy, P. Adelmann, T. Wolf, H. v. Löhneysen, and C. Meingast, Phys. Rev. Lett. 102, 187004 (2009).
- da Luz et al. (2009) M. S. da Luz, J. J. Neumeier, R. K. Bollinger, A. S. Sefat, M. A. McGuire, R. Jin, B. C. Sales, and D. Mandrus, Phys. Rev. B 79, 214505 (2009).
- Chen et al. (2008) G. F. Chen et al., Phys. Rev. B 78, 224512 (2008).
- Li et al. (2008) G. Li et al., Phys. Rev. Lett. 101, 107004 (2008).
- Checkelsky et al. (2008) J. G. Checkelsky et al., arXiv:0811.4668 (2008).
- (37) N. L. Wang, Private communication.
- Chen et al. (2009) H. Chen et al., Europhys. Lett. 85, 17006 (2009).
- Thomsen et al. (1986) C. Thomsen et al., Phys. Rev. B 34, 4129 (1986).
- Kaplan et al. (1976) S. B. Kaplan et al., Phys. Rev. B 14, 4854 (1976).
- Zbiri et al. (2009) M. Zbiri et al., Phys. Rev. B 79, 064511 (2009).
- Ni et al. (2008) N. Ni et al., Phys. Rev. B 78, 014507 (2008).
- Xu et al. (2009) Y. Xu et al., arXiv:0905.4467v2 (2009).
- Kwon et al. (2010) Y. Kwon, J. Hong, Y. Jang, H. Oh, Y. Song, B. Min, T. Iizuka, S. Kimura, A. Balatsky, and Y. Bang, arxiv:1007.3617 (2010).
- Brouet et al. (2009) V. Brouet, M. Marsi, B. Mansart, A. Nicolaou, A. Taleb-Ibrahimi, P. Le Fèvre, F. Bertran, F. Rullier-Albenque, A. Forget, and D. Colson, Phys. Rev. B 80, 165115 (2009).
- Sekiba et al. (2009) Y. Sekiba, T. Sato, K. Nakayama, K. Terashima, P. Richard, J. H. Bowen, H. Ding, Y.-M. Xu, L. J. Li, G. H. Cao, Z.-A. Xu, and T. Takahashi, New Journal of Physics 11, 025020 (2009).
- Thirupathaiah et al. (2010) S. Thirupathaiah, S. de Jong, R. Ovsyannikov, H. A. Dürr, A. Varykhalov, R. Follath, Y. Huang, R. Huisman, M. S. Golden, Y.-Z. Zhang, H. O. Jeschke, R. Valentí, A. Erb, A. Gloskovskii, and J. Fink, Phys. Rev. B 81, 104512 (2010).
- Gedik et al. (2005b) N. Gedik, M. Langner, J. Orenstein, S. Ono, Y. Abe, and Y. Ando, Phys. Rev. Lett. 95, 117005 (2005b).