Glass elasticity from particle trajectories
Abstract
Using positional data from video-microscopy of a two-dimensional colloidal system and from simulations of hard discs we determine the wave-vector-dependent elastic dispersion relations in glass. The emergence of rigidity based on the existence of a well defined displacement field in amorphous solids is demonstrated. Continuum elastic theory is recovered in the limit of long wavelengths which provides the glass elastic shear and bulk modulus as a function of temperature. The onset of a finite static shear modulus upon cooling marks the fluid/glass transition in an intuitive and unique way.
pacs:
82.70.Dd, 61.20.JaWhile fluids flow with a finite viscosity, solids respond elastically to deformation. At the glass transition, a supercooled liquid transforms into a disordered solid which possesses mechanical rigidity to shear deformations. The corresponding elastic constant is the shear modulus landau . In crystalline solids, shear rigidity results from the long-ranged correlations of displacements heralding the breaking of translational invariance. The transverse acoustical displacements are the Goldstone modes, whose (squared) amplitude scales with thermal energy in the equipartition theorem.
Yet, the emergence of rigidity at the glass transition, when an amorphous solid forms, remains poorly understood. Obviously, the disorder makes it a subtle fundamental problem to apply the concepts of spontaneous breaking of translational symmetry and of Goldstone modes. Already on the macroscopic level, different predictions exist for the behaviour of the shear modulus when an amorphous solid forms. It has been predicted to jump discontinuously by mode coupling theory Leutheusser1984 ; Goetze1985 , or to increase continuously from zero by replica theory Yoshino2010 ; Yoshino2012 . Such a continuous power-law increase from zero holds at the formation of a random gel, where a microscopic theory has established the link between the modulus and the Goldstone modes Zippelius2004 . Also in the theory of granular systems, critical fluctuations close to point J (which is the density where a random athermal system becomes jammed) cause a characteristic algebraic increase of the shear modulus from zero OHern2003 . A more recent calculation in replica theory again finds a jump in shear modulus at the glass transition and identifies the displacement field of a disordered solid, necessary to discuss elastic acoustic modes. Szamel2011 . Definitions of displacement fields in disordered solids have already been given in Goldhirsch2002 , yet the equipartition theorem could not be established in this approach.
Colloidal dispersions offer the unique possibility that the particle trajectories can be observed by video microscopy, and thus are ideally suited to study displacements microscopically. In recent work on colloidal glass Ghosh2010 ; Kaya2010 ; Chen2010 , the covariance matrix of the particle displacements was obtained and the mechanical density of states and the associated local modes were studied. But the shear modulus and the elastic dispersion relations were not obtained. Up to now only in crystalline colloidal solids, the equipartition theorem provided a route to obtain them by microscopy Gruenberg2004 ; Reinke2007 .
In this letter, we analyze the elastic properties for both an experimental 2D colloidal glass former and for simulation data of binary hard discs. We employ microscopy of displacement fluctuations, establish the equipartition theorem, and obtain the dispersion relations and elastic moduli. Our analysis is based on a quasi-equilibrium description of the non-ergodic glass state, which we derive under the assumption of a kinetic glass transition. The moduli are derived from thermally excited modes in the small wavevector limit. A sudden rise in the shear modulus marks the onset of vitrification. This proves that rigidity emerges differently in glasses than in polymeric gels and jammed granulates.
Here we briefly summarise our theoretical approach, which will be given in detail elsewhere. The relation is the defining relation which introduces the collective displacement field ; is the familiar velocity field hansen . Fourier-modes depending on wavevector are considered to use translational invariance. Let time averaging be denoted by an overbar so that is the average position of particle during the time interval , and the particle’s displacement is . To order ), the field follows by integration
| (1) |
For this result to make sense, the particle displacements are required to remain bounded. For glass, this can be shown using the Zwanzig-Mori equations of motion of the correlation functions hansen , which are given in the supplement supplement . They are determined by stress kernels , which in the limit of vanishing reduce to the shear response measured in macroscopic linear rheology Siebenbuerger2012 . We take glass to be a non-ergodic state, so that the stress kernels, like density fluctuations Goetze1985 ; GoetzeMayr2000 , do not relax to equilibrium but take finite values at infinite time (index ), , for . This is an idealization as it requires that the structural relaxation time becomes infinite, while it (only) becomes larger than the measurement time in reality Angell1988 . Then the equations of motion lead to displacement auto-correlation functions, whose equal time value obeys the equipartition theorem in glass supplement
| (2) |
where, is the isothermal compressibility of the fluid with density and structure factor . The averaged squared displacements are given by elastic coefficients (the ’dynamical matrix’ ), which are the frozen-in contributions in stress kernels. The superscript ’glass’ indicates that averaging is done in a restricted phase space set by the glassy state. As the so obtained displacement fluctuations are ergodic, time and ensemble averages agree Kubo1957 ; this was implicitly used in ansatz (1). The Eigenvalues (the subscript denotes polarization) of the dynamical matrix are the ’dispersion relations’ and give the elastic spectrum of the amorphous system. In high symmetry crystals in 2D as well as in amorphous solids, the elasticity tensor possesses only two independent elements. These are the Lamé coefficients and of continuum elasticity theory. In two dimensions, gives the shear and the bulk modulus, extracted from the transverse and longitudinal displacements and in the long wavelength limit
| (3) | |||||
| (4) |
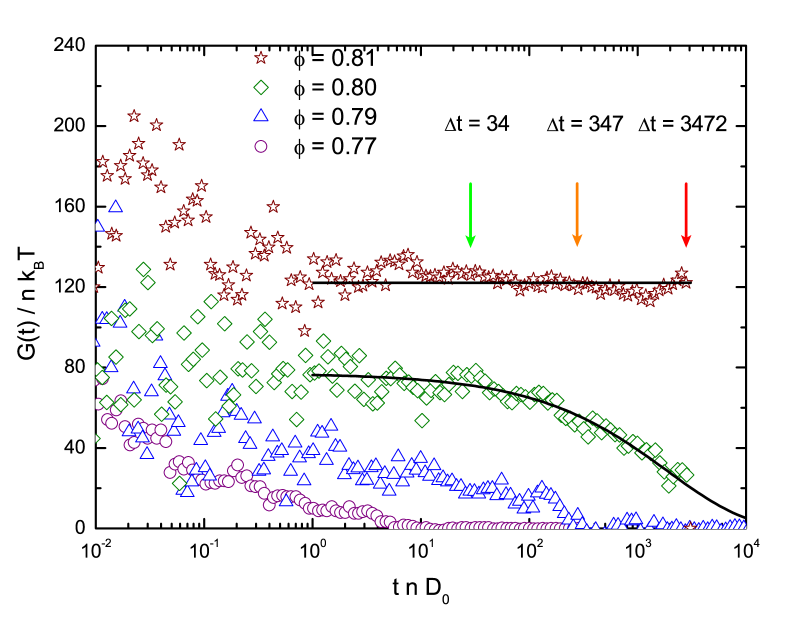
In order to validate our prediction in Eq. (2) that the shear modulus derived from frozen-in stress correlations equals the one from static displacement fluctuations, , we performed Brownian dynamics simulations of a binary mixture of hard discs in two dimensions supplement ; Weysser2011 . Figure 1 shows the time-dependent shear stress correlation function for (area) packing fractions close to the glass transition. The mode coupling glass transition was determined as Weysser2011 . The exhibit a two-step relaxation process with a finite amplitude of the final (so called -) process. It only decays for times comparable to the structural relaxation time . Conventionally, it is obtained from fitting e.g. a Kohlrausch law to the final decay Angell1988 ; kohlrausch . When, upon raising , the time increases beyond the observation window, a finite ’frozen-in’ amplitude remains which is . Figure 1 shows that at intermediate times in the supercooled fluid, and in the glass, the shear elastic constant is finite.
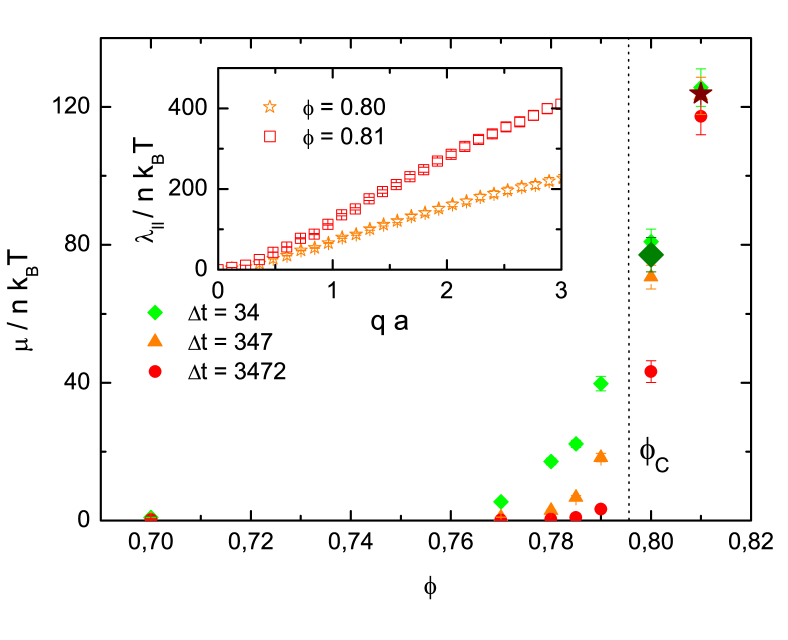
Yet the simulations in Fig. 1 are very demanding so that earlier ones remained inconclusive on Barrat1988 , which advocates the more efficient method to correlate the displacement fluctuations. Quite intuitively, we use the time-averaged center of the trajectory as ’equilibrium’ site of a particle. Its displacement is determined relative to this position as function of time Keim2004 . This goes beyond 3D crystals, where lattice sites can be used. The latter is unfeasible in amorphous solids as well as in 2D crystals where strict long range translational order is spoiled due to Mermin-Wagner fluctuations Mermin1968 . Arrows in Fig. 1 indicate the lengths of different trajectories used to calculate the shear modulus from the displacement fluctuations according to Eq. (4). The expression for holds as long as is smaller than the relaxation time . The results for are shown in Fig. 2 for different and . The comparison for the states at , and shows that calculated from displacement fluctuations agrees with calculated from the stress autocorrelation function. This verifies our theory. The modulus takes finite values as long as the structural relaxation time exceeds , as can be seen from Fig. 1. Approaching the mode coupling glass transition at from above, softens but stays finite in Fig. 2. Note that the time-scale in Fig. 1 is logarithmic: Because of the equidistant sampling used to measure , the final part of the time signal dominates. This explains that in Fig. 2 for the measurement using is below the shorter ones. The final -process already affects this measurement. While this decay lacks a theoretical description, for the present context it suffices that it does not affect Adichtchev2002 . On the fluid side, the modulus drops to very small values for longer than the timescale of short time correlations. Because Eq. (4) measures a squared quantity, it can only give a positive value, which, however, converges to zero with increasing in the fluid.
After having validated our method, we apply it to the experimental 2D colloidal glass. The system consists of a binary mixture of super-paramagnetic polystyrene spheres confined to a flat water-air interface Ebert2009 . The species A (diameter ) and B () have a relative concentration of where and are the number of particles of both species in the field of view. An external magnetic field , perpendicular to the interface, lets us control the particle interactions in situ. This is expressed by the dimensionless coupling parameter
| (5) |
which acts as an inverse temperature. denotes the 2D number density computed via Voronoi tessellation. is the susceptibility of species A, B. Video microscopy and digital image analysis provide the position of individual particles as function of time.
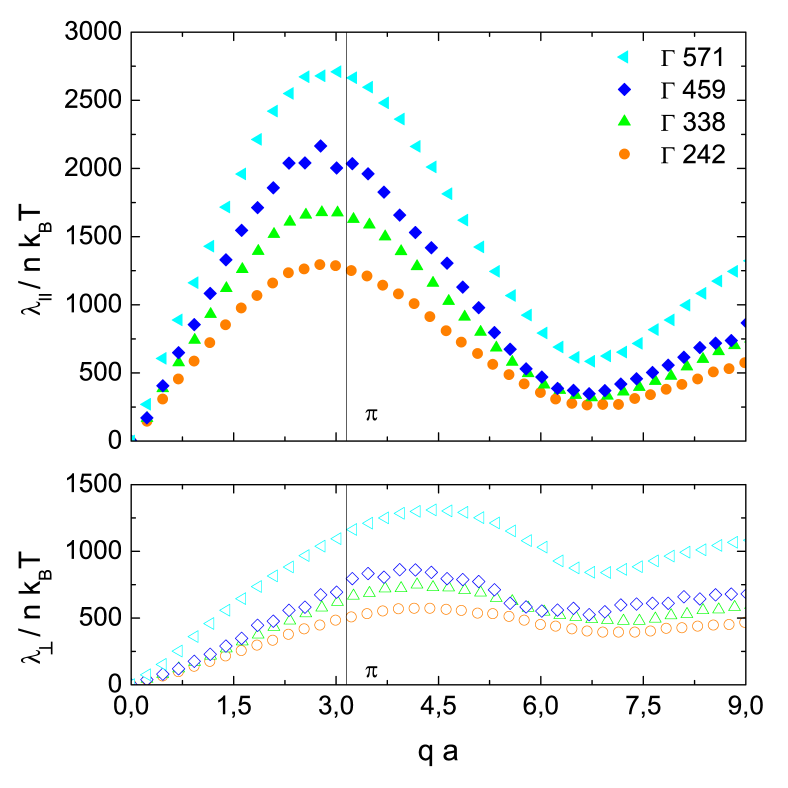
In Fig. 3, the measured dispersion relations are shown for different interaction parameters . Filled and empty symbols represent spring constants for longitudinal and transverse modes, respectively. The existence of transverse elastic modes signals the solid. The small noise in the measured curves is remarkable and unexpected based on the complicated eigenvalue- and eigenvector structure of the covariance-matrices obtained from the instantaneous displacements in real space Ghosh2010 ; Kaya2010 ; Chen2010 . The Fourier-transformed displacements introduced in (1) apparently are a good set of modes. Their dispersion correlates with the mean particle separation defined from the density revealing to the short-range order of the glass. The growing amplitude of the curves for increasing reflects the expected stiffening of the system upon cooling.
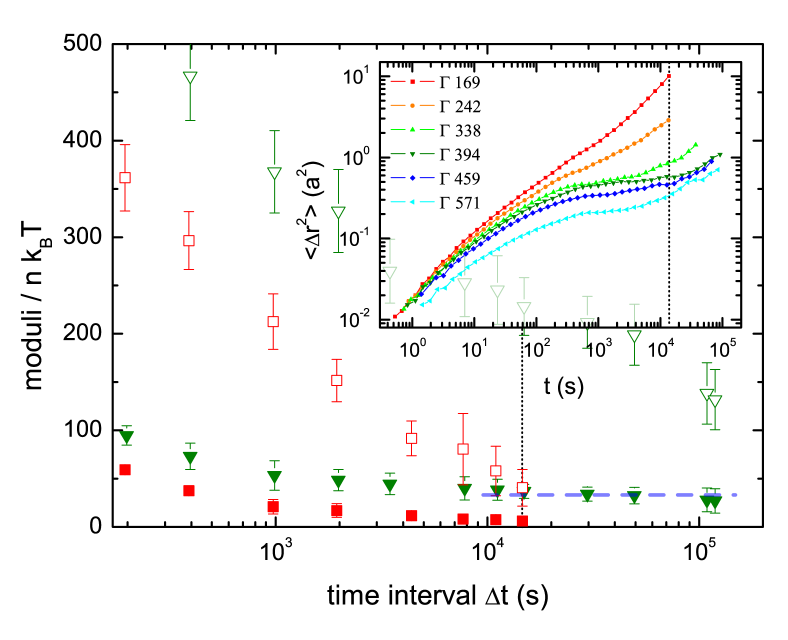
From the dispersion relations, the moduli can be obtained via Eqs. (3,4). We chose an intermediate regime () for the extrapolation where the data for linear regression fits best Gruenberg2004 ; comment . As the time interval enables us to differentiate between high frequency and low frequency moduli, we discuss the dependence on first. Reducing (corresponding to high frequencies), Fig. 4 clearly indicates the expected growth of the shear modulus for both typical fluid () and solid () state. These results are consistent with Jeong1987 . At the same time, we see that for long sampling times , its exact value makes no significant difference for computing the shear modulus. This is marked by a plateau (blue dashed line in Fig. 4). The plateau is more stable than the one in the MSD Koenig2005 ; Mazoyer2009 , which is already affected by the -process at a correlation time of about a few (inset of Fig. 4). The plateau in the shear modulus, however, ranges from up to (which is the longest experimental sampling time we measured). In Figure 4 and 5 the bulk modulus is included. It stays finite in the fluid phase for large as expected. But since the amplitude square of the longitudinal mode is ten times smaller compared to the transverse one, it is more strongly affected by structural relaxations at (e.g. aging) and/or Mermin-Wagner fluctuations Mermin1968 known from 2D crystals and also by a finite particle resolution comment (see the error bars of Fig. 5). Therefore we focus on the shear modulus in the following.
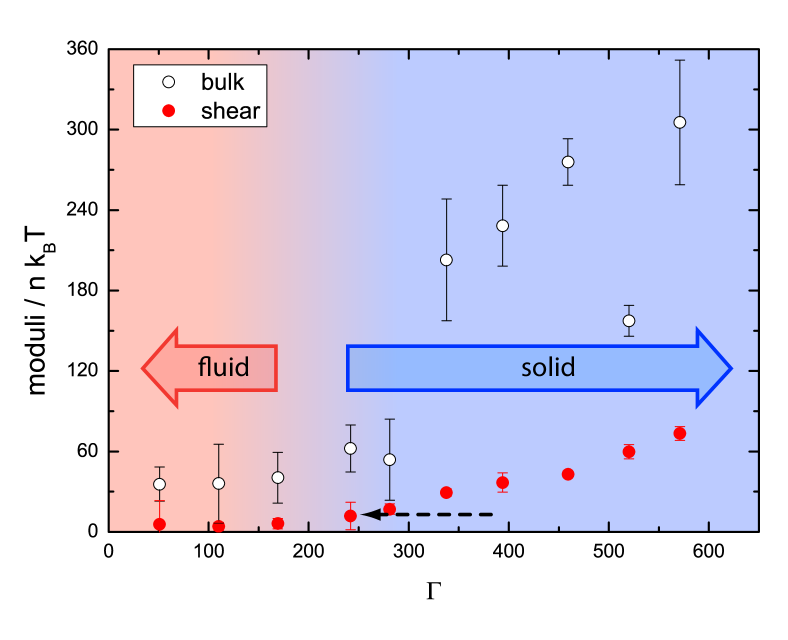
Fig. 5 displays the measured temperature dependence of the moduli comment_II . As expected, the shear modulus is zero in the fluid phase (first three data points). As we further cool down our sample, we find an onset of , indicating the beginning of vitrification where the system becomes rigid (indicated by the shading). The magnitude of compares well to a mode coupling calculation (dashed arrow in Fig. 5) Seyboldt2011 . With the given temperature resolution of the experimental data we can not decide unambiguously if the shear modulus jumps discontinuously (as we did with the simulation data). But Fig. 5 clearly marks the region of vitrification wich was unknown for 2D amorphous systems with long range particle interaction.
In conclusion, we have shown that video microscopy allows us to obtain the elastic dispersion relation of an amorphous solid directly from the spatially Fourier transformed displacement fields. The classical equipartition theorem holds and in the long wavelength limit we can extract the elasticity from the dispersion relation. A finite quasi-equilibrium shear modulus marks the onset of vitrification in the experimental 2D system. With simulation data we were able to show that this transition is discontinuous (unlike in granular systems or gels). Our work establishes microscopy of displacements as novel spectroscopic technique in supercooled liquids and glasses. This is of especial interest in soft matter systems where the classical definition using a viscosity Poise does not hold.
Acknowledgements.
P.K. gratefully acknowledge financial support of the Young Scholar Fund, University of Konstanz.References
- (1) L. D. Landau, L. P. Pitaevskii, E. M. Lifshitz and A. M. Kosevich, Theory of Elasticity, Butterworth-Heinemann, 3rd edn., 1986, pp. 142–144.
- (2) E. Leutheusser, Phys. Rev. A 29, 2765 (1984).
- (3) W. Götze, Z. Phys. B 60, 195 (1985).
- (4) H. Yoshino, M. Mezard, Phys. Rev. Lett. 105, 015504 (2010).
- (5) H. Yoshino, Jour. Chem. Phys. 136, 214108 (2012).
- (6) S. Mukhopadhyay, P.M. Goldbart, A. Zippelius, Europhys. Lett. 67, 49 (2004).
- (7) C.S. O’Hern, L.E. Silbert, A.J. Liu, S.R. Nagel, Phys. Rev. E 68, 011306 (2003).
- (8) G. Szamel, E. Flenner, Phys. Rev. Lett. 107, 105505 (2011).
- (9) I. Goldhirsch, C. Goldenberg, Eur. Phys. Jour. E 9, 245 (2002).
- (10) A. Ghosh, V.K. Chikkadi, P. Schall, J. Kurchan, D. Bonn, Phys. Rev. Lett. 104, 248305 (2010).
- (11) D. Kaya, N.L. Green, C.E. Maloney, M.F. Islam, Science 329, 329 (2010).
- (12) K. Chen, W.G. Ellenbroek, Z. Zhang, D.T.N. Chen, P.J. Yunker, S. Henkes, C. Brito, O. Dauchot, W. van Saarloos, A.J. Liu, A.G. Yodh, Phys. Rev. Lett. 105, 025501 (2010).
- (13) H.H. von Grünberg, P. Keim, K. Zahn, G. Maret, Phys. Rev. Lett. 93, 255703 (2004).
- (14) D. Reinke, H. Stark, H.H. von Grünberg, A.B. Schofield, G. Maret, U. Gasser, Phys. Rev. Lett. 98, 038301 (2007).
- (15) J.P. Hansen, I.R. Mcdonald: Theory of simple Liquids. (Academic Press, London, 2006).
- (16) Supplementary material
- (17) M. Siebenbürger, M. Fuchs, M. Ballauff, Soft Matter 8, 4025 (2012).
- (18) W. Götze, M.R. Mayr, Phys. Rev. E 61, 587 (2000).
- (19) C.A. Angell, J. Non-Cryst. Solids 102, 205 (1988).
- (20) R. Kubo, J. Phys. Soc. Jpn. 12, 570 (1957).
- (21) P. Keim, G. Maret, U. Herz, H.H. von Grünberg, Phys. Rev. Lett. 92, 215504 (2004).
- (22) N.D. Mermin, Phys. Rev. 176, 250 (1968).
- (23) F. Weysser, D. Hajnal, Phys. Rev. E 83, 041503 (2011).
- (24) Its finite amplitude contrasts with the power-law decay expected at the glass transition when vanishes Yoshino2010 .
- (25) J.L. Barrat, J.N. Roux, J.P. Hansen, M.L. Klein, Europhys. Lett. 7, 707 (1988).
- (26) S.V. Adichtchev, St. Benkhof, Th. Blochowicz, V.N. Novikov, E. Rössler, Ch. Tschirwitz, J. Wiedersich, Phys. Rev. Lett. 88, 055703 (2002).
- (27) F. Ebert, P. Dillmann, G. Maret, P. Keim, Rev. Sci. Instr. 80, 083902 (2009).
- (28) The error bars for the simulations in Fig. 2 measure a statistical error. Since we can not prepare identical representations (with identical histories) for the experimental system the error bars of Fig. 4, and 5 stem from the linear regression of the extrapolation and the systematic error due to finite resolution in particle position (about ).
- (29) Y.H. Jeong, Phys. Rev. A 36, 766 (1987).
- (30) H. König, R. Hund, K. Zahn, G. Maret, Euro. Phys. Jour. E 18, 287 (2005).
- (31) S. Mazoyer, F. Ebert, G. Maret, P. Keim, Euro. Phys. Lett. 88, 66004 (2009).
- (32) was chosen to be for the experimental data. It assures that we measure the glassy elasticity not in the high frequency region but at times shorter than .
- (33) R. Seyboldt, D. Hajnal, F. Weysser, M. Fuchs, Soft Matter 8, 4132 (2012).
![[Uncaptioned image]](/html/1108.2636/assets/x6.png)
![[Uncaptioned image]](/html/1108.2636/assets/x7.png)