An All-Sky Catalog of Bright M Dwarfs.
Abstract
We present an all-sky catalog of M dwarf stars with apparent infrared magnitude J10. The 8,889 stars are selected from the ongoing SUPERBLINK survey of stars with proper motion 40 mas yr-1, supplemented on the bright end with the TYCHO-2 catalog. Completeness tests which account for kinematic (proper motion) bias suggest that our catalog represents of the estimated M dwarfs with J10 expected to populate the entire sky. Our catalog is, however, significantly more complete for the Northern sky (90%) than it is for the South (60%). Stars are identified as cool, red M dwarfs from a combination of optical and infrared color cuts, and are distinguished from background M giants and highly-reddened stars using either existing parallax measurements or, if such measurements are lacking, on their location in an optical-to-infrared reduced proper motion diagram. These bright M dwarfs are all prime targets for exoplanet surveys using the Doppler radial velocity or transit methods; the combination of low-mass and bright apparent magnitude should make possible the detection of Earth-size planets on short-period orbits using currently available techniques. Parallax measurements, when available, and photometric distance estimates are provided for all stars, and these place most systems within 60 parsecs of the Sun. Spectral type estimated from V-J color shows that most of the stars range from K7 to M4, with only a few late M dwarfs, all within 20 pc. Proximity to the Sun also makes these stars good targets for high-resolution exoplanet imaging searches, especially if younger objects can be identified on the basis of X-ray or UV excess. For that purpose, we include X-ray flux from ROSAT and FUV/NUV ultraviolet magnitudes from GALEX for all stars for which a counterpart can be identified in those catalogs. Additional photometric data include optical magnitudes from Digitized Sky Survey plates, and infrared magnitudes from 2MASS.
Subject headings:
Catalogs – Surveys – Proper motions – Stars: low-mass, brown dwarfs – Solar neighborhood – Stars: kinematics and dynamics1. Introduction
M dwarfs are main sequence stars whose spectra display bands of TiO and other molecules such as CaH, VO, FeH, and CrH (Kirkpatrick et al., 1991). The high molecular opacities are the result of a cool atmosphere with effective temperatures in the range 2400K-3700K (Allard & Hauschildt, 1995). Observed orbital motion of astrometric binaries (Delfosse et al., 1999) show that M dwarfs have masses ranging from 0.5 M⊙ all the way down to the hydrogen-burning limit (0.075 M⊙). M dwarfs have relatively small sizes, with radii roughly proportional to their masses. Recent measurements of eclipsing systems (Fernandez et al., 2009) indicate a roughly linear relationship between masses and radii, with a 0.4 M⊙ (0.1 M⊙) M dwarf having a radius of 0.4 R⊙ (0.15 R⊙). By number, M dwarfs form the bulk of the stars in our Galaxy. The census of stars within 33 parsecs of the Sun (Lépine, 2005a) shows M dwarfs outnumbering all other hydrogen-burning objects by a factor of three to one. Because of their low mass-to-light ratio, M dwarfs contribute only a small fraction of the light emission in galaxies, but they may be the dominant baryonic component in at least some galaxies (van Dokkum & Conroy, 2010).
In recent years there has been an increasing interest in M dwarfs due to the discovery that they too host exoplanets. As of January 2011, 25% of the 41 Doppler-confirmed planets with 30M⊕ are orbiting M dwarfs111from http://exoplanet.eu. The Geneva/HARPS planet search team reports that 30% of low-mass stars harbor planets with masses 30 on orbits shorter than 50 d (Mayor et al., 2009) and preliminary Kepler results suggest that M dwarfs host just as many, if not more, super-Earths and Neptunes as solar-mass stars (Borucki et al., 2011b). Exoplanet candidates have been identified by Kepler in stars having colors consistent with M dwarfs (Borucki et al., 2011a), despite the fact that very few M dwarfs are being targeted by the mission (Batalha et al., 2010).
Large exoplanet surveys have now started to monitor sizable numbers of M dwarfs, such as the M2K program which is targeting some 1,600 M dwarfs for radial velocity monitoring (Apps et al., 2010), and the MEarth project (Irwin et al., 2009, 2010) which is designed to detect exoplanet transits in nearby late-type M dwarfs.
The two principal methods of exoplanet detection, Doppler measurement of radial velocity (RV) and photometric detection of transits, are more sensitive to planets around stars of lower mass. For a given planet mass and orbital period, RV amplitude scales as . In contrast to late-type M stars, the vast majority of early M dwarfs are not rapid rotators or chromospherically active (WÅ) (Bochanski et al., 2005; West et al., 2008; Reiners & Basri, 2008) and are thus amenable to these search techniques. In fact, inactive K and early M stars have weaker P-mode oscillations and lower Doppler noise (“jitter”) than their F or G counterparts (Wright, 2005; Isaacson & Fischer, 2011). Photometric transit depth scales approximately as for planets of similar size. Because of their significantly smaller radii, M dwarfs display deeper transits which do not require high precision photometry for detection, as they do for G stars (Nutzman & Charbonneau, 2008).
Another method of planet detection is high-contrast imaging at infrared wavelengths where a (giant) planet is self-luminous (Lowrance et al., 2005; Chauvin et al., 2006; Lafrenière et al., 2007; Biller, 2007; Kasper et al., 2007; Beichman et al., 2010; Heinze et al., 2010; Liu et al., 2010). M dwarf systems present a much more favorable planet/star contrast ratio compared to solar-mass stars, due to the significantly lower luminosity of M dwarfs. Young systems are of particular interest because the luminosity of giant planets is predicted to be orders of magnitude higher at ages of yr (Fortney & Nettelman, 2010) providing a more favorable contrast, even as the host star itself is moderately more luminous at this younger age. Young solar mass stars can be identified by their enhanced rotation, dynamo activity, and chromospheric emission (Kiraga & Stepien, 2007), although the trend for late M stars for which the mechanism of dynamo operation is thought to be different is less clear (West et al., 2009; West & Basri, 2009; Browning et al., 2010; Reiners & Basri, 2010). Another challenge for this approach is the apparent rarity of giant planets on long-period orbits around solar-mass stars (Ida & Lin, 2004; Nielsen & Close, 2010) combined with the paucity of giant planets around M dwarfs compared to G dwarfs (Johnson et al., 2010a). It is also possible that young giant planets may be less luminous and more difficult to detect than previously predicted (Fortney et al., 2008).
Low luminosity M dwarfs are also attractive targets because planets within their diminutive habitable zones are easier to detect (Kasting, Whitmire, & Reynolds, 1993; Scalo et al., 2007; Tarter et al., 2007; Gaidos et al., 2007). The correlation between high metallicity and the presence of giant planets found among solar-mass stars (Gonzalez, 1997; Fischer, & Valenti, 2005) has been recently extended to M dwarf stars (Johnson & Apps, 2009; Johnson et al., 2010a), and metal-rich M dwarfs, if they can be identified (Bonfils et al., 2005; Schlaufman & Laughlin, 2010; Rojas-Ayala et al., 2010), would be especially propitious targets for planet searches.
Despite the attractiveness of M dwarfs for exoplanet surveys, there still is no systematic, all-sky census of these objects to a useful limiting magnitude. Part of the problem is that the low-mass M dwarfs are stars of relatively low luminosities (M). All but the closest M dwarfs are too faint (V12) to be part of the Hipparcos catalog (Perryman et al., 1997), which means that existing M dwarf samples are selected from proper motion catalogs with fainter magnitude limits. These include the Tycho-2 catalogue (Høg et al., 2000), which extends the Hipparcos catalog a few magnitudes fainter, and also the older and deeper Luyten Half Second (LHS) and New Luyten Two-Tenths (NLTT) catalogs (Luyten, 1979a, b) which were the primary source material for the well-known Catalog of Nearby Stars (Gliese & Jahreiss, 1991). Newer and more complete proper motion catalogs, such as the LSPM-North (Lépine & Shara, 2005) have the potential to expand the list of available M dwarf targets.
In this paper, we present the first all-sky catalog of bright (J10) M dwarfs. The sample is extracted from the all-sky SUPERBLINK proper motion catalog of stars with 40 mas yr-1, an extension of LSPM-North currently in development. The selection method is detailed in §2. The catalog itself is presented in §3. The completeness of the catalog is evaluated in §4. Conclusions follow in §5.
2. Selection method
2.1. Source: proper motion stars from SUPERBLINK


The SUPERBLINK proper motion survey is an all-sky search for stars with large proper motions based on a re-analysis of images from the Digitized Sky Surveys (DSS) using a specialized image-differencing algorithm and software. The basic search method is described in Lépine, Shara, & Rich (2002). Quality control procedures, including cross-correlation with other catalogs and the compilation of astrometric and photometric results, is discussed at length in Lépine & Shara (2005). Stringent quality control procedures, including visual confirmation of most objects, guarantees a very low level of false detections. The survey has a fixed, low proper motion threshold of mas yr-1. New stars with very large proper motions ( mas yr-1) discovered in the survey have been published in Lépine, Shara, & Rich (2002), Lépine, Shara, & Rich (2003), Lépine (2005b), and Lépine (2008). A complete list of northern stars with proper motions mas yr-1 was published in Lépine & Shara (2005); a similar list covering the southern sky has been completed and is available from the authors. Those complete lists incorporate data from the Hipparcos and Tycho-2 catalogs at the bright end, and the catalogs are estimated to be complete to a visual magnitude , and extend to . The completeness is significantly higher at high galactic latitudes, where field crowding is less of an issue. Dense fields at low galactic latitudes have a lower completeness due to faint stars often being lost to non-linearity in the crowded areas of photographic plates; saturation also prevents the detection of proper motion sources in the extended glare (up to several arc minutes) of extremely bright stars (e.g. Vega, Sirius, Canopus).
As of July 2011, the full SUPERBLINK catalog (stars with proper motions mas yr-1) comprised 2,270,481 objects, with the most extensive sky coverage north of Decl.=-20∘. The catalog was complete for the northern sky (Decl.0∘), but the survey was still in progress for large parts of the southern sky. The southern survey was however complete for stars with proper motions mas yr-1. This version of the SUPERBLINK catalog is the one used here.
2.2. Fundamental kinematic bias


The use of a proper motion catalog is a convenient way to identify nearby stars in general, and M dwarfs in particular, because proper motion-selected samples discriminate against distant background sources including M giants that would otherwise significantly contaminate a sample of cool stars selected by color alone. However, proper motion selection carries its own inherent bias: stars with small velocities in the plane of the sky tend not to be detected in proper motion surveys, depending on the distance to the source. Nearby, slow-moving stars can be included by lowering the proper motion limit of the sample, but this has the effect of increasing the contamination from background sources. There is a fine balance to achieve in adjusting the proper motion threshold, which would ideally have the sample incorporate the largest possible fraction of stars up to a specified distance, minimizing the kinematic bias, while at the same time limiting the contamination from background objects.
The SUPERBLINK catalog, with a proper motion limit mas yr-1, achieves such a balance for stars located within 100 parsecs of the Sun. This can be demonstrated with an analysis of proper motion in the Hipparcos catalog. Figure 1 shows the fraction of Hipparcos stars at a given distance from the Sun which have proper motions mas yr-1 and mas yr-1. The former value is the proper motion limit of the LSPM-North and south catalogs (which is also the approximate proper motion limit of the NLTT catalog and, by extension, the Catalog of Nearby Stars), while the latter is the proper motion limit of the extended SUPERBLINK catalog. The diagram shows that operating with a proper motion limit of mas yr-1 will only detect half the stars at 40pc and very few stars (only those with very large components of motion) at 100pc. However a sample with a proper motion limit mas yr-1 will include 95% of the stars at 40pc and 70% of the stars at 100pc.
Background giant stars, on the other hand, tend to have small proper motions, which exclude them from the SUPERBLINK catalog. Figure 2 shows the distribution of proper motions for red giant stars in the Hipparcos catalog, selected with the color and absolute magnitude cuts 1.0, 3.0. The bulk of the giants have proper motions below the SUPERBLINK threshold. This particular subset of giants, because it is from the Hipparcos catalog, also represents the nearest red giants to the Sun, since they all have magnitudes . More distant giants would have even smaller proper motions, and would also be excluded from our sample.
2.3. Color and magnitude cuts for bright M stars
Figure 3 shows the distribution of optical-to-infrared colors for a subset of M dwarfs with spectral classification from the Sloan Digital Sky Survey database (West et al., 2011). Infrared magnitudes are from 2MASS, while magnitudes are the SUPERBLINK visual magnitudes, estimated from Palomar Sky Survey photographic plate measurements as described in Lépine & Shara (2005). The subset includes all stars in SDSS which have counterparts in the SUPERBLINK proper motion catalog. For this subset of nearby M dwarfs, color ranges from at subtype M0, to at subtype M9. We adopt an M dwarf color-cut of , which is expected to include most stars of subtype M0 and later, at the expense of some contamination from late-K stars.
In addition, we select stars that are bright enough to be monitored by current and planned Doppler radial velocity instruments. Stars as faint as are routinely monitored using the High Resolution Spectrometer (HIRES) on the 10 m Keck I Telescope, e.g. Johnson et al. (2007, 2010b), and fainter but highly meritorious stars with transiting planets, e.g. GJ 1214 (Charbonneau et al., 2009), have been observed. M dwarf stars are brighter in the near-infrared, and future high-resolution spectrometers should be able to detect planets around stars as faint as . Anticipating such developments, we select stars with , which also includes all M dwarfs with .
To summarize, we select bright M dwarfs among high proper motion stars ( mas yr-1) in the SUPERBLINK catalog using these color/magnitude cuts:
| (1) | |||
| (2) |
Figure 4 shows the full magnitude-color distribution of SUPERBLINK stars, and the region targeted by our selection. Out of 2,270,481 stars in the SUPERBLINK catalog, our color and magnitude cuts select 10,659 bright red stars. This we use as our initial sample to identify bright M dwarfs.
The sky distribution of the color-selected stars is shown in Figure 5. Separate plots show the stars listed in the TYCHO-2 and HIPPARCOS catalogs (top), stars from the SUPERBLINK catalog which are not listed in TYCHO-2 or HIPPARCOS and have proper motions 150 mas yr-1 (center), and finally stars from the SUPERBLINK catalog not listed in TYCHO-2 or HIPPARCOS and with proper motions 40 mas yr 150 mas yr-1 (bottom). The subsample from the TYCHO-2 and HIPPARCOS catalogs includes 3,319 of the brighter stars, spread over the entire sky. Their distribution shows a slight overdensity in the direction of the Galactic bulge, which is likely due to the larger number of red giants found in that part of the sky. The very high proper motion ( 150 mas yr-1) subsample from SUPERBLINK includes 4,398 stars, and extends uniformly over the entire sky. The moderately high proper motion (40 mas yr 150 mas yr-1) subsample from SUPERBLINK includes 2,941 stars, and clearly suffers from incompleteness in the southern hemisphere; the subsample also displays an overdensity around (,)(80,+20) which is associated with the nearby Hyades cluster.

2.4. Elimination of background giants
Giant stars constitute the main source of contaminant in the sample. Indeed, an excess of red sources in the apparent magnitude range (see Figure 4) points to a modest population of very red M giants in the SUPERBLINK catalog (probably including AGB stars). While these giants are only a tiny fraction of the full SUPERBLINK catalog, they are systematically selected in our initial color/magnitude cut. To eliminate these giants from our sample we apply three selection criteria. The first is based on evaluation of absolute magnitudes, and is used on stars with existing parallax data. The second method identifies giants from their location in a reduced proper motion diagram, and is used for stars for which there are no existing parallax measurements. A third method selects for M dwarfs based on and colors, further eliminating giants and interlopers with bad optical and/or infrared photometry.
2.4.1 Stars with parallax: absolute magnitude cut
We searched the literature to find astrometric parallaxes for stars in our subsample of M dwarf candidates. Parallaxes for 1,622 stars were recovered from the updated version of the Hipparcos catalog (van Leeuwen, 2007). Ground-based astrometric parallaxes were additionally recovered for 10 stars in Jao et al. (2011), 46 stars in Riedel et al. (2010), 15 stars in Khrutskaya et al. (2010), 6 stars in Lepine et al. (2009), 3 stars in Gatewood & Coban (2009), 1 star in Gatewood (2008), 2 stars in Smart et al. (2007), 18 stars in Henry et al. (2006), 4 stars in Costa et al. (2005), 14 stars in Jao et al. (2005), 15 stars in van Altena, Lee, & Hoffleit (1995), 3 stars in Harrington et al. (1993), and 3 stars in Monet et al. (1992). Whenever parallaxes were found for one star in more than one bibliographical source, we adopted the most recent measurement, following the order above. The numbers quoted above refer to incremental additions to the list of parallaxes. In addition, we found parallaxes for 3 stars in the SKY2000 Master Catalog, Version 4 (Myers et al., 2002), and for 315 more from the NStars database222http://nstars.nau.edu/nau_nstars/index.htm. In all cases we only retained parallax measurements with errors 20%. The final tally comprises a total of 2,080 stars with astrometric parallaxes.
From the parallax we calculate absolute visual magnitudes using:
| (3) |
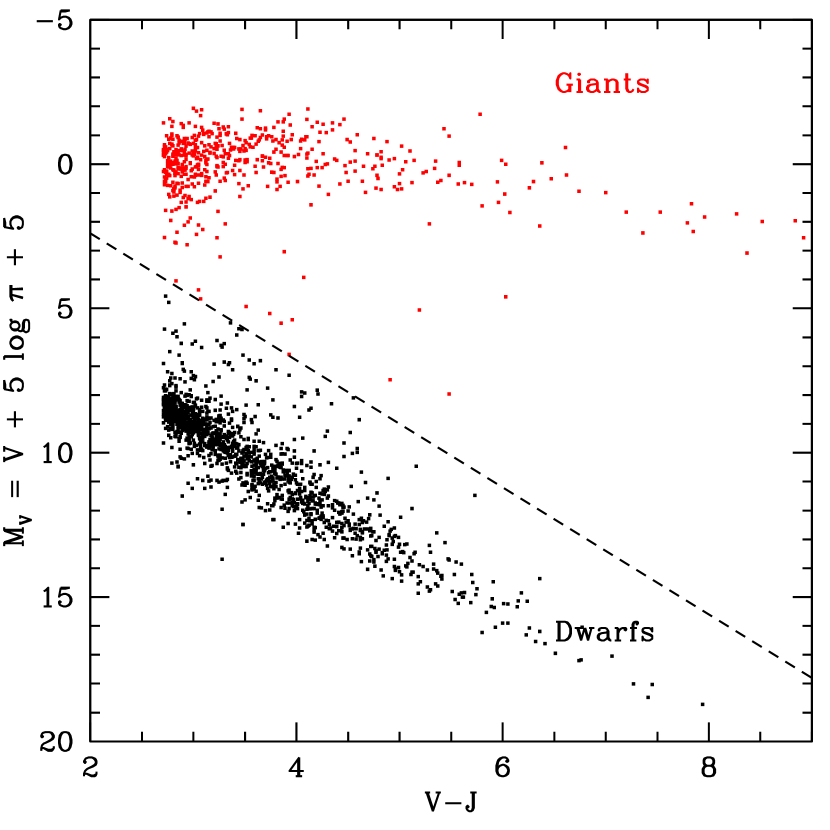
The resulting Hertzsprung-Russel (H-R) diagram is displayed in Figure 6. The stars populate two very distinct loci. The more luminous group includes all M giants and the less luminous group consists of all the M dwarfs. For stars with , the giants are typically 7-8 magnitudes more luminous than the dwarfs. The difference in luminosity only increases at redder colors, with the reddest giants almost 20 magnitudes more luminous than dwarfs of similar color.
From the absolute magnitude and optical-to-infrared color , we define the following criterion for a star to be considered an M dwarf:
| (4) |
This cut identifies 561 stars as most likely to be red giants. The remaining 1,519 objects are identified as M dwarfs. We emphasize that this selection works only for the stars in our initial sample for which astrometric parallax measurements are available. Note that the color-magnitude relationship for the M dwarfs in our sample closely follows:
| (5) |
which implies that we are eliminating stars that are more than 4.5 magnitudes overluminous compared to the average M dwarf of the same color. This cut could possibly eliminate some very young M dwarfs, which tend to be overluminous in an optical-to-infrared color-magnitude diagram (Hawley et al., 1999). Indeed a number of stars with parallaxes appear to be a few magnitudes over-luminous compared to average field stars. However a close examination of Figure 6 indicates that our magnitude cut would, in the worst case, eliminate only a handful of objects that could have been overluminous dwarfs.
2.4.2 Stars without parallax: reduced proper motion cut
For stars without parallax measurements, it is possible to identify giants based on their location in a reduced proper motion diagram. The reduced proper motion is defined as:
| (6) |
a quantity which is analogous to the absolute magnitude (Eq.3) except that the proper motion is substituted for the parallax . The two quantities are mathematically connected, with:
| (7) |
where is the projected motion in the plane of the sky, i.e. the transverse velocity, here expressed in km s-1. This means that the reduced proper motion diagram is basically an H-R diagram where the ordinates are modulated by the individual components of transverse velocities.
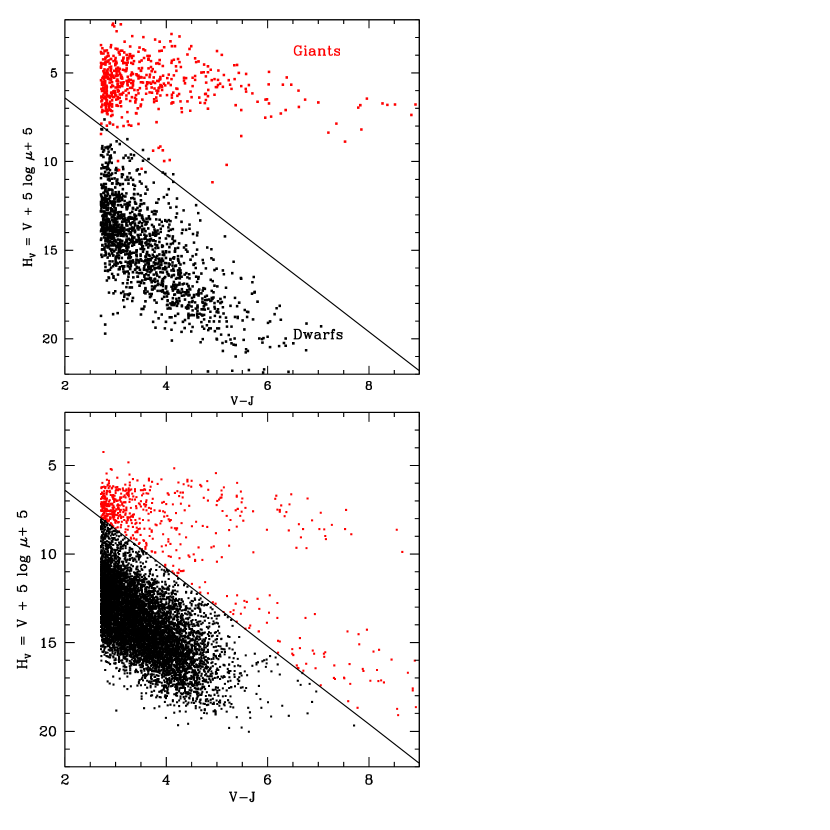
Just as in the H-R diagram, M giants and M dwarfs tend to occupy distinct loci, with the giants all having relatively low values of and clustering in the upper part of the diagram. We demonstrate this in the upper panel of Figure 7, which shows the reduced proper motion diagram of the stars in our sample for which there are parallax measurements. Stars identified as giants based on their parallax are plotted in red, dwarfs are plotted in black. We define a demarcation line which separates stars of the two groups quite well. From this, we postulate that M dwarfs can be separated from giants following this criterion:
| (8) |
Because the reduced proper motion depends on both absolute magnitude and transverse velocity, our selection may eliminate some main sequence M dwarfs if their transverse motion is small. Based on equations 5 and 7, we see that stars on the mean main sequence will be eliminated if their transverse velocity km s-1. Given that the velocity dispersion for stars in the Solar Neighborhood is 40 km s-1 (Nordström et al., 2004), our adopted criterion will exclude relatively few M dwarfs.
Conversely, giants with large transverse velocities will also have large values of which may place them beyond the limit defined in Equation 8. Among the parallax-confirmed giants, we find 4 stars which fall within our defined reduced proper motion cut for M dwarfs. One of the stars has a inferred transverse velocity km s-1 based on its Hipparcos parallax and proper motion. However the other three stars have suspiciously faint absolute magnitudes (4.55.0) for M giants, and may instead be M dwarfs with erroneous (underestimated) parallaxes measurements.
The reduced proper motion diagram of stars with no parallax measurements is shown in the bottom panel of Figure 7. Of the 8,580 stars with proper motions but no parallax measurements, we identify 626 as probable M giants, and those are eliminated from the sample. The remaining 7,954 stars are retained as M dwarf candidates. This leaves 9,473 stars, with or without parallax, on the list of M bright M dwarf candidates.
A significant number of sources are found to have very red colors (5) and reduced proper motion in the range typical for dwarf stars (12) and yet fall above the line we defined as the giant-dwarf boundary. A close examination of their infrared colors shows that most of these stars fall outside the normal range for M dwarfs (see below) and are likely either stars with erroneous (overestimated) V magnitudes, or distant F-G-K stars with large components of reddening. Most of these stars are eliminated after the infrared cuts described below.
2.4.3 Additional color-color cuts
Giant stars are notable for having infrared colors different from the M dwarfs, most apparent in a [(),()] color-color diagram. This has been known since Bessell & Brett (1988). Dwarf stars have comparatively bluer colors than giants. This is due to opacity differences, mostly from molecular bands of H2O, which yield significantly higher -band and -band opacities in M dwarfs (Bessell, Castelli, & Plez, 1998).
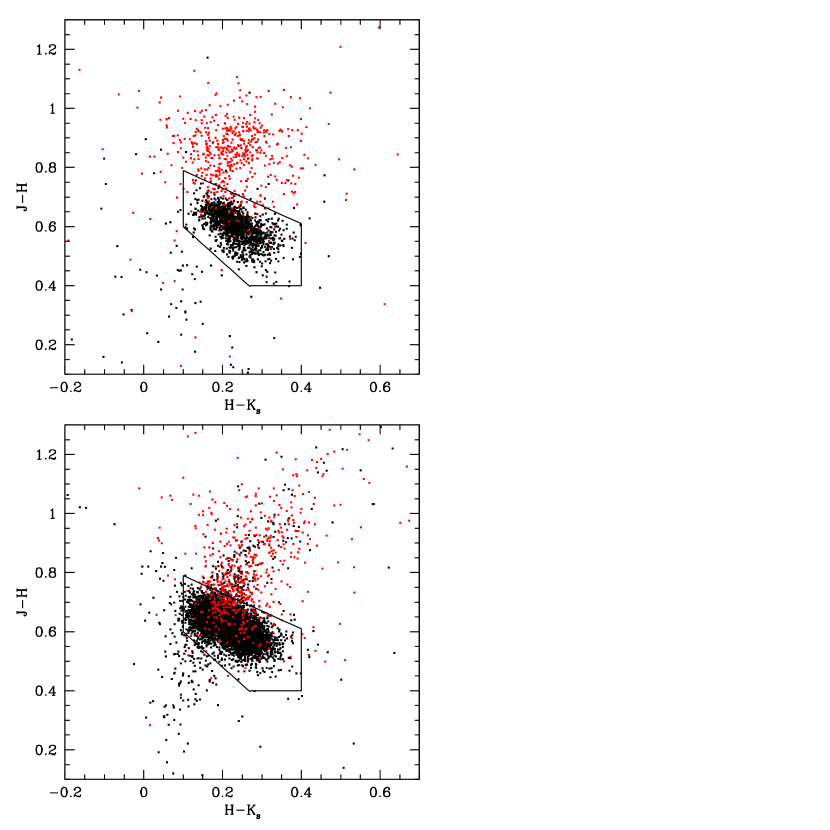
Figure 8 shows the [(),()] color-color distribution for the stars in our initial sample. Stars with parallax measurements are shown in the upper panel, stars without parallax in the lower panel. In both panels, all objects we have identified as probable giants, based on either absolute magnitude (§2.4.1) or reduced proper motion(§2.4.2), are plotted in red. The remaining M dwarf candidates are plotted in black. The giants are clearly segregated from the dwarfs along J-H, although there is a small overlap between the two groups. In fact M dwarfs appear to be confined to a relatively compact region around and . A small number of alleged M dwarfs fall outside the cluster; some have red colors more consistent with the M giants, and indeed they most probably are. Other stars have bluer colors which are more typical of F-G-K stars; we suspect these probably are more massive main sequence stars which made it into our sample probably due to an overestimated photographic magnitude , which would also overestimate the color term, bringing them into the M star subsample. In order to eliminate these leftover misidentified M giants and misclassified F-G-K stars, we further restrict our M dwarf selection to the region in [(),()] diagram bounded by:
| (9) | |||
| (10) | |||
| (11) | |||
| (12) | |||
| (13) |
Among stars with trigonometric parallaxes, we find that 97 of the M dwarf candidates (black dots in Figure 8 upper panel) fall outside the limits of the region defined above. We conclude that these stars likely have significant errors in their estimated optical or infrared magnitudes, and we exclude them from our census of M dwarfs.
Among stars with no parallax measurements identified as probable M dwarfs from the reduced proper motion cut (black dots in Figure 8), we find 487 which fall outside the defined M dwarf boundaries; these stars are eliminated as well. Some of the stars have color consistent with F-G-K main sequence stars (00.2, 0.10.6) and most likely made the initial 2.7 color cut due to an underestimated V magnitude. Other excluded sources have 0.7, and are either giants or distant main sequence stars with large reddening. After these cuts, we are left with a list of 8,889 probable bright M dwarfs, which we retain for building our catalog.
2.4.4 Giant contamination vs M dwarf completeness
Among the giants confirmed through parallax (stars plotted in red in the upper panel of Figure 8) a small number fall within the selection box for M dwarfs. Specifically, 66 of the 561 giants fall within the region defined by Equations 9-13. This means that JHK color cuts alone are susceptible to contamination by background giants. This makes the reduced proper motion selection critical in minimizing giant contamination. Note that only 4 of the 561 giants have reduced proper motions within the limit defined for M dwarfs, which increases our confidence that giant contamination in our catalog is negligible.
The reduced proper motion cut, on the other hand, may be eliminating bona fide M dwarfs, as mentioned in §2.4.2 above. The lower panel in Figure 8 show evidence for this, as 160 of the 626 stars excluded after the reduced proper motion cut (plotted in red) do fall within the M dwarf box. Overall this suggests that our adopted selection criteria places more of an emphasis on avoiding contamination by giants, at the expense of some incompleteness in the M dwarf targets. From the numbers above, we predict that 100 M dwarfs might be missing from our catalog because they fail the reduced proper motion cut.
In addition, we note that stars identified as giants based on parallax data (Figure 8 top panel, red dots) and stars excluded from the reduced proper motion cuts (Figure 8 bottom panel, red dots) show significantly different distributions in / color-color space. One average the parallax giants tend to have bluer colors. We suggest that this is due to the fact that most red giants with 40 mas yr-1 are bright enough to have parallaxes from the Hipparcos catalog, and that the reduced proper motion cut for stars with no parallax essentially serves to exclude stars with large components of reddening, which are expected to have redder colors than the giants.
| SUPERBLINK # | Hipparcos # | TYCHO-2 # | CNS3 name | src11The full version of this table is available in the electronic version of the Astronomical Journal. The first twenty lines of the table are printed here to show the general layout. | ||||||
|---|---|---|---|---|---|---|---|---|---|---|
| (ICRS) | (ICRS) | mas yr-1 | mas yr-1 | mas yr-1 | mas | |||||
| PM I000016943 | 0.028531 | 69.717117 | 0.136 | 0.136 | -0.002 | |||||
| PM I000030802S | 0.087698 | -8.037146 | 0.100 | 0.029 | -0.096 | |||||
| PM I000050533 | 0.144895 | -5.551960 | 0.193 | 0.181 | 0.067 | |||||
| PM I000061829 | TYC 1181-1683-1 | 0.163528 | 18.488850 | 0.387 | 0.335 | 0.195 | ||||
| PM I000071624 | 0.195877 | 16.402805 | 0.125 | 0.013 | -0.125 | |||||
| PM I000073510 | 0.195306 | -35.168343 | 0.316 | 0.312 | -0.048 | |||||
| PM I000076243 | 0.189068 | -62.728802 | 0.199 | 0.166 | -0.110 | |||||
| PM I000121358S | TYC 600-1507-2 | 0.303578 | 13.972055 | 0.147 | 0.025 | 0.144 | 24.91.0 | VA95 | ||
| PM I000144724 | GJ 1293 | 0.371546 | 47.414665 | 0.172 | 0.171 | -0.008 | ||||
| PM I000141656 | HIP 112 | TYC 5838-784-1 | 0.357633 | -16.948410 | 0.393 | 0.299 | -0.255 | 31.44.2 | VL07 | |
| PM I000150814 | 0.399365 | -8.244875 | 0.124 | 0.097 | -0.077 | |||||
| PM I000163258 | 0.408577 | -32.978249 | 0.238 | 0.238 | 0.005 | |||||
| PM I000167613 | 0.408879 | -76.230522 | 0.188 | 0.188 | 0.008 | |||||
| PM I000173528 | 0.433436 | -35.476082 | 0.502 | 0.502 | -0.023 | |||||
| PM I000240440 | 0.613839 | 4.668418 | 0.122 | 0.058 | 0.105 | |||||
| PM I000244601 | HIP 191 | TYC 8022-637-1 | 0.612922 | -46.028893 | 0.194 | 0.192 | -0.022 | 23.04.4 | VL07 | |
| PM I000256324 | 0.639251 | -63.401974 | 0.822 | -0.488 | -0.661 | |||||
| PM I000263821 | 0.667151 | 38.362587 | 0.075 | -0.073 | -0.020 | |||||
| PM I000261123 | 0.654399 | -11.393147 | 0.584 | -0.413 | -0.413 | |||||
| PM I000263919 | 0.654961 | -39.320053 | 0.200 | 0.199 | 0.023 |
3. The catalog
3.1. Source Identifications
Each of the 8,889 stars in our catalog is identified with the standard proper motion star ID used in the SUPERBLINK proper motion survey. These SUPERBLINK names are tabulate in the first column of both Table 1 and Table 2. The first three letters (“PMI”) are the SUPERBLINK catalog identifier. These are followed by 5 digits which relate to the ICRS right ascension of the star in sexagesimal; the first four digits are the hours and minutes of right ascension, the fifth digit is the seconds of right ascension divided by 6 and rounded down to the nearest integer. These are followed by the declination sign and then four digits which replicate the ICRS declination (hours, then minutes) of the source. A disambiguation letter (NSEW) is used when the scheme would leave two stars with the same name, with the letter indicating the relative orientation of the stars in the pair. This scheme follows the recommendation of Eggen (1979) and is the convention now adopted in reporting results from the SUPERBLINK survey, see e.g. Lépine (2005b, 2008).
In Table 1, We additionally provide the names of the stars in both the Hipparcos (column 2) and TYCHO-2 (column 3) catalogs, for all stars which have counterparts in those catalogs. These are provided for convenience because Hipparcos names are now commonly used to refer to very bright stars, and because many exoplanet surveys have adopted the Hipparcos names in designating the host stars and their exoplanets. The TYCHO-2 names perhaps do not enjoy the same popularity, but are useful in identifying objects for which the proper motion is known to higher accuracy. Our list includes a total of 977 Hipparcos and 1,859 TYCHO-2 stars. Some 779 entries have counterparts in both the Hipparcos and TYCHO-2 catalogs, but 192 stars have Hipparcos counterparts only, while 1,074 stars are only listed in TYCHO-2.
In addition, we identify by their catalog names all the stars listed in the Third Catalog of Nearby Stars (Gliese & Jahreiss, 1991) or CNS3 (column 4). These are also convenient because CNS3 names have been widely adopted by the exoplanet community to designate nearby stars. The CNS3 counterparts are found after cross-correlation with the catalog of revised positions by Stauffer et al. (2011) which lists 4,106 objects. A total of 1,529 stars from our catalog of bright M dwarfs are thus matched to their CNS3 counterpart.
Stars with CNS3 counterparts include most of the very nearest systems. However, the CNS3 does suffer from a significant kinematic bias because it is largely based on the proper motion catalogs of Luyten, particularly the LHS catalog which has a relatively high proper motion limit 450 mas yr-1. As a result, many stars on our list which we identify as very nearby objects do not have CNS3 names; these are typically stars with relatively small ( mas yr-1) proper motions.
We note that of the stars in our catalog (6,003 entries) have no counterpart in either the Hipparcos, TYCHO-2, or CNS3 catalog. Use of the PM designations for these stars would be convenient, especially given that the PM name indicates the location of the star on the sky.
3.2. Astrometric data
3.2.1 Coordinates
Coordinates in the table are tabulated in columns 5 and 6. Right ascension () and declination () are listed in the ICRS system, and quoted for the 2000.0 epoch. This means that current positions must be extrapolated using the tabulated proper motions. For stars listed in the Hipparcos catalog, we have extrapolated the positions to the 2000.0 epoch, from the values listed in van Leeuwen (2007) which were listed for epoch 1991.25. For all other stars, the 2000.0 coordinates are based on the position of their 2MASS counterparts as listed in Cutri et al. (2003) and extrapolated to the 2000.0 epoch from the epoch of the 2MASS observations. The positions are typically accurate to 0.8, which are the quoted 2MASS catalog errors on the absolute astrometry; Proper motion errors have little effect on the accuracy of the extrapolated positions because of the proximity of the 2MASS survey epoch to the millennium year ( years).
3.2.2 Proper motions
The total proper motion of the stars are tabulated in column 7 and listed in seconds of arc per year. The vector components of the proper motion in the directions of R.A. and Decl. () are tabulated in columns 8 and 9. Both components are given in seconds of arc per year, following the SUPERBLINK convention. Note that is listed in seconds of arc per year, not seconds of time per year, by which we mean that .
These proper motions are from three separate sources. Stars with Hipparcos counterparts are listed with their proper motion from the Hipparcos catalog (van Leeuwen, 2007). Stars not in the Hipparcos catalog but with counterparts in the TYCHO-2 catalog are listed with their proper motion from TYCHO-2 (Høg et al., 2000). The Hipparcos and TYCHO-2 proper motions are typically accurate to 0.5-2.0 mas yr-1. For stars not listed in either the HIPPARCOS or TYCHO-2, the proper motions listed are those measured in the SUPERBLINK proper motion survey. Those proper motions are based on a re-analysis of the Digitized Sky Surveys images, as described in detail in Lépine & Shara (2005); these proper motions have a typical precision of 8 mas yr-1. One can determine the source of the proper motion by checking whether the star has a Hipparcos or TYCHO-2 name.
3.2.3 Parallaxes
Astrometric parallaxes are recovered from the literature for 1,422 of the M dwarfs in our catalog. See section 2.4.1 for the list of papers and catalogs that were searched to recover the parallaxes. All values are listed in column 10 whenever available, otherwise the field is left blank. A flag is added in column 11 to indicate the source of the parallax, with the key provided in the table footnote. In all cases, measurement errors as reported in the relevant source, are noted in column 10.
| SUPERBLINK # | X-ray22Source of the astrometric parallax: Co05 = Costa et al. (2005), Ga08 = Gatewood (2008), Ga09 = Gatewood & Coban (2009), Ha93 = Harrington et al. (1993), He06 = Henry et al. (2006), Ja05 = Jao et al. (2005), Ja11 = Jao et al. (2011), Kh10 = Khrutskaya et al. (2010), Le09 = Lepine et al. (2009), Mo92 = Monet et al. (1992), My02 = Myers et al. (2002), Ri10 = Riedel et al. (2010), Sm07 = Smart et al. (2007), VA95 = van Altena, Lee, & Hoffleit (1995), VL07 = van Leeuwen (2007), NSTA = NStars database (http://nstars.nau.edu/nau_nstars/index.htm) | FUV33Far-UV and near-UV magnitudes from the GALEX 5th data release. | NUV | BT44BT and VT magnitudes from the TYCHO-2 catalog. | VT | BJ55Photographic BJ (blue IIIa J), RF (red IIIa F), and infrared IN (infrared IV N) magnitudes from USNO-B1.0 catalog (Monet et al., 2003). | RF | IN | J66Infrared J, H, and Ks magnitudes from the 2MASS catalog (Cutri et al., 2003). | H | Ks | V77Effective V magnitude as defined in Lépine & Shara (2005). | VJ | 88Photometric parallax based on the (,) relationship defined in this paper. | subtype99Estimated spectral subtypes based on the (ST,) relationship defined in this paper. |
|---|---|---|---|---|---|---|---|---|---|---|---|---|---|---|---|
| cts s-1 | mag | mag | mag | mag | mag | mag | mag | mag | mag | mag | mag | mag | mas | ||
| PM I000016943 | 0.0461 | 14.3 | 12.6 | 10.8 | 9.70 | 9.12 | 8.84 | 13.52 | 3.82 | 33.109.9 | m3 | ||||
| PM I000030802S | 13.9 | 11.8 | 9.12 | 8.47 | 8.27 | 12.93 | 3.81 | 42.912.9 | m3 | ||||||
| PM I000050533 | 13.2 | 11.2 | 10.2 | 9.00 | 8.39 | 8.17 | 12.28 | 3.28 | 31.309.4 | m1 | |||||
| PM I000061829 | 12.91 | 11.28 | 11.9 | 10.3 | 9.5 | 8.44 | 7.79 | 7.64 | 11.28 | 2.84 | 30.709.2 | k7 | |||
| PM I000071624 | 21.02 | 14.0 | 11.9 | 9.32 | 8.68 | 8.46 | 13.03 | 3.71 | 16.104.8 | m0 | |||||
| PM I000073510 | 13.3 | 11.1 | 10.2 | 9.12 | 8.48 | 8.28 | 12.29 | 3.17 | 27.408.2 | m1 | |||||
| PM I000076243 | 13.7 | 11.7 | 11.0 | 9.89 | 9.23 | 9.07 | 12.78 | 2.89 | 36.510.9 | m2 | |||||
| PM I000121358S | 19.85 | 13.67 | 11.12 | 8.36 | 7.71 | 7.53 | 11.12 | 2.76 | 30.609.2 | k7 | |||||
| PM I000144724 | 13.8 | 11.4 | 10.6 | 9.67 | 9.02 | 8.83 | 12.70 | 3.03 | 35.410.6 | k7 | |||||
| PM I000141656 | 12.14 | 10.76 | 11.5 | 9.8 | 8.9 | 8.02 | 7.41 | 7.22 | 10.76 | 2.74 | 19.305.8 | m0 | |||
| PM I000150814 | 14.4 | 11.7 | 9.79 | 9.12 | 8.91 | 13.16 | 3.37 | 23.106.9 | m1 | ||||||
| PM I000163258 | 13.4 | 11.6 | 10.7 | 9.77 | 9.14 | 8.94 | 12.57 | 2.80 | 16.304.9 | k7 | |||||
| PM I000167613 | 14.1 | 12.6 | 10.6 | 9.48 | 8.89 | 8.60 | 13.41 | 3.93 | 39.511.9 | m3 | |||||
| PM I000173528 | 14.99 | 13.36 | 14.5 | 12.1 | 11.0 | 9.82 | 9.19 | 8.93 | 13.36 | 3.54 | 25.707.7 | m2 | |||
| PM I000240440 | 21.96 | 13.6 | 11.2 | 9.9 | 9.19 | 8.61 | 8.45 | 12.50 | 3.31 | 28.208.5 | m1 | ||||
| PM I000244601 | 13.92 | 12.43 | 9.18 | 8.52 | 8.34 | 12.43 | 3.25 | 29.308.8 | m1 | ||||||
| PM I000256324 | 14.2 | 12.1 | 10.7 | 9.32 | 8.71 | 8.53 | 13.23 | 3.91 | 41.912.6 | m3 | |||||
| PM I000263821 | 21.97 | 20.15 | 14.8 | 13.1 | 10.6 | 9.71 | 9.20 | 8.91 | 14.02 | 4.31 | 20.306.1 | m1 | |||
| PM I000261123 | 14.74 | 13.09 | 9.86 | 9.24 | 9.03 | 13.09 | 3.23 | 17.105.1 | m0 | ||||||
| PM I000263919 | 14.0 | 11.4 | 10.9 | 9.84 | 9.19 | 9.00 | 12.80 | 2.96 | 45.313.6 | m4 |
3.3. Photometric data
Table 2 lists photometric data for the stars, along with photometric parallaxes and estimated spectral types, both based on the photometric measurements. SUPERBLINK stars names are repeated in column 1 of Table 2, to facilitate the cross-identification with Table 1, although the number of lines are the same.
3.3.1 X-ray
We have cross-correlated our list of bright M dwarfs with both the ROSAT All-Sky Bright Source Catalog (Voges et al., 1999) and the ROSAT All-Sky Survey Faint Source Catalog (Voges et al., 2000). We used a search radius of 15″, which is on the order of the astrometric precision of the ROSAT catalog. Our search identified 1,065 stars with X-ray counterparts. Flux values in counts s-1 are listed in column 2.
X-ray fluxes can be useful in identifying young stars in the catalog. M dwarfs can be X-ray emitters if they have significant chromospheric activity. High activity levels are typically linked to rapid rotation, which in M dwarfs is indicative of either spin-orbit coupling in a close binary (Silvestri et al., 2006) or of young age (Silvestri, Hawley, & Oswalt, 2005). It is likely that the youngest M dwarfs in our catalog are to be found among the subsample of objects with significant X-ray emission. Follow-up observations of X-ray bright M dwarfs has been successful in identifying scores of low-mass members to young moving groups (Gaidos, 1998; Zuckerman et al., 2001; Montes et al., 2001; Torres et al., 2006).
3.3.2 Ultra-violet
The catalog was cross-correlated against the fifth data release (DR5) of the GALEX mission. Using a search radius, we found GALEX counterparts for 3,905 of the 8,889 stars on our list. The and magnitudes are listed in columns 3 and 4. Some 762 objects have counterparts in both the and , while 3,115 have counterparts only in the , leaving 28 stars with a counterpart in the only. These ultra-violet (UV) magnitudes can also be used to identify young stars. A high UV luminosity is associated with activity in M dwarfs, and can be used as an age diagnostic (Shkolnik et al., 2011).
3.3.3 TYCHO-2 blue and visual magnitudes
We include optical magnitudes and as they are listed in the HIPPARCOS and TYCHO-2 catalogs. These are included in columns 5 and 6 respectively. These are available only for stars with counterparts in those catalogs. The and magnitudes are useful because they are generally more accurate (0.1 mag or better) than the photographic magnitudes which we list for all the stars.
3.3.4 Optical photographic
Optical magnitudes are obtained from the USNO-B1.0 catalog of Monet et al. (2003), which is based on scans of historical photographic surveys. The blue magnitudes are extracted mostly from scans of plates from the Palomar Sky Surveys (POSS-I, POSS-II) and the Southern ESO Schmidt (SERC) Survey. Red magnitudes are extracted from scans of plates from POSS-I and POSS-II and also from the Anglo-Australian Observatory red survey (AAO-red). Photographic infrared magnitudes are extracted from plates from POSS-II and SERC. Cross-correlation with the USNO-B1.0 catalog is performed as part of the SUPERBLINK quality control procedure, and all ambiguous cases are verified by visual examination using overlays of the USNO-B1.0 sources on the DSS scans. All the recovered photographic magnitudes are listed in columns 7 (blue), 8 (red) and 9 (infrared).
Since the optical , , , magnitudes are based on scans of photographic plates, they are generally not as reliable as magnitudes measured on electronic detectors, such as those from 2MASS and GALEX. Photographic magnitudes are typically accurate to only mag.
3.3.5 Infrared
As part of the quality control process, all the stars in the SUPERBLINK proper motion survey have their counterparts identified in the 2MASS catalog of Cutri et al. (2003). As described in §3.2.1 above, the 2MASS counterparts provide the absolute astrometry for SUPERBLINK objects. Because of the color restriction of Equation 1, every object in our catalog is required to have a counterpart in 2MASS. The corresponding infrared , , and magnitudes are listed in columns 10, 11, and 12, respectively. The magnitudes are generally accurate to 0.08 mag, though one should refer to the 2MASS documentation for a detailed discussion of magnitude errors and uncertainties333http://www.ipac.caltech.edu/2mass/releases/allsky/doc/explsup.html. Very bright stars (), in particular, are saturated in 2MASS and have larger photometric uncertainties.
3.3.6 Effective visual magnitude
For convenience, we calculate an effective visual magnitude , which for bright stars is the visual magnitude quoted in the HIPPARCOS or TYCHO-2 catalogs. For faint stars, it is a combination of the photographic , , and magnitudes, following the algorithm described in Lépine & Shara (2005) where this effective visual magnitude is labeled as . In this paper, we use the shorter form for convenience, but it should be understood that all the mentions of actually refer to this effective visual magnitude . All values are listed in column 13.

3.4. Photometric distances
Photometric distances are estimated for all the stars based on the color magnitude relationship for M dwarfs calibrated in Lépine (2005a). For stars with the relationship is:
| (14) |
Photometric parallaxes are then calculated based on the estimated and the apparent visual magnitude . Values are listed in column 14.
As discussed in Lépine (2005a), the relationship has a scatter of 0.7 mag about the mean, which typically results in photometric distances with errors of . In Figure 9, we compare the photometric distances to triangulated distances, for stars with available parallaxes. Of the 1,422 M dwarfs with parallaxes, some 1,206 stars have photometric distance estimates within of the astrometric distance, but only 772 have photometric distances that are accurate to . There is also a significant number of outliers which could be unrecognized giants, young field stars, or unresolved doubles, all of which would have distances underestimated by photometry. Metal-poor stars (M subdwarfs) on the other hand would have their distances overestimated by photometry. Spectroscopic follow-up would be required to identify all such objects.
Thus, while photometric distances are conveniently provided here for all the stars, one should bear in mind that these are mainly for guidance purposes, as these distances carry large uncertainties in many cases. Astrometric parallaxes (listed in Table 1) should be preferred for stars for which they are available, and should be measured for the remaining objects in our catalog.

3.5. Estimated spectral type
For all the stars, we provide an estimated spectral subtype which is based on the relationship between color and the spectral subtype (see Fig. 4). We use this simple two-component linear relationship to estimate the subtype :
| (15) |
after which the values are rounded up to the nearest integer. We use lowercase letters (k,m) instead of the usual uppercase (K,M) to indicate that the spectral type is only an estimate; a value of yields an estimated subtype of k7. A histogram of the estimated subtype distribution is shown in Figure 10, where it becomes clear that our magnitude-limited catalog of bright M dwarfs is biased toward stars of earlier subtypes. The initial mass function is expected to peak at around 0.3 M⊙ or spectral subtype M3-M4 (Kroupa et al., 2002), so our incompleteness starts at around M0 and becomes severe by M5.
These subtypes are tabulated in column 15 and may be used as a guide in selecting targets of interest. Some of the stars on the list, in particular stars listed in the CNS3, already have published literature about them, and the interested user would be advised to verify the existence of formal spectral classification(s). We are currently conducting a spectroscopic follow-up survey to obtain formal spectral types for the brightest stars in our catalog, and intend to provide formal spectral classifications for these in the near future.
4. Extent and completeness of the catalog

4.1. Sky distribution
Distribution on the sky of all the stars in our catalog is displayed in Figure 11 in a Galls-Peter equal-area projection. To emphasize differences between the brighter and fainter stars in our catalog, we display the distribution in two panels, with one showing only stars with visual magnitudes (upper panel) and the other showing stars with visual magnitudes . The separation roughly corresponds to the magnitude limit of the TYCHO-2 catalog. Of the 1,993 stars in the brighter sample, 1,614 are listed in either the TYCHO-2 or HIPPARCOS catalog. The fainter sample, on the other hand, contains only 437 HIPPARCOS and TYCHO-2 stars out of a total of 6,896 objects.
The distribution of the brightest () M dwarfs appears relatively uniform over the sky, except for an overdensity at low Galactic latitude in the general direction of the Galactic center (). This overdensity is likely due to contamination by background giants in dense fields. Since our catalog is dependent on the HIPPARCOS and TYCHO-2 catalogs at the bright end, errors in proper motion measurements due to field crowding also possibly result in stars having overestimated proper motions, which would in turn fall within the reduced proper motion range of M dwarfs. Close examination of a number of stars at low Galactic latitudes indeed raises doubt about the accuracy of the proper motion quoted in HIPPARCOS and TYCHO-2 in at least a few cases.
The distribution of fainter () M dwarfs, on the other hand, shows a net deficit of objects in the southern sky, especially for . As discussed in §2.3 this is due to the limited coverage of SUPERBLINK in the south, where the survey is only complete for proper motions mas yr-1, compared to mas yr-1 in the north. The distribution, however, does not show any overdensity/deficit of stars at low Galactic latitudes, which suggests both a high completeness and low contamination from background giants. This demonstrates the high efficiency and quality controls of the SUPERBLINK survey in high density fields.


4.2. Kinematic bias
We illustrate in Figure 12 the effects of kinematic bias and magnitude limit in our catalog. The upper panels show the estimated absolute magnitudes as a function of distance, while the bottom panels show the transverse motions (i.e. projected motions in the plane of the sky) as a function of distance, for all the stars in our catalog. The astrometric distances are used when available, otherwise we use the photometric distances as calculated in §3.4.
One cannot speak of incompleteness due to the magnitude limit, since the magnitude limit was imposed as a primary constraint to the catalog. Figure 12 however illustrates the effects of this magnitude limit in restricting the distance range of the stars in the catalog. All the M dwarfs with populate the nearest 75 parsecs. The limiting distance is also a function of absolute magnitude thus spectral subtype. Late-type M dwarfs, which have lower absolute magnitudes , have a much shorter distance limit in our catalog, which explains the strong deficit of stars with subtypes later than M4 (see Figure 10).
The main source of incompleteness in our magnitude-limited catalog is kinematic bias. Because all of our stars are selected among sources with proper motions mas yr-1, nearby stars with low components of their transverse motion (i.e. projected motion in the plane of the sky) may be missed. Nearby stars can have low values of either because of a low intrinsic motion relative to the Sun, or because their motion vector is nearly perpendicular to the plane of the sky. For example, a star at 50 parsecs from the Sun with mas yr-1 has a transverse velocity 9.48 km s-1, which will occur with a probability of about 10% for stars in the Solar neighborhood (see §2.2 and Fig.1).
The SUPERBLINK catalog currently has a higher proper motion limit ( mas yr-1) in large swaths of the southern sky, which makes our census much more prone to a kinematic bias. This explains the deficit of sources in the Southern sky (Fig.11). This is only mitigated at the bright end because of our use of the Hipparcos and TYCHO-2 catalogs.
To estimate the overall completeness of our catalog, we proceed in two steps. First we use Monte-Caro simulations to estimate the completeness of the northern sky census, which we assume to suffer only from kinematic bias due to the mas yr-1 proper motion limit. Then we assume that the local distribution of field stars is isotropic in the vicinity of the Sun, and thus infer how many stars are missing from the southern sky census, i.e. assuming that both the north and south hemisphere should have the same number of bright M dwarfs.
We first assume that the transverse velocity is independent of the distance for stars in the Solar Neighborhood, and assume a statistical distribution of the form . We extract from our data the statistical distributions and from appropriate cuts in and . For , we consider only stars in the northern sky with transverse velocities km s-1; this boundary is illustrated in Figure 12 (lower-left panel), which shows that the stars that satisfy this constraint do not suffer from the kinematic bias, because all the stars in our catalog which have km s-1 also have proper motions mas yr-1. The normalized distribution function is shown in Figure 13 (top panel). For , we consider only stars with distances parsecs; again the boundary is illustrated in Figure 12, and shows that these very nearby stars suffer from minimal kinematic bias, because stars with proper motions mas yr-1 (and missing from the census) can only have km s-1, which excludes very few stars. The normalized distribution function is shown in Figure 13 (bottom panel) where the limit of completeness ( km s-1) is shown for reference. Given the sharp drop in for transverse motions km s-1, it is safe to assume that the sample of parsecs stars is essentially complete.
We perform Monte-Carlo simulations based on the statistical distribution and to estimate the probability that an M dwarf with will be detected in our survey. We thus estimate that our census of the northern sky has a completeness of %. This means that the 5,361 stars in the northern sky sample are most likely drawn from a hypothetical sample of 5,84018 stars. The stars missing due to the kinematic bias are expected to have proper motions mas yr-1.
The above analysis assumes that the SUPERBLINK survey is complete within the proper motion range and magnitude limit. If the survey itself is incomplete, then the number of missing objects would be larger. The completeness of the SUPERBLINK survey generally depends magnitude and field density. However in the magnitude range under consideration (815) a completeness test based on the fraction of TYCHO-2 stars recovered by SUPERBLINK and the fraction of SUPERBLINK stars listed in TYCHO-2, suggests that the combined TYCHO-2/SUPERBLINK catalog has a completeness (Lépine & Shara, 2005). If we factor in the possibility that 2% stars in that magnitude range have escaped detection by both TYCHO-2 and SUPERBLINK, this would bring the total number of hypothetical bright M dwarfs in the northern sky to 5,950 stars.
4.3. Southern sky incompleteness
Our southern sky census is significantly less complete than the northern census. While our catalog has 5,361 stars north of the celestial equator, it only has 3,528 in the south. The main reason for the incompleteness is the limited coverage of the SUPERBLINK proper motion survey in the south. The survey is complete to mas yr-1 for the entire northern sky, but reaches that limit only over a fraction of the south, mainly in the declination range (see Fig.11) South of , the survey is only complete to mas yr-1, but reaches to mas yr-1 in some areas. The incompleteness of the SUPERBLINK survey is mitigated by the inclusion of the TYCHO-2 catalog, which is mostly limited by magnitude and actually includes stars with proper motions smaller than the SUPERBLINK limit of 40 mas yr-1. However the magnitude limit of the TYCHO-2 catalog, 12.0, is too bright to include all but a fraction of the M dwarfs in the magnitude range of interest ().
Under the assumption that the northern sky census is fully representative of the entire volume around the Sun, i.e. assuming the M dwarf distribution to be isotropic in the Solar neighborhood, we use the results from the Monte-Carlo simulation above and estimate that the southern-sky census of M dwarfs brighter than should also include 5,950 stars, for a total of 11,900 M dwarfs over the entire sky. Given that our southern sample includes only 3,528 stars, we thus conclude that we are currently missing 2,420 stars in the southern sky. In other words our southern sky census has a completeness of only 59.3%.
5. Discussion and conclusions
The need to assemble a comprehensive list of bright M dwarfs over the entire sky is primarily motivated by the search for extra-solar planets. Based on current techniques, M dwarfs are the most promising stars around which to look for Earth-mass planet in a habitable zone. Radial velocity measurements are most sensitive to the reflex motion from planets in close orbits around their parent stars, or to planets orbiting low-mass stars; for planets in habitable zones, this favors M dwarfs, whose zone is closer in, and whose masses are relatively low. Transit surveys have a higher chance of detecting planets in close orbits, and are more sensitive to planets orbiting smaller stars; this likewise favors M dwarfs as the most promising targets. The main caveat is that both radial velocity measurements and transit monitoring are most efficient for relatively bright stars. With current observational resources, radial-velocity monitoring can realistically be performed on stars with absolute magnitudes , and near-term developments only promise to increase the depth of surveys by one or two magnitudes, most notably by observing at infrared wavelengths where M dwarfs are noticeably brighter. M dwarfs with apparent infrared magnitudes will soon be within range of radial velocity surveys.
The motivation of the SUPERBLINK proper motion survey is to identify the largest possible number of hydrogen-burning objects up to at least 100 parsecs of the Sun. With a low proper motion limit of mas yr-1 and astrometric accuracy mas yr-1, the catalog suffers from minimal kinematic bias to a distance of 50-60 parsecs, which is the range over which one would expect to find M dwarfs with . The current SUPERBLINK catalog is complete over the entire northern sky, but the southern sky survey is still in progress. At this time, the catalog has a proper motion limit mas yr-1 in the declination range ; at southern declinations the proper motion limit is now mas yr-1, except for relatively bright stars () for which the catalog extends to mas yr-1 because of the inclusion of data from the TYCHO-2 and HIPPARCOS catalogs.
Our search of the current version of the SUPERBLINK catalog has identified 8,889 bright M dwarfs, of which 5,361 are in the northern sky and 3,528 in the south. The lower number of stars catalogued in the south reflects the limited extent of our proper motion survey in the south. Our estimate of the kinematic bias suggests that our northern census is % complete. From this we infer that there should be M dwarfs with magnitudes over the entire sky. Our catalog currently lists % of the entire set. We recommend that these stars be observed by radial-velocity monitoring programs with the highest priority. In addition to exoplanet surveys, completing the census of the Solar neighborhood is important to constrain the stellar density in the Galaxy, and to determine the distribution of stellar properties. Our catalog includes many stars which are identified here for the first time as members of the Solar neighborhood. In particular, most of the sources are not listed in the Catalog of Nearby Stars.
The key to completing the census of bright M dwarfs in the south is to obtain a proper motion catalog with a lower proper motion limit, currently limited to mas yr-1 south of . We are currently working on an extension of the SUPERBLINK proper motion survey, which will extend the limits to mas yr-1 to , and to mas yr-1 in the range. We predict that extended surveys will identify an additional bright M dwarfs, if a proper motion limit mas yr-1 can be reached over the entire sky. A revised catalog will be produced as the survey reaches completion.
At this time we are conducting a systematic spectroscopic follow-up survey of the brightest stars in this catalog, and searching the literature for previous determinations of spectral subtypes. Results from these investigations will be provided in upcoming papers by our team.
References
- Allard & Hauschildt (1995) Allard, F., & Hauschildt, P. H. 1995, ApJ, 445, 433
- Apps et al. (2010) Apps, et al. 2010, PASP, 122, 156
- Batalha et al. (2010) Batalha, N., et al. 2010, ApJ, 713, L109
- Beichman et al. (2010) Beichman, et al. 2010, PASP, 122, 162
- Bessell & Brett (1988) Bessell, M. S., & Brett, J. M. 1988, PASP, 100, 1134
- Bessell, Castelli, & Plez (1998) Bessell, M. S., & Castelli, F., & Plez, B. 1998, A&A, 333, 231
- Biller (2007) Biller, B. A. 2007, Ph.D. Thesis
- Bochanski et al. (2005) Bochanski, J. J., et al. 2005, AJ, 130, 1871
- Bonfils et al. (2005) Bonfils, X., et al. 2005, A&A, 442, 635
- Borucki et al. (2011a) Borucki, W. J., et al. 2011a, ApJ, 728, 117
- Borucki et al. (2011b) Borucki, W. J., et al. 2011b, ApJ, 736, 19
- Browning et al. (2010) Browning, M. K., et al. 2010, AJ, 139, 504
- Chauvin et al. (2006) Chauvin, G., et al. 2006, A&A, 456, 1165
- Charbonneau et al. (2009) Charbonneau, D., et al. 2009, Nature, 462, 891
- Costa et al. (2005) Costa, E., et al. 2005, AJ, 130, 337
- Cutri et al. (2003) Cutri, R. M., et al. 2003, The 2MASS All-Sky Catalog of Point Sources University of Massachusetts and Infrared Processing and Analysis Center (IPAC/California Institute of Technology)
- Delfosse et al. (1999) Delfosse, et al. 1999, A&A,
- Eggen (1979) Eggen, O. J. 1979, ApJS, 39, 89
- Fernandez et al. (2009) Fernandez, et al. 2009, ApJ, 701, 764
- Fischer, & Valenti (2005) Fischer, D. A., & Valenti, J. 2005, ApJ, 622, 1102
- Fortney et al. (2008) Fortney, J. J., et al. 2008, ApJ, 683, 1104
- Fortney & Nettelman (2010) Fortney, J. J., & Nettelman, N. 2010, Space Sci. Rev., 152, 423
- Gaidos (1998) Gaidos, E. 1998,
- Gaidos et al. (2007) Gaidos, E., et al. 2007, Science, 318, 210
- Gatewood (2008) Gatewood, G. 2008, AJ, 136, 452
- Gatewood & Coban (2009) Gatewood, G., & Coban, L. 2009, AJ, 137, 402
- Gonzalez (1997) Gonzalez, G. 1997, MNRAS, 285, 403
- Gliese & Jahreiss (1991) Gliese, & Jahreiss, H. 1991, Preliminary Version of the Third Catalogue of Nearby Stars
- Harrington et al. (1993) Harrington, R. S., et al. 1993, AJ, 105, 1571
- Hawley et al. (1999) Hawley, S., et al. 1999, AJ, 117, 1341
- Heinze et al. (2010) Heinze, A. N., Hinz, P. M., Kenworthy, M., Meyer, M., Sivanandam, S., & Miller, D. 2010, ApJ, 714, 1570
- Henry et al. (2006) Henry, T. J., et al. 2006, AJ, 132, 2360
- Høg et al. (2000) Høg, E., et al., A&A, 355, L27
- Ida & Lin (2004) Ida, S., & Lin, D. N. C. 2004, ApJ, 604, 388
- Irwin et al. (2009) Irwin, J. et al. 2009, ApJ, 701, 1436
- Irwin et al. (2010) Irwin, J. et al. 2010, ApJ, 718, 1353
- Isaacson & Fischer (2011) Isaacson, H., & Fischer, D. A. 2011, in press
- Jao et al. (2005) Jao, W.-C., et al. 2005, AJ, 129, 1954
- Jao et al. (2011) Jao, W.-C., et al. 2011, AJ, 141,117
- Johnson et al. (2007) Johnson, J. A., et al. 2007,
- Johnson & Apps (2009) Johnson, J. A., & Apps, K. 2009, ApJ, 699, 933
- Johnson et al. (2010a) Johnson, J. A., et al. 2010, PASP, 122, 905
- Johnson et al. (2010b) Johnson, J. A., et al. 2010b, PASP, 122, 149
- Kasper et al. (2007) Kasper, M., Apai, D., Janson, M, & Brandner, W. 2007, A&A, 472, 321
- Kasting, Whitmire, & Reynolds (1993) Kasting, J. F., Whitmire, D. P., & Reynolds, R. T. 1993, Icarus, 101, 108
- Khrutskaya et al. (2010) Khrutskaya, E. V., Izmailov, I. S., & Khovrichev, M. Yu. 2010, Astronomy Letters, 35, 576
- Kiraga & Stepien (2007) Kiraga, M., & Stepien, K. 2007, AcA, 57, 149
- Kirkpatrick et al. (1991) Kirkpatrick, D., et al., ApJ, 402, 643
- Kroupa et al. (2002) Kroupa, et al. 2002, Science, 295, 82
- Lafrenière et al. (2007) Lafrenière, D., et al. 2007, ApJ, 670, 1367
- Lépine, Shara, & Rich (2002) Lépine, S. Shara, M. M., & Rich, R. M. 2002, AJ, 124, 1190
- Lépine, Shara, & Rich (2003) Lépine, S. Shara, M. M., & Rich, R. M. 2003, AJ, 126, 921
- Lépine (2005a) Lépine, S. 2005a, AJ, 130, 1247
- Lépine (2005b) Lépine, S. 2005b, AJ, 129, 1483
- Lépine & Shara (2005) Lépine, S., & Shara, M. M. 2005, AJ, 129, 1483
- Lépine (2008) Lépine, S. 2008, AJ, 135, 2177
- Lepine et al. (2009) Lépine, S., Thorstensen, J. R., Shara, M. M., & Rich, R. M. 2009, AJ, 137, 4109
- Liu et al. (2010) Liu, M. C., et al. 2010, SPIE, 7736, 53
- Lowrance et al. (2005) Lowrance, P. J., et al. 2005, AJ, 130, 1845
- Luyten (1979a) Luyten W. J. 1979, LHS Catalogue: a catalogue of stars with proper motions exceeding 0.5” annually, University of Minnesota, Minneapolis
- Luyten (1979b) Luyten W. J. 1979, New Luyten Catalogue of stars with proper motions larger than two tenths of an arcsecond (NLTT), University of Minnesota, Minneapolis
- Monet et al. (1992) Monet, D. G., et al. 1992, AJ, 103, 638
- Monet et al. (2003) Monet, D. G., et al. 2003, AJ, 125, 984
- Montes et al. (2001) Montes, et al. 2001, MNRAS, 328, 45
- Mayor et al. (2009) Mayor, M., et al. 2009, A&A, 507, 487
- Myers et al. (2002) Myers, J. R., et al. 2002, SKY2000 Master Catalog, Version 4, Goddard Space Flight Center, Flight Dynamics Division
- Nielsen & Close (2010) Nielsen, E. L., & Close, L. M. 2010, ApJ, 717, 878
- Nordström et al. (2004) Nordström, B., et al. 2004, A&A, 418, 989
- Nutzman & Charbonneau (2008) Nutzman, P., & Charbonneau, D. 2008, PASP, 120, 317
- Hauschildt et al. (1997) Hauschildt, P., et al. 1997, ApJ, 488, 428
- Perryman et al. (1997) Perryman, M. A. C. & ESA 1997, The Hipparcos and Tycho catalogues. Astrometric and photometric star catalogues derived from the ESA Hipparcos Space Astrometry Mission, Publisher: Noordwijk, Netherlands: ESA Publications Division
- Reiners & Basri (2008) Reiners, A., & Basri, G. 2008, ApJ, 684, 1390
- Reiners & Basri (2010) Reiners, A., & Basri, G. 2010, ApJ, 710, 924
- Riedel et al. (2010) Riedel, A. R., et al. 2010, AJ, 140, 897
- Rojas-Ayala et al. (2010) Rojas-Ayala, B., et al. 2010, ApJ, 720, 113
- Scalo et al. (2007) Scalo, J., et al. 2007, Astrobiology, 7, 85
- Schlaufman & Laughlin (2010) Schlaufman, K. C., & Laughlin, G. 2010, A&A, 519, 105
- Shkolnik et al. (2011) Shkolnik, E., et al. 2011, ApJ, 727, 6
- Silvestri, Hawley, & Oswalt (2005) Silvestri, N. M., Hawley, S. L., & Oswalt, T. D. 2005, AJ, 129, 2428
- Silvestri et al. (2006) Silvestri, N. M., et al. 2006, AJ, 131, 1674
- Smart et al. (2007) Smart, R. L., et al. 2007, A&A, 464, 787
- Stauffer et al. (2011) Stauffer, J., et al. 2011, PASP, 122, 885
- Tarter et al. (2007) Tarter, J. C., et al. 2007, Astrobiology, 7, 30
- Torres et al. (2006) Torres, C. A. O., et al. 2006, A&A, 460, 695
- van Altena, Lee, & Hoffleit (1995) van Altena W.F., Lee J.T., & Hoffleit E.D. 1995, The General Catalogue of Trigonometric Stellar Parallaxes
- van Dokkum & Conroy (2010) van Dokkum, P. G.,& Conroy C. 2010, Nature, 468, 940
- van Leeuwen (2007) van Leeuwen F. 2007, A&A, 474, 653
- Voges et al. (1999) Voges, W., et al. 1999, A&A, 349, 389
- Voges et al. (2000) Voges, W., et al. 2000, IAU Circ. 7432, 1
- West et al. (2008) West, A. A., et al. 2008, AJ, 135, 785
- West et al. (2009) West, A. A., et al. 2009, IAU Symposium, 258, 327
- West et al. (2011) West, A. A., et al. 2011, AJ, 141, 97
- West & Basri (2009) West, A. A., & Basri, G. 2009, ApJ, 693, 1283
- Wright (2005) Wright, J. T. 2005, PASP, 117, 657
- Zuckerman et al. (2001) Zuckerman, B., et al. 2001, ApJ, 559, 388