Antiferromagnetic order and superlattice structure in nonsuperconducting and superconducting RbyFe1.6+xSe2
Abstract
Neutron diffraction has been used to study the lattice and magnetic structures of the insulating and superconducting RbyFe1.6+xSe2. For the insulating RbyFe1.6+xSe2, neutron polarization analysis and single crystal neutron diffraction unambiguously confirm the earlier proposed block antiferromagnetic structure. For superconducting samples ( K), we find that in addition to the tetragonal superlattice structure transition at 513 K, the material develops a separate superlattice structure at a lower temperature of 480 K. These results suggest that superconducting RbyFe1.6+xSe2 is phase separated with coexisting and superlattice structures.
pacs:
74.25.Ha, 74.70.-b, 78.70.NxI I. Introduction
The recent discovery of superconductivity around 30 K in alkaline iron selenides Fe1.6+xSe2 ( K, Rb, Cs, Tl) jgguo ; krzton ; mhfang ; afwang has generated considerable excitement in the condensed matter physics community because the parent compounds of these materials are antiferromagnetic (AFM) insulators mhfang ; haggstrom instead of being AFM metals as the iron arsenide superconductors kamihara ; cruz . Because of their metallic nature, band structure calculations for iron arsenides have predicted the presence of the hole-like Fermi surfaces at the point and electron-like Fermi surfaces at the points in the Brioullion zone using an orthorhombic full lattice unit cell johnston ; mazin . As a consequence, Fermi surface nesting and quasiparticle excitations between the hole and electron pockets can give rise to static AFM spin-density-wave order at the in-plane wave vector jdong . Indeed, neutron diffraction experiments have confirmed the AFM order in the parent compounds of iron arsenide superconductors, and doping to induce superconductivity suppresses the static AFM order cruz . In addition, angle resolved photoemission (ARPES) measurements hding have identified the expected hole and electron pockets in superconducting iron arsenides, thus providing evidence for superconductivity arising from the sign reversed electron-hole inter-pocket excitations mazin ; kuroki ; chubkov ; fwang .
If Fermi surface nesting and electron-hole pocket excitations are essential ingredients for magnetism and superconductivity in Fe-based superconductors cruz ; mazin ; jdong ; kuroki ; chubkov ; fwang , alkaline iron selenide superconductors should behave differently from iron arsenides since ARPES measurements on these materials reveal only electron Fermi surfaces at points and no hole Fermi surface at point yzhang ; xpwang ; xjzhou . Indeed, recent transmission electron microscopy jqli , X-ray and neutron diffraction experiments zavalij ; bacsa ; wbao1 ; pomjakushin1 ; fye ; wbao2 ; pomjakushin have confirmed that the Fe vacancies in Fe1.6+xSe2 form a superlattice order as shown in Fig. 1(a) haggstrom . Furthermore, a block-type AFM structure with a large moment aligned along the -axis [Figs. (1a) and (1b)] has been proposed for both superconducting and insulating Fe1.6+xSe2 based on Rietveld analysis of neutron powder diffraction data wbao1 ; wbao2 . In stark contrast to other Fe-based superconductors, where optimal superconductivity generally occurs in the absence of a static AFM order jzhao1 , the large moment AFM order is believed to co-exist with superconductivity microscopically shermadini and the superconducting phase develops without much affecting the AFM order wbao2 . If magnetic moments up to 3.3 per Fe indeed coexist with optimal superconductivity microscopically in Fe1.6+xSe2 as suggested in powder neutron diffraction wbao1 ; wbao2 and muon rotation experiments shermadini , the electronic phase diagram in this class of materials will be much different than the other Fe-based superconductors johnston . Since these new materials pose a major challenge to the current theories of superconductivity mazin2011 , it is important to confirm the proposed magnetic structure in single crystals and determine its relationship with superconductivity.
In this article, we present comprehensive neutron diffraction measurements on powder and single crystals of nonsuperconducting and superconducting RbyFe1.6+xSe2. We used neutron polarization analysis to separate the magnetic from nuclear scattering. From the Rietveld analysis of the neutron powder diffraction data on nonsuperconducting Rb0.89Fe1.58Se2 mywang2011 , we confirm the previously reported Fe vacancy order with space group haggstrom . Since Rietveld analysis of the powder diffraction pattern cannot conclusively separate the proposed block AFM structure from the quaternary collinear AFM structure with the space group wbao1 ; pomjakushin1 ; fye ; wbao2 ; pomjakushin , we used four circle single crystal diffractometer to measure Bragg peaks associated with each AFM structure, and confirmed the proposed block AFM structure wbao1 . For superconducting Rb0.75Fe1.63Se2 ( K), we find that in addition to the block AFM structure, the sample exhibits a quasi-two-dimensional superlattice distortion associated with wave vectors , where integers. These results suggest that lattice structures in superconducting RbyFe1.6+xSe2 are more complicated than the pure superlattice unit cell, consistent with nanoscale phase separation seen by transmission electron microscopy jqli1 ; jqli2 and X-ray diffraction experiments ricc1 ; ricc2 .
II II. Experimental Details
We have carried out neutron diffraction experiments at the BT-1 powder diffractometer and BT-7 thermal triple-axis spectrometer at the National Institute for Standard and Technology Center for Neutron Research. We have also performed additional measurements at HB-1A triple-axis spectrometer and HB-3A four circle single crystal diffractometer at the High-Flux Isotope Reactor, Oak Ridge National Laboratory. Our experimental setup for the BT-1 powder diffraction measurements was described previously cruz . For BT-7 measurements, we used polarized neutron scattering to separate the magnetic from nonmagnetic scattering processes jwlynn ; lipscombe . In previous powder diffraction measurements on Fe1.6+xSe2 near wbao1 ; wbao2 ; pomjakushin1 ; pomjakushin , the iron atoms were found to form an ordered vacancy structure with a superlattice unit cell. Although a block AFM spin structure with space group [Fig. 1(a) and Fig. 1(b)] was identified wbao1 ; wbao2 , powder Rietveld analysis cannot conclusively distinguish the block AFM structure from a stripe-like AFM structure with space group [Fig. 4(b)] wbao2 ; pomjakushin . We have therefore used the HB-3A single crystal diffractometer to measure all the accessible Bragg peaks, and including the nonequivalent magnetic reflections with the same momentum transfer that are fully overlapped in the powder diffraction experiments, thus providing more information to separate these two magnetic structures. HB-3A uses a vertically focusing Si(2,2,0) monochromator with fixed wavelength of 1.536 Å chako . The HB-1A triple-axis spectrometer has horizontal collimation with fixed incident beam energy of meV.
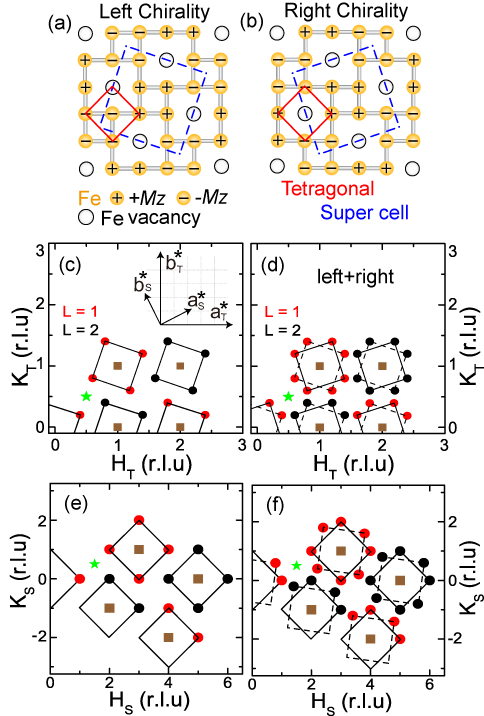
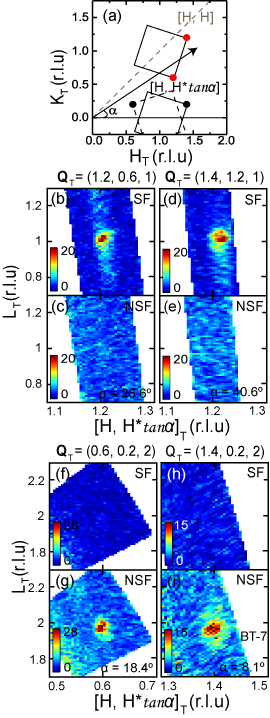
We begin our discussion by specifying the real and reciprocal space notations used in this article. Figures 1(a) and 1(b) show the left and right chiralities of the proposed block AFM structures, respectively. The blue dashed lines show the structural and magnetic unit cells for the Fe vacancy structure, while the red solid lines are the symmetry tetragonal unit cell suitable for doped BaFe2As2 johnston . The signs indicate the Fe moment directions parallel and anti-parallel to the -axis, respectively. For easy comparison with previous work in iron pnictides, we define wave vector in Å-1 as reciprocal lattice units (rlu), where Å are lattice parameters for tetragonal unit cell of iron pnictides lynn . The Bragg peaks in the superlattice unit cell can be indexed as rlu, where Å and Å for the nonsuperconducting Rb0.89Fe1.58Se2, Å and Å for the superconducting Rb0.75Fe1.63Se2. The Rb, Fe, and Se compositions are determined from inductively coupled plasma atomic emission spectroscopy analysis.
In iron pnictides, the Fe moments are in the Fe plane along the -axis direction lynn . The magnetic Bragg peaks occur at () positions in tetragonal unit cell notation. For Fe1.6+xSe2 with the block AFM structure in Figure 1, the magnetic peaks from left chirality are expected at when is even, is odd, as shown in Figs. 1(c) and 1(e). If one considers both left and right chiralities, the magnetic peaks will double and occur at when is even, is odd, . The nuclear Bragg reflections can be indexed the same way, but with and when is even, ; is odd, . The squares in Figs. 1(c)-1(f) indicate nuclear Bragg peak positions in tetragonal and superlattice unit cell notation. The conversion of Miller indices between tetragonal and superlattice unit cell for left chirality is as follows:
For right chirality, the conversion is:
Our single crystals of RbyFe1.6+xSe2 were grown using the Bridgeman method. First, Fe2+δSe2 powders were prepared with a high-purity powder of selenium (Alfa Aesar, 99.99%) and iron (Alfa Aesar, 99.9%) as described in Ref. bacsa . The Fe2+δSe2 and Rb (Alfa Aesar, 99.75%) were then mixed in appropriate stoichiometry and were put into an alumina crucible. The crucible was sealed in an evacuated silica ampoule. The mixture was heated up to 1030∘C and kept over 3 h. Afterward the melt was cooled down to 730∘C with a cooling rate of 6∘C/h, and finally the furnace was cooled to room temperature with the power shut off. Well-formed black crystals were obtained which could be easily cleaved into plates with flat shiny surfaces. We have also grown RbyFe1.6+xSe2 single crystals using flux method as described in Ref. afwang .
For BT-1 powder diffraction measurements, we ground grams of single crystals of Rb0.89Fe1.58Se2 and Rb0.75Fe1.63Se2. For the experiment on HB-3A, we used a 0.5 gram single crystal from the same batch of Rb0.89Fe1.58Se2. For HB-1A unpolarized and BT-7 polarized neutron scattering measurements, we used gram single crystals of Rb0.89Fe1.58Se2 and Rb0.75Fe1.63Se2 with less than 1∘ mosaic aligned in the zone in tetragonal notation. To separate the magnetic order from nonmagnetic scattering processes, we performed neutron polarization analysis, where the neutron spin flip (SF) scattering for polarization direction parallel to the scattering plane (HF) gives pure magnetic scattering lipscombe . In the BT-7 setup, the spin polarization direction in the incident beam could be changed via a flipper and the spin polarization direction for the scattered beam was fixed. The neutron SF magnetic scattering corresponds to flipper on, while the nuclear coherent scattering is with flipper off, which corresponds to nonspin flip (NSF) scattering. A horizontal guide field was directed along the in-plane momentum transfer (HF configuration), and the flipping ratio of 22 was obtained in this HF field configuration using an incident energy of 14.7 meV. A pyrolytic graphite (PG) filter was placed in the incident beam direction to suppress scattering. A position-sensitive detector (PSD) was used with collimations. For all the polarized measurements, the sample was at room temperature and aligned in both the and zones to reach the desired reciprocal space by tilting the sample goniometer.
III III. Results
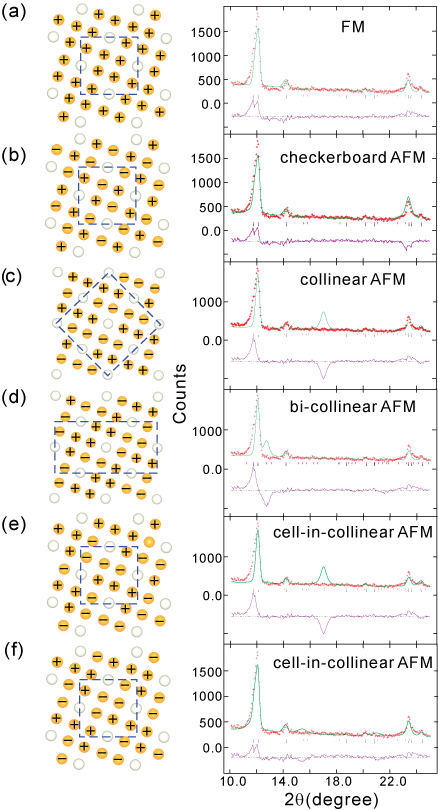
We first discuss our neutron powder refinement results on Rb0.89Fe1.58Se2 with the goal of determining the magnetic structure of the system. In previous theoretical work xwyan , eight possible magnetic structures have been proposed for the iron vacancy superlattice unit cell. Figure 2 summarizes the comparison between the observed neutron diffraction intensity and calculated intensity for six suggested magnetic structures. As we can see from the figure, all six magnetic models fail to describe the observed spectrum.
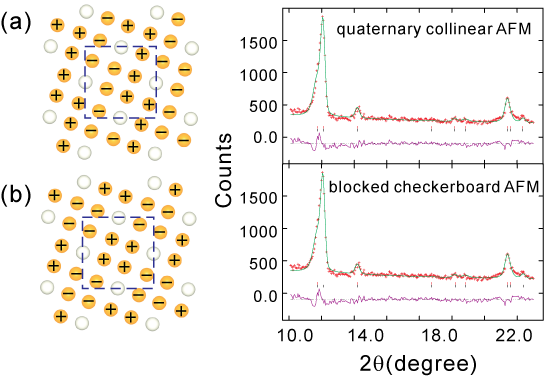
In previous neutron powder diffraction work wbao1 ; pomjakushin1 ; fye ; wbao2 ; pomjakushin , it has been suggested that the block AFM structure Fig. 3(b) and the quaternary collinear AFM structure in Fig. 3(a) can both fit the observed neutron diffraction spectra wbao2 ; pomjakushin . Our Rietveld analysis on Rb0.89Fe1.58Se2 for both AFM structures shown in Fig. 3 confirms this result. Although the block AFM structure is thought to be more energetically favorable wbao2 , the AFM structure shown in Fig. 3(a) is not conclusively ruled out pomjakushin .
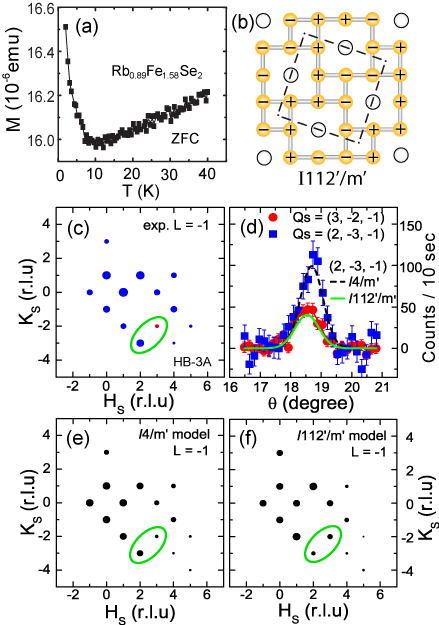
To conclusively determine the magnetic structure of the superlattice, we carried out neutron diffraction experiments on an as-grown single crystal of nonsuperconducting Rb0.89Fe1.58Se2. The zero field cooled (ZFC) magnetic susceptibility measurements on the sample indicate no bulk superconductivity [Fig. 4(a)]. As discussed in previous work wbao1 ; pomjakushin1 ; fye ; wbao2 ; pomjakushin , the block AFM structure in Fig. 3(b) can be described by the space group , while the AFM structure in Fig. 4(b) has a space group of . Figures 4(e) and 4(f) show the expected AFM Bragg peak intensities in the scattering plane for the and space groups, respectively. While the intensity of the reflection is weaker than that of the peak in the block AFM structure, reflection should be stronger for the quaternary collinear AFM structure. Comparison of the mapping of the Bragg peaks in the scattering plane in Fig. 4(c) with these two models in Figs. 4(e) and 4(f) confirms that the block AFM structure with space group is correct. The background subtracted raw data for and Bragg peaks are shown in Fig. 4(d), which again confirm the block AFM structure wbao1 .
To further establish the magnetic nature of the proposed block AFM structure, we have measured all Bragg peaks in Fig. 1(d) by polarized neutrons, where SF and NSF scattering correspond to pure magnetic and pure nuclear scattering, respectively, in the HF configuration. All measurements were done at room temperature allowing easy tilting of the samples to access different Bragg peaks. Figure 5 summarizes the reciprocal space probed and the raw SF and NSF scattering for different Bragg peaks in the tetragonal unit cell notation. Initially, we aligned the sample in the zone as shown in the dashed line of Fig. 5(a). The and axes are aligned along the lower and upper arc axes of the goniometer, respectively. By rotating the lower arc of the goniometer by angles as shown in Fig. 5(a), we can access magnetic Bragg peaks and associated with the block AFM structure [Fig. 5(a)]. Figures 5(b)-5(e) reveal that the expected magnetic Bragg peaks only appear in the SF channel, and there are no features in the NSF channel. Therefore, and Bragg reflections are are entirely magnetic in origin with no nuclear component. To access and peaks, we realigned the sample to the zone. Figures 5(f)-5(i) show that and peaks appear entirely in the NSF channel thus revealing their nuclear origin. These results conclusively establish the magnetic nature of the block AFM structure with space group for the nonsuperconducting Rb0.89Fe1.58Se2.
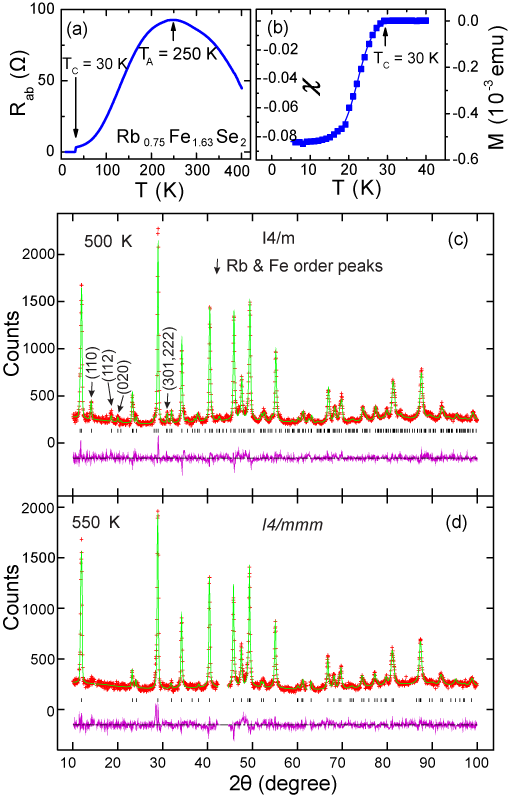
Although the block AFM structure for nonsuperconducting Rb0.89Fe1.58Se2 is now firmly established, it is still unclear how the static AFM order co-exists with superconductivity. In previous work wbao1 ; fye ; wbao2 , it was argued that the block AFM order with huge moments in Fe1.6+xSe2 microscopically coexists with superconductivity. However, recent X-ray diffraction measurements have provided compelling evidence for nanoscale phase separation in K0.8Fe1.6Se2 ricc1 ; ricc2 . To check how superconducting Fe1.60+xSe2 differs from the nonsuperconducting samples, we prepared a single crystal Rb0.75Fe1.63Se2, where transport measurement shows K, metallic behavior below 250 K, and semiconducting characteristics above [Fig. 6(a)]. Although magnetic susceptibility confirms the superconducting transition at K, we estimate that the superconducting volume fraction in our sample is only around [Fig. 6(b)]. To determine the precise crystal lattice structure and atomic compositions, we carried out neutron powder diffraction measurements on BT-1. Rietveld analysis of the powder diffraction data at 550 K using the space group fits the data well [Fig. 6(d)]. At 500 K, Fe vacancies order into a superlattice structure as shown in Fig. 1(a) haggstrom and the powder diffraction pattern can be well described by the space group .
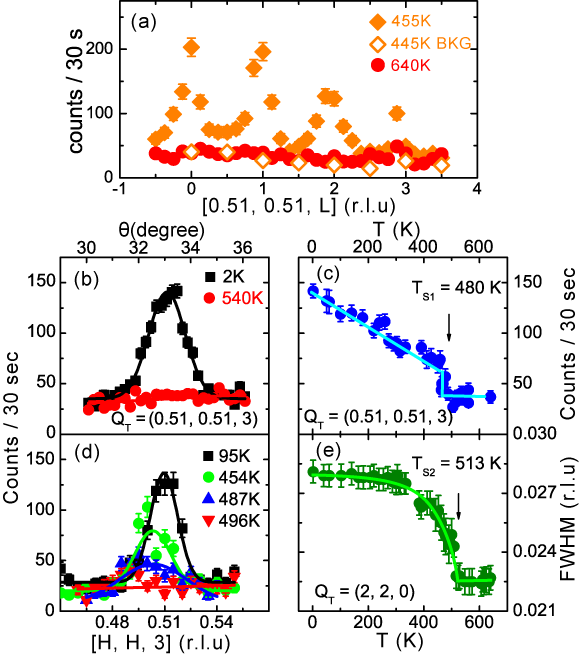
We have searched extensively for structural and magnetic peaks in superconducting Rb0.75Fe1.63Se2. In addition to confirming the AFM peaks at identical positions as the nonsuperconducting Rb0.89Fe1.58Se2, we find a set of new peaks at wave vectors where . Along the -axis, these peaks are broad and Lorentzian-like, and centered at integer positions. They disappear on warming from 445 K to 640 K [Fig. 7(a)], suggesting that they are associated with either a magnetic phase transition or structural lattice distortion not related to the known superlattice structure. The broad nature of the scattering along the -axis indicates that they are quasi two-dimensional. Figure 7(b) plots rocking curve scans at wave vector , which again show the disappearance of the low-temperature peak at 540 K. To determine the phase transition temperature associated with the peaks and compare those with the tetragonal () to the superlattice () transition, we carefully measured the intensity of the peak and the width of the Bragg peak. While the peak shows an abrupt first-order-like phase transition and disappears above 480 K [Fig. 7(c)], the Bragg peak width on the reflection shows a second-order-like phase transition at 513 K [Fig. 7(e)]. Figure 7(d) shows the scans at different temperatures, which display no peak at 496 K, thus confirming that the phase transition temperature for the peaks happens at a lower temperature than that of the tetragonal-to- superlattice distortion.
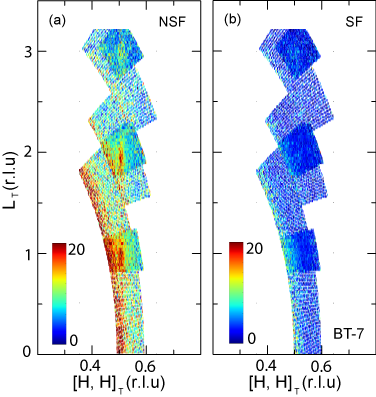
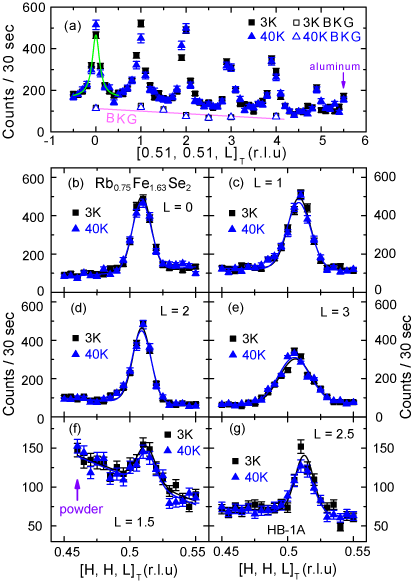
To see if the two-dimensional scattering responds to the formation of the superconductivity, we have carried out in-plane and -axis scans below and above K on Rb0.75Fe1.63Se2. We find that these peaks do not exhibit any changes across [Fig. 8(a)]. Figure 8(b)-(g) show elastic scans along the direction at -values of =0,1,2,3,1.5,2.5. For all -values, we find peaks centered at rlu, confirming the two-dimensional nature of the scattering. In previous X-ray diffraction experiments on CsyFe2-xSe2, Pomjakushin et al. pomjakushin have also found peaks at . This means that a portion of the signal we observe at must be due to a structural distortion. To determine if there is any additional magnetic component in the scattering, we performed neutron polarization analysis. Figures 9(a) and 9(b) show mappings of the reciprocal space in the zone for the NSF and SF scattering, respectively. While one can see a clear rod of scattering centered at along the direction in the NSF channel, the SF scattering is featureless in the entire probed range. Since the rod-like scattering is not compatible with the superlattice structure, our data suggest that Rb0.75Fe1.63Se2 is phase separated and exhibits two structural transitions, one at 513 K and the second one at 480 K.
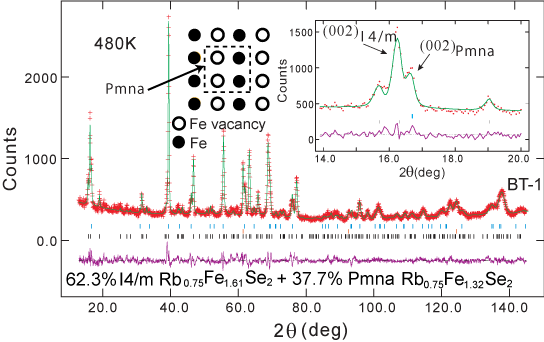
In an attempt to determine the lattice structure associated with the reflections, we carried out detailed Rietveld analysis on the neutron powder diffraction pattern. Since the reflections are much weaker in the powder pattern, we were able to fit the powder diffraction pattern with a combination of % superlattice () and Rb0.75Fe1.32Se2 Fe-vacancy model in the inset of Fig. 10 () wbao2 . However, such an Fe-vacancy model with space group will not be able to explain the quasi two-dimensional rod scattering we observe in the triple-axis measurements. Therefore, it remains unclear what crystalline lattice distortion gives rise to the observed superlattice reflections, although we know such scattering enlarges the nuclear unit cell by . We note that a recent X-ray study on superconducting RbyFe1.6+xSe2 samples also found a superlattice structure tsurkam .
IV IV. Discussions and Conclusions
Using single crystal neutron diffraction and neutron polarization analysis, we have confirmed that the block AFM structure in Fig. 1 is the only possible magnetic structure for insulating AFM Rb0.89Fe1.58Se2 wbao1 . Although we have also found a similar AFM structure for the superconducting Rb0.75Fe1.63Se2, careful analysis of the diffraction spectra reveals another structural phase transition associated with enlarged unit cell for superconducting Rb0.75Fe1.63Se2. In previous ARPES measurements on superconducting Fe1.6+xSe2 yzhang ; xpwang ; xjzhou , different groups have reached the same conclusion concerning the electron-like Fermi surfaces at points. However, there have been debates concerning the origin of the observed weak electron pockets near the point yzhang ; xjzhou . In principle, the electron pockets near the point can arise from band folding if there exists a structural or magnetic phase transition xjzhou . Our observation of the quasi two-dimensional superlattice reflections suggests that the observed electron Fermi surfaces near the point may indeed be due to band folding instead of a surface state. Since the block AFM structure in insulating Rb0.89Fe1.58Se2 cannot arise from Fermi surface nesting, we speculate that the lattice distortions in superconducting Rb0.75Fe1.63Se2 may be associated with the metallic portion of the sample. In this picture, the superconducting phase in Fe1.6+xSe2 may be mesoscopically phase separated from the nonsuperconducting phase, where superconductivity and AFM order are intertwined in a very short length scale and live in separate regions. Theoretically, it has been suggested that the Fe1.5Se2 phase is a semiconductor with a low energy band gap txiang . So with electron or hole doping, such a phase would become nonmagnetic and superconducting. Although we have no direct proof that the superconducting portion of the sample is associated with the superlattice distortion, systematic neutron scattering measurements are currently underway to investigate the relationship of such phase to the block AFM order and superconductivity.
V V. Acknowledgements
We are grateful to Jiangping Hu and Tao Xiang for helpful discussions. Work at IOP is supported by the Ministry of Science and Technology of China (973 Project No. 2010CB833102, 2010CB923002, 2011CBA00110), and Chinese Academy of Sciences. The single crystal growth and neutron scattering effort at UT is supported by U.S. DOE BES under Grant No. DE-FG02-05ER46202 (P.D.). Work at ORNL neutron scattering facilities are supported by the Scientific User Facilities Division, Office of Basic Energy Sciences, U.S. Department of Energy. Part of the work at UT is also supported by the U.S. NSF-OISE-0968226 (P. D.). The work at ZJU is supported by by Natural Science Foundation of China (Grant No. 10974175), the Ministry of Science and Technology of China (973 Project No. 2011CBA00103).
References
- (1) J. G. Guo, S. F. Jin, G. Wang, S. C. Wang, K. X. Zhu, T. T. Zhou, M. He, and X. L. Chen, Phys. Rev. B 82, 180520(R) (2010).
- (2) A. Krzton-Maziopa, Z. Shermadini, E. Pomjakushina, V. Pomjakushin, M. Bendele, A. Amato, R. Khasanov, H. Luetkens, K. Conder, J. Phys.: Condens. Matter 23, 052203 (2011).
- (3) M. H. Fang, H. D. Wang, C. H. Dong, Z. J. Li, C. M. Feng, J. Chen, H. Q. Yuan, Europhys. Lett. 93, 47004 (2011).
- (4) A. F. Wang, J. J. Ying, Y. J. Yan, R. H. Liu, X. G. Luo, Z. Y. Li, X. F. Wang, M. Zhang, G. J. Ye, P. Cheng, Z. J. Xiang, X. H. Chen, Phys. Rev. B 83, 060512 (2011).
- (5) L. Hggstrm et al., J. Magn. Magn. Mater. 98, 37 (1991).
- (6) Y. Kamihara, T. Watanabe, M. Hirano, and H. Hosono, J. Am. Chem. Soc. 130, 3296 (2008).
- (7) C. de la Cruz, Q. Huang, J. W. Lynn, J. Li, W. Ratcliff II, J. L. Zarestky, H. A. Mook, G. F. Chen, J. L. Luo, N. L. Wang, Pengcheng Dai, Nature (London) 453, 899 (2008).
- (8) D. C. Johnston, Advnaces in Physics 59, 803 (2010).
- (9) I. I. Mazin, D. J. Singh, M. D. Johannes, and M. H. Du, Phys. Rev. Lett. 101, 057003 (2008).
- (10) J. Dong et al., EPL 83, 27006 (2008).
- (11) H. Ding et al., EPL 83, 47001 (2008).
- (12) K. Kuroki, S. Onari, R. Arita, H. Usui, Y. Tanaka, H. Kontani, and H. Aoki, Phys. Rev. Lett. 101, 087004 (2008).
- (13) A. V. Chubukov, Physica C 469, 640 (2009).
- (14) F. Wang, H. Zhai, Y. Ran, A. Vishwanath, and D.-H. Lee, Phys. Rev. Lett. 102, 047005 (2009).
- (15) Y. Zhang, L. X. Yang, M. Xu, Z. R. Ye, F. Chen, C. He, J. Jiang, B. P. Xie, J. J. Ying, X. F. Wang, X. H. Chen, J. P. Hu, D. L. Feng, Nature Materials 10, 273 (2011).
- (16) T. Qian, X.-P. Wang, W.-C. Jin, P. Zhang, P. Richard, G. Xu, X. Dai, Z. Fang, J.-G. Guo, X.-L. Chen, and H. Ding, Phys. Rev. Lett. 106, 187001 (2011).
- (17) D. X. Mou et al., Phys. Rev. Lett. 106, 107001 (2011).
- (18) Z. Wang, Y. J. Song, H. L. Shi, Z.W. Wang, Z.Chen, H. F. Tian, G. F. Chen, J. G. Guo, H. X. Yang, J. Q. Li, Physical Review B 83, 140505(R) (2011).
- (19) P. Zavalij, Wei Bao, X. F. Wang, J. J. Ying, X. H. Chen, D. M. Wang, J. B. He, X. Q. Wang, G. F. Chen, P.-Y. Hsieh, Q. Huang, and M. A. Green, Phys. Rev. B 83, 132509 (2011).
- (20) J. Bacsa, A. Y. Ganin, Y. Takabayashi, K. E. Christensen, K. Prassides, M. J. Rosseinsky, J. B. Claridge, Chem. Sci. 2, 1054 (2011).
- (21) W. Bao, Q. Huang, G. F. Chen, M. A. Green, D. M. Wang, J. B. He, X. Q. Wang, Y. Qiu, Chinese Phys. Lett. 28, 086104 (2011).
- (22) V. Yu. Pomjakushin, D. V. Sheptyakov, E. V. Pomjakushina, A. Krzton-Maziopa, K. Conder, D. Chernyshov, V. Svitlyk, Z. Shermadini, Phys. Rev. B 83, 144410 (2011).
- (23) F. Ye, S. Chi, Wei Bao, X. F. Wang, J. J. Ying, X. H. Chen, H. D. Wang, C. H. Dong, Minghu Fang, arXiv: 1102.2882.
- (24) Wei Bao, G. N. Li, Q. Huang, G. F. Chen, J. B. He, M. A. Green, Y. Qiu, D. M. Wang, J. L. Luo, arXiv: 1102.3674.
- (25) V. Yu. Pomjakushin, E. V. Pomjakushina, A. Krzton-Maziopa, K. Conder, Z. Shermadini, J. Phys.: Condens. Matter 23, 156003 (2011).
- (26) Jun Zhao, Q. Huang, C. de la Cruz, Shiliang Li, J. W. Lynn, Y. Chen, M. A. Green, G. F. Chen, G. Li, Z. Li, J. L. Luo, N. L. Wang, Pengcheng Dai, Nature Materials 7, 953 (2008).
- (27) Z. Shermadini, A. Krzton-Maziopa, M. Bendele, R. Khasanov, H. Luetkens, K. Conder, E. Pomjakushina, S. Weyeneth, V. Pomjakushin, O. Bossen, A. Amato, Phys. Rev. Lett. 106, 117602 (2011).
- (28) J. W. Lynn and Pengcheng Dai, Physica C 469, 469-476 (2009).
- (29) I. I. Mazin, Physics 4, 26 (2011).
- (30) M. Y. Wang, C. Fang, D-X Yao, G. T Tan, L. W. Harriger, Y. Song, T. Netherton, C. L. Zhang, M. Wang, M. B. Stone, W. Tian, J. P. Hu, Pengcheng Dai, arXiv: 1105.4675.
- (31) J. Q. Li, Y. J. Song, H. X. Yang, Z. Wang, H. L. Shi, G. F. Chen, Z.W. Wang, Z.Chen, H. F. Tian, arXiv: 1104.5340.
- (32) Y. J. Song, Z. Wang, Z. W. Wang, H. L. Shi, Z. Chen, H. F. Tian, G. F. Chen, H. X. Yang, J. Q. Li, arXiv:1104.4844.
- (33) A. Ricci, N. Poccia, B. Joseph, G. Arrighetti, L. Barba, J. Plaisier, G. Campi, Y. Mizuguchi, H. Takeya, Y. Takano, N. L. Saini, A. Bianconi, Superconductor Science and Technology 24, 082002 (2011).
- (34) A. Ricci, N. Poccia, G. Campi, B. Joseph, G. Arrighetti, L. Barba, M. Reynolds, M. Burghammer, H. Takeya, Y. Mizuguchi, Y. Takano, M. Colapietro, N. L. Saini, A. Bianconi, arXiv: 1107.0412.
- (35) J. W. Lynn, Y. Chen, S. Chang, Y. Zhao, S. Chi, W. Ratcliff, B. G. Ueland, R. W. Erwin, NIST Journal of Research, (to be published).
- (36) O. J. Lipscombe, Leland W. Harriger, P. G. Freeman, M. Enderle, Chenglin Zhang, Miaoying Wang, Takeshi Egami, Jiangping Hu, Tao Xiang, M. R. Norman, and Pengcheng Dai, Phys. Rev. B 82, 064515 (2010).
- (37) B. C. Chakoumakos, H. Cao, F. Ye, A. D. Stoica, M. Poovici, M. Sundaram, W. Zhou, J. S. Hicks, G. W. Lynn, and R. A. Riedel, J. Appl. Cryst. 44, 655 (2011).
- (38) X. W. Yan, M. Gao, Z. Y. Lu, and T. Xiang, Phys. Rev. B 83, 233205 (2011).
- (39) V. Tsurkan, J. Deisenhofer, A. Gnther, H.-A. Krug von Nidda, S. Widmam, and A. Loidl, arXiv: 1107.3932v1.
- (40) X. W. Yan, M. Gao, Z.-Y. Lu, and T. Xiang, Phys. Rev. Lett. 106, 087005 (2011).