WR 38/38a AND THE RATIO OF TOTAL-TO-SELECTIVE EXTINCTION IN CARINA
Abstract
A reanalysis of the (seemingly very distant) open cluster Shorlin 1, the group of stars associated with WR 38 and WR 38a, is made on the basis of existing UBV and JHKs observations for cluster members. The 2MASS observations, in particular, imply a mean cluster reddening of and a distance of kpc. The reddening agrees with the UBV results provided that the local reddening slope is described by , but the distance estimates in the 2MASS and UBV systems agree only if the ratio of total-to-selective extinction for the associated dust is . Both results are similar to what has been obtained for adjacent clusters in the Eta Carinae region by similar analyses, which suggests that“anomalous” dust extinction is widespread through the region, particularly for groups reddened by relatively nearby dust. Dust associated with the Eta Carinae complex itself appears to exhibit more “normal” qualities. The results have direct implications for the interpretation of distances to optical spiral arm indicators for the Galaxy at , in particular the Carina arm here is probably little more than kpc distant, rather than kpc distant as implied in previous studies. Newly-derived intrinsic parameters for the two cluster Wolf-Rayet stars WR 38 (WC4) and WR 38a (WN5) are in good agreement with what is found for other WR stars in Galactic open clusters, which was not the case previously.
1 INTRODUCTION
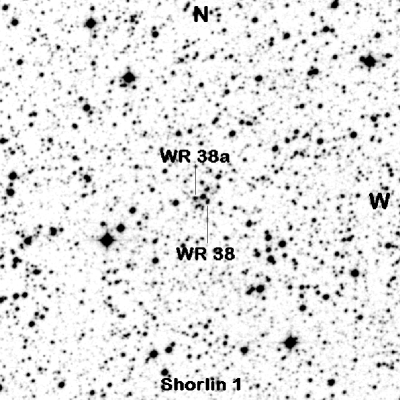
The Galaxy’s collection of open clusters is a varied assortment of stellar groups of diverse richness and age that serves a number of important functions for studies in Galactic astronomy, ranging from empirical investigations of the properties of interstellar extinction (Turner, 1976b) and observational verification of computational models for stellar evolution (Meynet et al., 1993) to the calibration of luminosities, interstellar reddenings, and ages for the sundry objects belonging to them (e.g., Cepheids: Turner, 2010). Much of what we know about the intrinsic properties of Wolf-Rayet stars, for example, has been established with reference to the sample of such objects that are members of open clusters (e.g., Lundström & Stenholm, 1984; van der Hucht, 2001). The increased sensitivity of astronomical detectors in recent years has coincided with a growth in the number of Galactic calibrators found in open clusters, and has extended the range of such calibrators beyond the distance limits of previous years. One such case involves the pair of Wolf-Rayet stars WR 38 and WR 38a, which appear to be members of a distant open cluster (Shorlin, 1998; Shorlin, Turner & Pedreros, 2004; Wallace et al., 2005), recently designated as Shorlin 1 (on-line update of Dias et al., 2002) and depicted in Fig. 1.
A problem arises from the three photometric studies of Shorlin 1: a photoelectric/CCD UBV study by Shorlin (1998) and Shorlin et al. (2004), a Hubble Space Telescope (HST) UBV study by Wallace et al. (2005) analyzed in conjunction with JHKs observations (Cutri et al., 2003) from the Two Micron All Sky Survey (2MASS, Skrutskie et al., 2006), and a CCD UBVI study by Carraro & Costa (2009). The study by Shorlin et al. (2004) implied a distance of kpc to Shorlin 1, the HST study by Wallace et al. (2005) found a distance of kpc, and the study by Carraro & Costa (2009) a distance of kpc. Observations from the 2MASS survey were included in the Wallace et al. (2005) study, yet it is possible to use JHKs observations independently to obtain estimates for the reddening and distance of the cluster (Turner, 2011). It was in an attempt to reconcile the various studies of Shorlin 1 by Shorlin et al. (2004), Wallace et al. (2005), and Carraro & Costa (2009) by the techniques described by Turner (2011) for analysis of 2MASS observations that a completely separate solution was obtained, one that has far-reaching implications for the delineation of Galactic spiral structure in the Carina region. That solution is described here.
| Field | Method | Source | |
|---|---|---|---|
| Carinae | Comparison of radio/H emission | Rodgers & Searle (1967) | |
| Tr 14/16 | UBV VE study | Feinstein (1969) | |
| Car/Cen | UBV VE study | Lodén & Sundman (1972) | |
| IC 2581 | UBV VE study | Turner (1973) | |
| Tr 16 | UBV VE study | Turner (1974) | |
| Car R1 | UBV-SpT VE study | Herbst (1975) | |
| HD 92964 | Polarization | Whittet & van Breda (1975) | |
| IC 2581 | UBV VE study | Turner (1976a) | |
| Car | Mean polarization | Whittet (1977) | |
| Tr 14/16/Cr 228 | UBVRI VE study | Herbst (1976) | |
| IC 2581 | UBV-SpT VE study | Turner (1978) | |
| Car OB1 | BVRI color excess ratios | Forte (1978) | |
| Carina, kpc | Mean polarization | Whittet (1979) | |
| Tr 14/15/16/Cr 228/232 | UBV VE study | Turner & Moffat (1980) | |
| NGC 3293/3324 | UBVRI-SpT VE study | Turner et al. (1980) | |
| Tr 15 | UBVRI VE study | Feinstein, FitzGerald & Moffat (1980) | |
| Tr 15/16/Cr 228 | UBVRIJHKLM color differences | Thé, Bakker & Tjin A Djie (1980) | |
| Tr 16-149 | UBVRIJHKL/Walraven colors | Thé & Groot (1983) | |
| Tr 14/16 | UBVRIJHK color differences | Smith (1987) | |
| Tr 14/ Car | Nebula expansion/SpT distances | Allen & Hillier (1993); Walborn (1995) | |
| Tr 14/16 | SpT distances | Walborn (1995) | |
| Tr 14 | UBVRI VE study/color differences | Vázquez et al. (1996) | |
| Carina, | dependence | Turner (1989, 1996) | |
| Tr 14/15/16/Car I | ? | UBVRIJHK photometry | Tapia et al. (2003) |
| NGC 3293 | UBVRI color excess ratios | Baume et al. (2003) | |
| Ru 91 | UBV VE study | Turner et al. (2005) | |
| Cr 236 | UBV-SpT VE study | Turner et al. (2009a) | |
| Shorlin 1 | Comparison of UBV/JHKs distances | This paper |
The importance of the results for Shorlin 1 is tied to the ratio of total-to-selective extinction, , relating the color excess to the total extinction in the Johnson visual V band, . A knowledge of R is used to correct apparent distance moduli for reddened objects for the effects of interstellar extinction, and therefore plays an important role in establishing distances to such objects. The region surrounding the Carinae nebula has long been a controversial part of the Galactic plane in that respect, since a variety of studies over the years have generated a wide range of values for the value of R in Carina. Table 1 is an attempt to summarize the many and varied R analyses that have been carried out for stars and clusters in the Carina region, revealing that a range of solutions covering the interval from to has been generated, with no obvious consensus on the true value of R applying throughout the region. In fact, two studies (Walborn, 1995; Tapia et al., 2003) argue that R has distinctly different values in the closely adjacent open clusters Tr 14 and Tr 16, while Thé et al. (1980) have argued that it varies from one star to another in this direction. As pointed out here, both arguments are probably very close to the truth.
It should be noted in Table 1 that distinctly different methods have been employed to derive values of R describing the extinction in the designated fields of Carina. The abbreviation “VE” used in the table stands for the variable-extinction method, as described for example by Turner (1976a, b). Each technique employed to derive R has its strengths and weaknesses, as discussed in §3. The point is that applications of the same method often generate disparate values of R, and adoption of an overall mean for the region would only exacerbate the problem.
2 THE OBSERVATIONAL DATA FOR SHORLIN 1
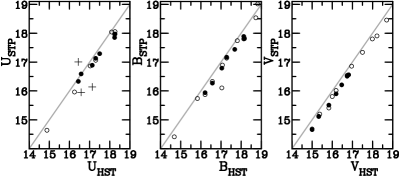
Fig. 2 presents a comparison of the UBV observations of Shorlin et al. (2004) and Carraro & Costa (2009) with those of Wallace et al. (2005) for stars in common. Since the Carraro & Costa (2009) observations were normalized to the Shorlin et al. (2004) data, they generally match the trends of the latter. Deviant points from the Carraro & Costa (2009) study (e.g., the plus signs in Fig. 2) correspond to emission-line stars (WR 38 and WR 38a) and very blue stars, and were omitted from subsequent analysis. Clearly there are systematic offsets between data sets on the HST system and those normalized to the Shorlin et al. (2004) study, although the general trends are linear: 0.984 for U, 0.998 for B, and 1.016 for V. The ground-based CCD observations of Shorlin et al. (2004), calibrated using relatively bright stars observed photoelectrically, might be the source of the discrepancy, particularly in U where a Balmer discontinuity correction was applied to the original observations with the CCD camera on the University of Toronto’s Las Campanas 0.6m telescope. In contrast, the HST WFPC2 observations were tied to calibrations by Holtzman et al. (1995) and Dolphin (2000), although there are indications that the sensitivity of the camera degrades temporally (Saha et al., 2006).
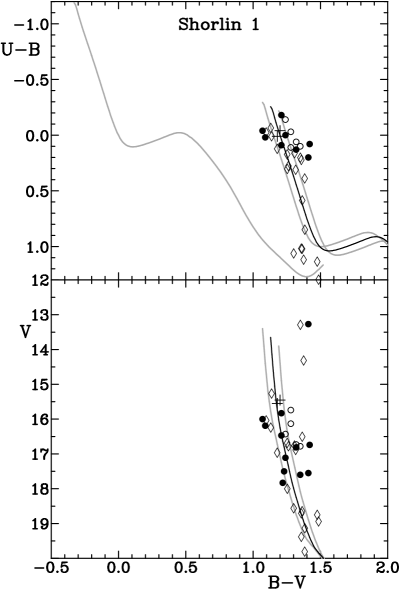
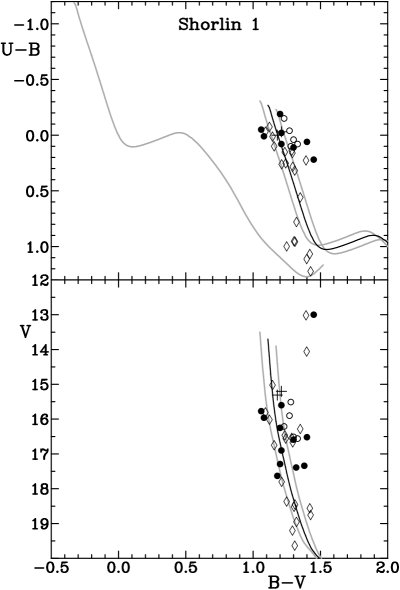
It is possible to adjust observations from one system to those of the other, so both systems were treated separately as the standard reference frame and the results examined individually. When the observations of Shorlin et al. (2004) and Carraro & Costa (2009) are standardized in such fashion to the HST UBV system of Wallace et al. (2005), the resulting data for likely cluster members lying within the cluster nucleus (see below) generate the color-color and color-magnitude diagrams of Fig. 3. If the Shorlin et al. (2004) system is used as the standard reference frame, the UBV color-color and color-magnitude diagrams are as shown in Fig. 4. The scatter in the observations is large in both cases, typically ranging between and in the colors. Although seemingly consistent with the cited uncertainties in the three studies, such large scatter may also be linked to differential reddening in the field, as suggested by the systematic tendency for faint stars to be bluer on average than brighter stars, the expected bias caused by interstellar extinction. It does limit what one can infer from the observations. The differences between Figs. 3 and 4 are generally small, however, except for a magnitude offset, the Shorlin et al. (2004) system being brighter than that of Wallace et al. (2005).
The UBV observations of Figs. 3 and 4 can be analyzed by standard techniques (e.g., Turner, 1976a; Turner et al., 1980, 2005), but an essential first step is to confirm the reddening relation for the field (Turner, 1989). If one makes the unjustified assumption that the reddening in Shorlin 1 is typical of that in other regions of the Galaxy, then one finds that adoption of a mean relation such as (Turner, 1989) results in 5 stars bluer than the intrinsic colors for hot O7 stars. Adoption of a mean relation such as (FitzGerald, 1970) is worse, since it results in 11 stars bluer than the intrinsic colors of O7 stars. Most clusters containing early-type Wolf-Rayet stars as members also contain evolved O-type stars and B supergiants (see Lundström & Stenholm, 1984), so it seems unlikely that Shorlin 1 could be so rich in early O-type stars.
Alternatively, one can establish the appropriate reddening slope for the region of Shorlin 1 from the colors of the bluest member stars. The sample of blue stars is small, but there are three objects that have colors possibly matching those of a reddened O7 star (2 objects) or B1 star (1 object). The implied reddening slope for the region is then , which was adopted here. There are no spectroscopic observations available to test such an assumption, but one is free to adopt later spectral types for the stars, in which case the implied reddening slope becomes even smaller (also a possibility).
The analysis of Shorlin 1 stars proceeded as follows. The intrinsic color-color relation for dwarfs was reddened by various amounts to match the observed colors of cluster stars, and the intrinsic color-absolute magnitude relation for zero-age main-sequence stars (ZAMS, Turner, 1976a, 1979) was adjusted simultaneously in magnitude to examine the fit for obvious main-sequence stars. A minimum reddening was found by matching the color-color diagram and color-magnitude diagram to the bluest cluster stars, and a maximum reddening was found in similar fashion using the reddest cluster stars. Several stars lay beyond such limits, but in such small numbers that a simultaneous fit was impossible. That may be yet further evidence for the possible existence of differential reddening in the field. The results were similar for both Fig. 3 and Fig. 4, yielding values of and V– for data on the HST system, and very similar values of and V– for data on the system of Shorlin et al. (2004). The cluster color-magnitude diagrams of Figs. 3 and 4 also appear to contain a few evolved blue supergiants, typical of groups containing Wolf-Rayet stars (Lundström & Stenholm, 1984). Such stars were, in fact, suspected in the original study by Shorlin et al. (2004).
The standard reddening relation for nearby dust clouds in the Galactic plane has a slope that averages 0.72, but does range from values as small as 0.54–0.62 to values of 0.80 or more (Johnson & Morgan, 1955; Turner, 1989). There are also indications in nearby regions of the Galaxy for a correlation between UBV reddening slope and the ratio of total-to-selective extinction, , describing the extinction properties of the dust (Turner, 1994, 1996). The average size of dust grains in the Galactic plane affects the optical reddening slope in consistent fashion with how the ratio of total-to-selective extinction R is affected, namely small reddening slopes are linked to larger-than-average values of R and large reddening slopes are linked to smaller-than-average values of R. That is expected if the grain size distribution for the dust particles is skewed to larger-than-average dimensions in the former situation, and to smaller-than-average dimensions in the latter situation. Nor are the peculiarities of dust extinction in the direction of Shorlin 1 () unique, namely a smaller-than-average reddening slope. The extinction associated with the region of Ruprecht 91 at is described by a reddening slope of and (Turner et al., 2005), and similar results with apply to the dust extinction in Collinder 236 at (Turner et al., 2009a). The results for Shorlin 1 are therefore consistent with previous results for the extinction properties of dust affecting clusters in the Carina region.
The value of the reddening slope is important for previous analyses of the cluster, since the study by Shorlin et al. (2004) used previous results for the reddening slope and value of R in Carina (Turner, 1976b, 1977, 1978; Turner & Moffat, 1980; Turner et al., 1980) to infer the reddening and distance of Shorlin 1. A reddening slope of for Shorlin 1 results in a significantly smaller mean cluster reddening (), as noted above, than the value of obtained by Shorlin et al. (2004). And a correspondingly different (presumably larger) value for R results in a much smaller derived distance to the cluster than the published values ranging from kpc. The exact amount of change depends upon the value of R for Shorlin 1.
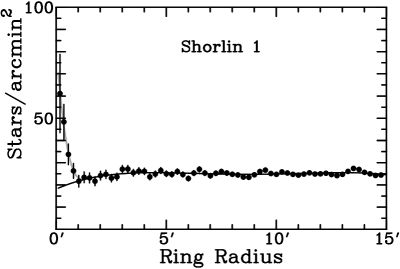
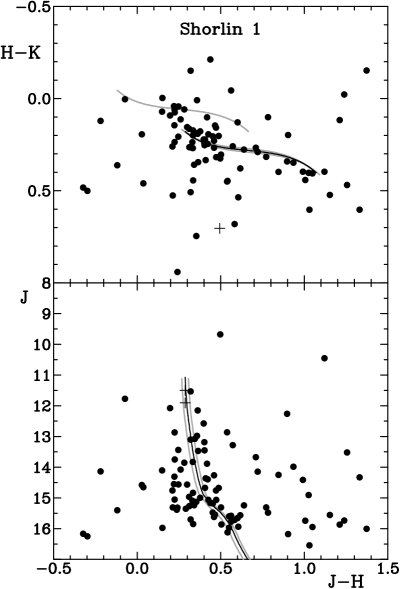
An alternate approach to the problem can be made using 2MASS observations of cluster stars (Cutri et al., 2003). Intrinsic relations for JHKs photometry are available from Turner (2011), and are linked to the same intrinsic UBV colors for main sequence stars and the same zero-age main-sequence relation (Turner, 1976a, 1979). A first step is to restrict the analysis to likely cluster members. For that a cluster center of symmetry at 2000 co-ordinates 11:05:48, –61:13:44, was identified by eye from Fig. 1, and star counts were made to the limit of the 2MASS survey in J in rings about that point. The results are shown in Fig. 5 along with Poisson uncertainties for each datum.
Star counts for Shorlin 1 appear to differ in one important property relative to those for most other open clusters: they do not exhibit the core/halo (nucleus/corona) structure typical of other clusters (Kholopov, 1969; Turner et al., 2005, 2009a). The implication is that Shorlin 1 does not exhibit the characteristics of a true star cluster, but more closely resembles a stellar asterism, perhaps the compact trapezium-like core of a now-dissolved young cluster. The star densities do exhibit a peak at the adopted cluster center, but immediately outside the (assumed) cluster nucleus decrease to values that are smaller than in more distant regions, as if the total extinction along the line of sight increased slightly near the center of the field. Otherwise the field star density in the region is reasonably constant. If the radial trend follows the relation shown in Fig. 5, then the core of the dissolved cluster has a radius of , within which there are Shorlin 1 members brighter than the 2MASS survey limit of (an uncertainty cannot be established because of the ad hoc assumption about background star densities). Since likely Shorlin 1 members lie within of the adopted group center, JHKs color-color and color-magnitude diagrams for such stars were examined in conjunction with the UBV color-color and color-magnitude diagrams, as shown in Fig. 6.
| Cluster | d (kpc) | Source | ||
|---|---|---|---|---|
| Tr 14 | This paper | |||
| Vázquez et al. (1996) | ||||
| Tr 15 | This paper | |||
| Feinstein et al. (1980) | ||||
| Tr 16 | This paper | |||
| Feinstein, Marraco & Muzzio (1973) | ||||
| NGC 3293 | This paper | |||
| Turner et al. (1980) | ||||
| NGC 3324 | This paper | |||
| Clariá (1977) | ||||
| IC 2581 | This paper | |||
| Turner (1978) | ||||
| Cr 228 | This paper | |||
| Feinstein et al. (1976) | ||||
| Cr 232 | This paper | |||
| Average | This paper |
Variations in optical extinction slope and affect reddening slope and total extinction corrections in the infrared at wavelengths of 1.235 (J), 1.662 (H), and 2.159 m (Ks) to only a minor extent. It is therefore appropriate to use standard techniques to analyze the observations of Fig. 6. The JHKs observations were used in conjunction with the reddenings obtained for group stars in Figs. 3 and 4, with the results shown in Fig. 6. The average reddening for Shorlin 1 stars obtained with the HST (Wallace et al., 2005) and Shorlin et al. (2004) scales corresponds on the 2MASS system to E(J–H) =, which provides a reasonable fit to the observed JHKs data. The corresponding fit in distance modulus is J–M, with very little scatter. Most of the uncertainty originates in the implied reddening. The implied intrinsic distance modulus for Shorlin 1 is –M, corresponding to a distance of kpc, a distance considerably smaller than the values obtained by Shorlin et al. (2004), Wallace et al. (2005), and Carraro & Costa (2009).
The UBV data are consistent with the JHKs results only if R is larger than traditional values near 3.1 (Turner, 1976b). The apparent distance moduli from ZAMS fitting in UBV and JHKs coincide only if . The good agreement of that result with the value of obtained independently from a variable-extinction analysis by Turner et al. (2005) for the extinction in nearby Ruprecht 91 suggests consistent (and “anomalous”) properties for the dust extinction across much of the Carina region, as also argued in many of the studies summarized in Table 1.
3 THE EXTINCTION LAW IN CARINA
Some caution is required when interpreting the results of Table 1, since each method used to derive R is subject to different sources of bias. The color difference method, for example, is susceptible to possible circumstellar emission, typical of luminous stars, which can produce excess emission in the far infrared, as well as to possible systematic effects arising from comparison of observed infrared colors with adopted intrinsic colors for the stars (e.g., Turner, 1994). The variable-extinction (VE) method, which by contrast is tied to ZAMS fitting for open clusters, is unaffected by circumstellar effects in stars. However, it can be biased by systematic and random errors in the photometry (Turner, 1976a) and by limited ranges of color excess for clusters studied, which unfortunately is the case for most clusters in the Carina region. UBV photometry also suffers from possible systematic offsets in U–B colors arising from the use of “non-standard” photometers and filter mismatches relative to the Johnson system (Moffat & Vogt, 1977) and from the observational treatment of atmospheric extinction (Cousins & Caldwell, 2001).
The wavelength of maximum interstellar polarization is related directly to mean particle size along the line of sight, and hence R-value, but can be biased by relatively nearby dust and what is known about its extinction properties (Whittet, 1979). The same problem arises with the use of color excess ratios. Do specific results apply to the dust producing variable extinction in the field, or to relatively nearby dust? The comparison of radio emission from the Carina nebula with Balmer line emission is reasonably straighforward, although concerns arise regarding whether or not the emission in the two wavelength regions can be treated in simple fashion, without regard to the patchy nature of the emission at visible wavelengths. In summary, many of the results presented in Table 1 may be quite reliable; others may not. A reasonable question to ask is: what circumstances would permit most of the results to be reliable?
An important consequence of the present results for Shorlin 1 is that they lead to specific predictions regarding the properties of dust extinction towards Carina. First, the possibility that throughout Carina implies that distances to clusters in the Eta Carinae region may all be overestimated, given that most studies have adopted a value of to correct for the effects of extinction on apparent distance moduli of the clusters. Second, since variations in R are invariably tied to color excess ratios describing the dust extinction (Turner, 1994, 1996), it is reasonable to expect unusual results for the reddening slope towards stars in Carina clusters. The latter complication is one reason why a previous study of R-values for open clusters in the Galaxy neglected most open clusters in the Carina region (Turner, 1976b).
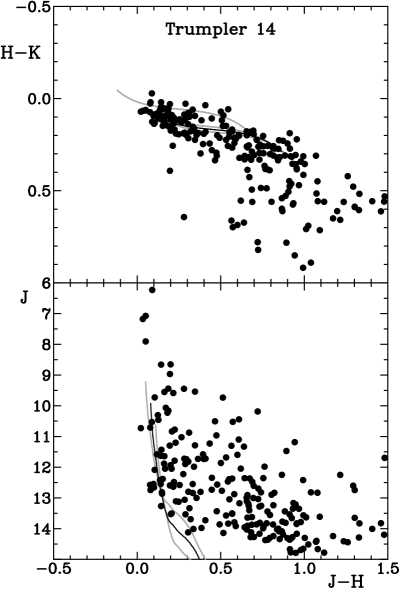
In order to test for the former effect, new estimates of distance and reddening were derived for open clusters in the Carina region using 2MASS photometry for the analysis, as done previously for a variety of open clusters (Turner et al., 2009a, b; Turner, 2011) and in this paper for Shorlin 1. Results of such an analysis are presented in Table 2, and illustrated in Fig. 7 for the example of Trumpler 14 (one of the eight clusters studied). In most cases the analysis was restricted to stars in the innermost of the cluster center, usually available from the WEBDA on-line open cluster data base. The coordinates for Cr 228, however, were those of Turner & Moffat (1980), i.e. 10:44:00, –60:05:00 (J2000), rather than what is cited in WEBDA. Also, Cr 232 is often considered to be linked with Tr 14 and Tr 16 in the literature, but in this study the cluster was taken to be the group of bright stars delineated by Turner & Moffat (1980). Fainter stars in the cluster region may be mainly coronal members of Tr 14 and Tr 16, as also indicated by the proper motion survey of Cudworth, Martin & DeGioia-Eastwood (1993), which implies that bright members of Cr 232 may be only kpc distant, as found here.
The newly-derived distances to open clusters in the Eta Carinae field, with the exception of Cr 232, all cluster around 2.1 kpc, the formal mean being kpc, as noted in Table 2. The literature estimates of distance to the same clusters, selected references for which are listed in Table 2, are consistently larger, as expected for studies in which was used to correct the apparent distance moduli for the effects of extinction. A more suitable comparison can be made with the estimated distance to Eta Carinae itself, for which nebular expansion parallaxes have been generated in recent years. Studies by Allen & Hillier (1993) and Smith (2006) led to estimated distances of kpc and kpc, respectively, for the distance to Eta Carinae from the geometry of the bipolar expansion of the Homunculus nebula around the star. Smith & Brooks (2008) summarize that as a distance of 2.3 kpc, accurate to . The good agreement with the JHKs distances to the star clusters in the Eta Carinae complex, particularly for the adjacent clusters Tr 14 and Tr 16, is what one expects if R is indeed anomalous in the region.
A second effect should be seen in the color excesses for stars populating the region. The methodology of Turner (1989) was applied here to stars belonging to the Carina clusters NGC 3324, NGC 3293, Tr 14, Tr 15, Tr 16, IC 2581, and Cr 228, where the spectral types and photoelectric UBV observations used in the analysis were taken from the WEBDA on-line data base. The results are displayed in Fig. 8. The scatter here is somewhat larger than that exhibited by the smaller starfields analyzed for the 1989 study, possibly because of errors in the assigned spectral types of some stars, but does lead to a reasonable interpretation. For stars of small color excess, and even for some of larger reddening, there is a reasonably good fit to a reddening slope of , whereas stars of large reddening are more reasonably matched to a reddening slope of , where the changeover from the former to the latter has been arbitrarily set at and 0.45 to provide reasonable eye fits to the data.
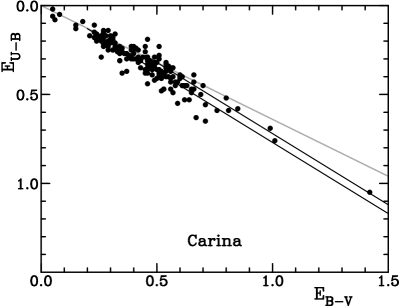
The nature of the trends in the data of Fig. 8 is that the foreground extinction is anomalous, and is described by and , whereas extinction arising in dust closer to the Eta Carinae complex itself is described by more “normal” extinction, i.e. and . The changeover occurs at different reddenings along individual lines of sight, presumably as a result of variations in optical depth for the anomalous foreground dust extinction, and may account for the individualistic estimates of R for separate cluster stars in some studies (Thé et al., 1980) as well as for the unusual scatter of the data points in Fig. 8. Apparently the “anomalous” dust in Carina is located foreground to the Carina arm, which must now be considered to be only kpc distant in this direction, rather than kpc distant as established previously.
In similar fashion, the group of stars associated with WR 38 and WR 38a, and referred to as Shorlin 1, must lie near the inside edge of the Carina-Sagittarius spiral arm, not well beyond it, given that the present study places it at a reduced distance of only kpc. An independent test of the spectroscopic data was made using the CCD UBV photometry of Massey & Johnson (1993) for a few of the clusters. The resulting scatter was only marginally greater than that in Fig. 8, and confirmed the results of the latter, but the sample size was smaller and therefore less useful to the analysis.
4 DISCUSSION
The newly-derived distance of kpc to Shorlin 1, which makes use of 2MASS JHKs observations of cluster stars, is significantly smaller than previous estimates that placed it kpc from the Sun (Shorlin, 1998; Shorlin et al., 2004; Wallace et al., 2005; Carraro & Costa, 2009). That is a consequence of “anomalous” extinction by local dust clouds, mainly within a kiloparsec, characterized by a ratio of total-to-selective extinction of . The larger distances estimates in previous studies are a systematic effect arising from analyzing the optical photometry for this heavily-reddened group using standard reddening and extinction relations. A small contradiction arises, given that the small dimensions of the cluster were used by Shorlin et al. (2004) as evidence for extreme distance. The implied cluster radius of from star counts (Fig. 4) corresponds to 1.1 pc at a distance of 2.94 kpc, less than half as large as the values that are typical of older, dynamically-evolved, open clusters (e.g., Wielen, 1971). But the star counts also imply that Shorlin 1 is unlikely to represent a true cluster, but is instead merely the trapezium-like remains of a previously-bound cluster with an implied age of only a few Myr, according to the likely presence of O-type stars within its boundaries.
The reddening implied for cluster members is reduced from to with a shallow reddening slope of , a value consistent with the larger-than-average value of R applying to foreground dust throughout the Carina field. A value of for foreground dust of varying optical depths along most sight lines in the Carina region, in combination with dust extinction with more “normal” parameters within the Carina arm itself, can account for the unusual distribution of and color excesses for early-type stars in Carina clusters (Fig. 8), as well as the unusual spread of R-estimates for Carina found in previous studies (e.g., Table 1). A consequence of the anomalous foreground extinction is that the distances to other star clusters in the Eta Carinae complex are reduced from kpc to values ranging from kpc to kpc, the distance found for Eta Carinae itself from its nebular expansion parallax (Allen & Hillier, 1993; Smith, 2006; Smith & Brooks, 2008). That clearly affects the interpretation of distances to other optical spiral arm features in the region. A case in point is the presently-inferred location of Shorlin 1 on the inside edge of the Sagittarius-Carina spiral arm according to its new distance, relative to a much more distant inferred location in an extension of the local or Perseus arms resulting from the studies by Shorlin et al. (2004) and Carraro & Costa (2009). Similar changes affect conclusions by Shara et al. (1991) about the location of Wolf-Rayet stars in Carina and by Moffat et al. (2002) and Wallace et al. (2005) regarding the distance to the starburst cluster NGC 3603, which lies closely adjacent to the field of Shorlin 1.
| Parameter | WR 38 | WR 38a |
|---|---|---|
| Spectral Type | WC4 | WN5 |
| v | +15.60 | +16.21 |
| b–v | +0.88 | +0.83 |
| u–b | +0.60 | |
| (b–v)0 | –0.32 | –0.37 |
| Mv | –3.14 | –2.53 |
| V(HST)adj | +15.45 | +15.55 |
| (B–V)(HST)adj | +1.20 | +1.18 |
| (U–B)(HST)adj | –0.04 | +0.01 |
| (B–V)(HST)0 | –0.26 | –0.24 |
| M(HST)V | –2.73 | –2.63 |
| V(STP)adj | +15.20 | +15.31 |
| (B–V)(STP)adj | +1.21 | +1.18 |
| (U–B)(STP)adj | –0.03 | +0.00 |
| (B–V)(STP)0 | –0.23 | –0.27 |
| M(STP)V | –2.90 | –2.79 |
The implied properties of the two Wolf-Rayet stars are also affected by the changes, primarily by the new reddening since R-values affect derived distances directly but have only a minor influence on luminosities derived from ZAMS fitting. If the same type of analysis is followed as in the study of Shorlin et al. (2004), then the narrow band ubv photometry of the two stars by Torres-Dodgen & Massey (1988), Smith, Shara & Moffat (1990), and Shara et al. (1991), and the combined broad band UBV photometry of Shorlin et al. (2004), Wallace et al. (2005), and Carraro & Costa (2009), generate the parameters given in Table 3, where the UBV values have been modified in approximate fashion to account for emission-line contamination. That was done by examining the narrow-band ubv observations of the Wolf-Rayet stars corrected for emission-line contamination and then adjusted to equivalent broad band UBV values with the relationships of Turner (1982), and comparing the resulting corrections , , and with those derived by Pyper (1966) for WC4 and WN5 stars. Small differences were found relative to the Pyper (1966) corrections, the best values for the corrections used here being +0.50, –0.02, and –0.40, respectively, for WC4, and +0.20, –0.02, and –0.20, respectively, for WN5. The adjusted values are cited separately for the Shorlin et al. (2004) scale (STP) and the Wallace et al. (2005) scale (HST). It is stressed that the values in Table 3 are of rather low precision, and a thorough, deep, photometric survey of Shorlin 1 and the two Wolf-Rayet stars should help to improve both the precision and accuracy of the cited values.
The equivalent reddening for in the narrow band system is , and generates the values given in the top portion of Table 3. The broad band magnitudes and colors in the lower portion were corrected according to the results derived previously in Figs. 3 and 4. The new values for the intrinsic parameters of the two Wolf-Rayet stars, in particular the implied intrinsic colors and visual luminosities near , are now in reasonably good agreement with parameters derived for Wolf-Rayet stars of similar ionization class in open clusters (see van der Hucht, 2001; Turner, 1982; Lundström & Stenholm, 1984), rather than being too blue and too luminous, as was previously the case when the stars were analyzed using extinction relations more typical of the Galactic mean (Shorlin et al., 2004). That would seem to be further support for the revised analysis of Shorlin 1 presented here.
ACKNOWLEDGEMENTS
This publication makes use of data products from the Two Micron All Sky Survey, which is a joint project of the University of Massachusetts and the Infrared Processing and Analysis Center/California Institute of Technology, funded by the National Aeronautics and Space Administration and the National Science Foundation.
References
- Allen & Hillier (1993) Allen, D.A., Hillier, D.J.: Proc. Astron. Soc. Aust. 10, 338 (1993)
- Baume et al. (2003) Baume, G., Vázquez, R.A., Carraro, G., Feinstein, A.: Astron. Astrophys. 402, 549 (2003)
- Carraro & Costa (2009) Carraro, G., Costa, E.: Astron. Astrophys. 493, 71 (2009)
- Clariá (1977) Clariá, J.J.: Astron. Astrophys. Suppl. 27, 145 (1977)
- Cousins & Caldwell (2001) Cousins, A.W.J., Caldwell, J.A.R.: Mon. Not. R. Astron. Soc. 323, 380 (2001)
- Cudworth et al. (1993) Cudworth, K.M., Martin, S.C., DeGioia-Eastwood, K.: Astron. J. 105, 1822 (1993)
- Cutri et al. (2003) Cutri, R.M., Skrutskie, M.F., van Dyk, S., et al.: The IRSA 2MASS All-Sky Point Source Catalog of Point Sources, NASA/IPAC Infrared Science Archive (2003)
- Dias et al. (2002) Dias, W.S., Alessi, B.S., Moitinho, A., Lépine, J.R.D.: Astron. Astrophys. 389, 871 (2002)
- Dolphin (2000) Dolphin, A.E.: Publ. Astron. Soc. Pacific 112, 1397 (2000)
- Feinstein (1969) Feinstein, A.: Mon. Not. R. Astron. Soc. 143, 273 (1969)
- Feinstein et al. (1973) Feinstein, A., Marraco, H.G., Muzzio, J.C.: Astron. Astrophys. Suppl. 12, 331 (1973)
- Feinstein et al. (1976) Feinstein, A., Marraco, H.G., Forte, J.C.: Astron. Astrophys. Suppl. 24, 389 (1976)
- Feinstein et al. (1980) Feinstein, A., FitzGerald, M.P., Moffat, A.F.J.: Astron. J. 85, 708 (1990)
- FitzGerald (1970) FitzGerald, M.P.: Astron. Astrophys. 4, 234 (1970)
- Forte (1978) Forte, J.C.: Astron. J. 83, 1199 (1978)
- Herbst (1975) Herbst, W.: Astron. J. 80, 498 (1975)
- Herbst (1976) Herbst, W.: Astrophys. J. 208, 923 (1976)
- Holtzman et al. (1995) Holtzman, J.A., Hester, J.J., Casertano, S., et al.: Publ. Astron. Soc. Pacific 107, 156 (1995)
- Johnson & Morgan (1955) Johnson, H.L., Morgan, W.W.: Astrophys. J. 122, 142 (1955)
- Kholopov (1969) Kholopov, P.N.: Soviet Astron. 12, 625 (1969)
- Lodén & Sundman (1972) Lodén, L.O., Sundman, A.: Astron. Astrophys. 20, 49 (1972)
- Lundström & Stenholm (1984) Lundström, I., Stenholm, B.: Astron. Astrophys. Suppl. 58, 163 (1984)
- Maeder & Meynet (1987) Maeder, A., Meynet, G.: Astron. Astrophys. 182, 243 (1987)
- Massey (1984) Massey, P.: Astrophys. J. 281, 789 (1984)
- Massey & Johnson (1993) Massey, P., Johnson, J.: Astron. J. 105, 980 (1993)
- Meynet et al. (1993) Meynet, G., Mermilliod, J.-C., Maeder, A.: Astron. Astrophys. Suppl. 98, 477 (1993)
- Moffat & Vogt (1977) Moffat, A.F.J., Vogt, N.: Publ. Astron. Soc. Pacific 89, 123 (1977)
- Moffat et al. (2002) Moffat, A.F.J., Corcoran, M.F., Stevens, I.R., et al.: Astrophys. J. 573, 191 (2002)
- Pyper (1966) Pyper, D.M.: Astrophys. J. 144, 13 (1966)
- Rodgers & Searle (1967) Rodgers, A.W., Searle, L.: Mon. Not. R. Astron. Soc. 135, 99 (1967)
- Saha et al. (2006) Saha, A., Thim, F., Tammann, G.A., Reindl, B., Sandage, A.: Astrophys. J. Suppl. 165, 108 (2006)
- Shara et al. (1991) Shara, M.M., Moffat, A.F.J., Smith, L.F., Potter, M.: Astron. J. 102, 716 (1991)
- Shorlin (1998) Shorlin, S.L.: M.Sc. Thesis, Saint Mary’s University (1998)
- Shorlin et al. (2004) Shorlin, S.L., Turner, D.G., Pedreros, M.H.: Publ. Astron. Soc. Pacific 116, 170 (2004)
- Skrutskie et al. (2006) Skrutskie, M.F., Cutri, R.M., Stiening, R. et al.: Astron. J. 131, 1163 (2006)
- Smith et al. (1990) Smith, L.F., Shara, M.M., Moffat, A.F.J.: Astrophys. J. 358, 229 (1990)
- Smith (2006) Smith, N.: Astrophys. J. 644, 1151 (2006)
- Smith & Brooks (2008) Smith, N., Brooks, K.J.: In: Reipurth B. (ed.) Handbook of Star Forming Regions Vol. II, ASP Monograph Publ., Vol. 5, p. 138 (2008)
- Smith (1987) Smith, R.G.: Mon. Not. R. Astron. Soc. 227, 943 (1987)
- Tapia et al. (2003) Tapia, M., Roth, M., Vázquez, R. A., Feinstein, A.: Mon. Not. R. Astron. Soc. 339, 44 (2003)
- Thé & Groot (1983) Thé, P. S., Groot, M.: Astron. Astrophys. 125, 75 (1983)
- Thé et al. (1980) Thé, P.S., Bakker, R., Tjin A Djie, H.R.E.: Astron. Astrophys. 89, 209 (1980)
- Torres-Dodgen & Massey (1988) Torres-Dodgen, A.V., Massey, P.: Astron. J. 96, 1076 (1988)
- Turner (1973) Turner, D.G.: Astron. J. 78, 597 (1973)
- Turner (1974) Turner, D.G.: Ph.D. thesis, Univ. Western Ontario (1974)
- Turner (1976a) Turner, D.G.; Astron. J. 81, 97 (1976a)
- Turner (1976b) Turner, D.G.: Astron. J. 81, 1125 (1976b)
- Turner (1977) Turner, D.G.: Astron. J. 82, 163 (1977)
- Turner (1978) Turner, D.G.: Astron. J. 83, 1081 (1978)
- Turner (1979) Turner, D.G.: Publ. Astron. Soc. Pacific 91, 642 (1979)
- Turner (1982) Turner, D.G.: In: De Loore C.W.H., Willis A.J. (eds.) Wolf-Rayet Stars: Observations, Physics, Evolution, IAU Symp. 99, p. 57 (1982)
- Turner (1986) Turner, D.G.: Astron. J. 92, 111 (1986)
- Turner (1989) Turner, D.G.: Astron. J. 98, 2300 (1989)
- Turner (1994) Turner, D.G.: Rev. Mex. Astron. Astrofis. 29, 163 (1994)
- Turner (1996) Turner, D.G.: In: Milone E.F., Mermilliod J.-C. (eds.) The Origins, Evolution, and Destinies of Binary Stars in Clusters, ASP Conf. Series 90, p. 443 (1996)
- Turner (2010) Turner, D.G.: Astrophys. Space Sci. 326, 219 (2010)
- Turner (2011) Turner, D.G.: Rev. Mex. Astron. Astrofis. 47, 127 (2011)
- Turner & Moffat (1980) Turner, D.G., Moffat, A.F.J.: Mon. Not. R. Astron. Soc. 192, 283 (1980)
- Turner et al. (1980) Turner, D.G., Grieve, G.R., Herbst, W., Harris, W.E.: Astron. J. 85, 1193 (1980)
- Turner et al. (2005) Turner, D.G., Forbes, D., van den Bergh, S., Younger, P.F., Berdnikov, L.N.: Astron. J. 130, 1194 (2005)
- Turner et al. (2009a) Turner, D.G., Forbes, D., Leonard, P.J.T., Abdel-Latif Abdel-Sabour, M., Majaess, D.J., Berdnikov, L.N.: Mon. Not. R. Astron. Soc. 397, 1046 (2009a)
- Turner et al. (2009b) Turner, D.G., Kovtyukh, V.V., Majaess, D.J., Lane, D.J., Moncrieff, K.E.: Astron. Nachr. 330, 807 (2009b)
- van der Hucht (2001) van der Hucht, K.A.: New Astron. Rev. 45, 135 (2001)
- Vázquez et al. (1996) Vázquez, R.A., Baume, G., Feinstein, A., Prado, P.: Astron. Astrophys. Suppl. 116, 75 (1996)
- Walborn (1995) Walborn, N.R.: Rev. Mex. Astron. Astrofis. Ser. Conf. 2, 51 (1995)
- Wallace et al. (2005) Wallace, D.J., Gies, D.R., Moffat, A.F.J., Shara, M.M., Niemela, V.S.: Astron. J. 130, 126 (2005)
- Whittet (1977) Whittet, D.C.B.: Mon. Not. R. Astron. Soc. 180, 29 (1977)
- Whittet (1979) Whittet, D.C.B.: Astron. Astrophys. 72, 370 (1979)
- Whittet & van Breda (1975) Whittet, D.C.B., van Breda, I.G.: Astrophys. Space Sci. 38, L3 (1975)
- Wielen (1971) Wielen, R.: Astrophys. Sp. Sci. 13, 300 (1971)