TrES-5: A Massive Jupiter-sized Planet Transiting A Cool G-dwarf
Abstract
We report the discovery of TrES-5, a massive hot Jupiter that transits the star GSC 03949-00967 every 1.48 days. From spectroscopy of the star we estimate a stellar effective temperature of K, and from high-precision , and photometry of the transit we constrain the ratio of the semi-major axis and the stellar radius to be . We compare these values to model stellar isochrones to obtain a stellar mass of . Based on this estimate and the photometric time series, we constrain the stellar radius to be and the planet radius to be . We model our radial-velocity data assuming a circular orbit and find a planetary mass of . Our radial-velocity observations rule out line-bisector variations that would indicate a specious detection resulting from a blend of an eclipsing binary system. TrES-5 orbits one of the faintest stars with transiting planets found to date from the ground and demonstrates that precise photometry and followup spectroscopy are possible, albeit challenging, even for such faint stars.
1 Introduction
Long before the initial discoveries of extrasolar planets around Sun-like stars by the Doppler technique (Latham et al., 1989; Mayor & Queloz, 1995), it was recognized that planets around other stars could also be detected photometrically if they transit their host stars (Struve, 1952). Transit observations can provide at least two crucial pieces of information: the planet’s size and orbital inclination. When combined with radial velocity data they can be used to derive the planet’s mass, surface gravity and density, and infer its internal structure and composition. Many other studies also become possible for transiting planets around bright host stars, including analysis of the planet’s atmosphere, temperature distribution, the presence of other bodies in the system, the spin-orbit alignment, etc. (see, e.g., Charbonneau et al., 2007).
The ever increasing number of discovered transiting planets, both from
ground-based surveys and from the Kepler and CoRoT missions
(Borucki et al., 2010; Baglin et al., 2009), shows the tremendous diversity of extrasolar planets
and planetary systems. Particularly interesting are the relations between
planetary mass, radius and orbital period, as well as the distribution of
planetary masses, as together they hold the key to understanding planetary
formation and evolution. The current summary of transiting exoplanets at
http://exoplanet.eu indicates that 70% of the transiting planets with
known masses have masses . This apparent
drop in the number of massive planets (noted also by Southworth et al., 2009) cannot
be explained by major selection effects. Massive planets are also large, and
thus easier to discover, unlike lower-mass planets, whose radius increases
monotonically with mass for non-irradiated planets with cores (Fortney et al., 2007).
We report here the discovery of the Jupiter-sized massive transiting planet TrES-5. The planet orbits one of the faintest star yet () with a transiting planet found from ground-based wide-field surveys, and is one of the very few planets found around stars fainter than , including the space-based Kepler and CoRoT missions. TrES-5 increases the relatively small number of well-characterized massive transiting planets. Such planets play an important rôle in the study of planet formation, migration and evolution (Chatterjee et al., 2008; Baraffe et al., 2010) and it has been suggested (Southworth et al., 2009) that the massive extrasolar planets form a different planet population than the lower-mass ones.
2 Photometry and Spectroscopy
We monitored a field in Cygnus with the Lowell Observatory Planet Search Survey Telescope (PSST, Dunham et al., 2004) and the STARE telescope on the Canary Islands in Spain, between UT 2007 July 15 and UT 2007 October 7. Both telescopes are part of TrES (the other two telescopes — Sleuth, at Palomar Observatory, and WATTS, in Texas, were not operational at that time). The same field was observed again in 2009 and 2010 by PSST alone. All images were reduced, and photometry and transit search carried out as described in Dunham et al. (2004). Altogether PSST observed 13 full and partial transit-like events of the star GSC 03949-00967. The object was at the very edge of the PSST field and because of the slightly different field size and scale the star was not observed by the STARE telescope. The depth and duration of the events were consistent with the transit of a Jupiter-sized planet across a K dwarf, and we undertook a program of followup observations to confirm the planetary nature of the object and measure its properties. The discovery light curve of TrES-5 is shown on Fig. 1
We carried out high-precision in-transit , , and -band photometry of TrES-5 using Lowell Observatory’s 0.8m, 1.1m Hall and 1.8m Perkins telescopes. We observed TrES-5 on UT 2009 November 17 with the 0.8m telescope with NASACam in Cousins (47 exposures), on UT 2010 June 5 and 2010 November 30 with the 1.1m Hall telescope with the NASA42 camera in Cousins and (87 and 108 exposures, respectively), and on UT 2010 September 5 with the 1.8m Perkins telescope with PRISM in Johnson and Cousins (64 and 57 exposures, respectively). For all data sets, we derived differential fluxes relative to a large ensemble of local comparison stars. The high-precision Lowell Observatory photometry is shown in Fig. 2.
In order to characterize the host star and provide an external check on the stellar parameters derived from the TRES spectra, we obtained off-transit photometry of the TrES-5 system on UT 2010 October 10 and 11 with the 1.05-m Hall telescope at Lowell Observatory in combination with a e2v CCD231 CCD detector. We calibrated the photometry using 6 standard fields from Landolt (1992). The results are listed in Table TrES-5: A Massive Jupiter-sized Planet Transiting A Cool G-dwarf together with other relevant data for the host star of TrES-5.
We observed the candidate with the Tillinghast Reflector Echelle Spectrograph (TRES; Fűrész, 2008), mounted on the 60-inch Tillinghast Reflector at Fred L. Whipple Observatory on Mt. Hopkins in Arizona from 2010 September to 2011 April. We obtained 8 spectra, each consisting of 51 echelle orders and spanning the wavelength range 3850-9100 Å, with a resolving power of . We obtained absolute radial velocities by cross-correlation against a synthetic template chosen from a large library of spectra based on Kurucz model atmospheres (see Nordström et al., 1994; Latham et al., 2002), calculated by John Laird and based on a linelist compiled by Jon Morse. These velocities have a typical precision of 0.2 km s-1. However, the synthetic spectra only span a small portion of the total wavelength range, centered on the Mg b triplet at Å. We derived precise relative velocities by taking advantage of the full spectrum, cross-correlating all orders against those of an observed template. For a description of the reduction and cross-correlation, see Buchhave et al. (2010), in which the details of the same reduction package are described, as applied to the Fiber-fed Echelle Spectrograph (FIES). The absolute gamma velocity, calculated using the weighted mean offset of the relative velocities from the corresponding absolute velocities, was determined to be km s-1. The absolute gamma velocity is onto the system in which HD 182488 is defined to have an absolute velocity of km s-1.
To derive the stellar atmospheric parameters, the observed spectra were cross-correlated against a grid of synthetic spectra drawn from the library of spectra described above. The synthetic spectra cover a window of Å centered near the gravity-sensitive Mg b triplet and have a spacing of K in effective temperature, 0.5 dex in gravity, 0.5 dex in metallicity and km s-1 in rotational velocity. The best matched template to the observed spectrum represents the best matched stellar parameters on the library grid. A new set of tools is then used to derive more precise stellar parameters from the normalized cross correlation peaks. A description of the tools will be published in Buchhave et al. (2011, in preparation).
We used the multicolor Johnson-Cousins photometry to form a variety of color indices, and used the color-temperature calibrations by Ramírez & Meléndez (2005) and Casagrande et al. (2006) to estimate the star’s effective temperature . The average result, K, is 228 K cooler than the spectroscopic value of K (see below). This result is not surprising as some reddening is expected at the object’s Galactic latitude of . From the match to stellar evolution models described below, we estimate a reddening of , which is in good agreement with the difference of 228 K between the spectroscopic and photometric effective temperatures.
3 Light Curve Analysis
We analyzed the five , and -band transit observations using the analytical expressions in Mandel & Agol (2002) to compute the model flux. We assumed a circular orbit and a quadratic stellar limb-darkening law, fixing the coefficients at the color-dependent values tabulated in Claret (2004) for the spectroscopically-estimated , , and . Initially we adoped as free parameters the orbital period and epoch , the ratio of the planet radius to the stellar radius , the square of the impact paramater , where is the semi-major axis of the planet’s orbit and is the orbital inclination, the parameter , which for zero eccentricity is related to via , and the zero point of the out-of-transit flux . This choice of parameters minimizes the correlation between and (see Bakos et al., 2007). We performed an initial fit using the high-precision followup transit photometry, after which we fixed all parameters except and to their values from the initial fit, and repeated the fit using both the PSST wide-field photometry and the followup photometry. This approach allowed us to utilize the entire baseline of over three years of observations and obtain more precise values for and than if only the followup photometry were used. We then fixed the values of and (stated in Table 3) in the subsequent analysis.
We performed a joint fit of all five transit light curves using the MPFIT package (Markwardt, 2008), and found the values of , , and that minimized the . This fit is shown with solid lines in Fig. 2. In order to estimate the errors of the fitted parameters, we conducted a Markov Chain Monte Carlo (MCMC) analysis (see Ford, 2005, and references therein). Altogether 10 independent Markov chains with points per chain were created, each chain starting from a random perturbation of the best-fit parameters. We discarded the first 20% of the points to minimize the impact of the initial conditions. The resulting histograms of values were used to obtain the mode and the 68.3% lower and upper confidence limits and for each parameter. We then adopted the mode as the final, optimal value of the parameter, and the value of as its 1- error (encompassing 68.3% of the parameter values around the mode). The use of a single number to characterize the width of each parameter’s distribution is justified by the nearly Gaussian, symmetric shape of all histograms.
4 Properties of TrES-5 And Its Star
The mass and radius of the host star of TrES-5, required for establishing the planet properties, were determined on the basis of the spectroscopic and , and the value of derived from the light curve fit described above. The quantity is closely related to the stellar density, and is determined in this case with higher relative precision than . It is therefore a better proxy for luminosity (see Sozzetti et al., 2007).
We used an iterative procedure to determine the star’s parameters, similar to the one described in Torres et al. (2008). Using the stellar evolution models from the series by Yi et al. (2001), we computed isochrones over a range in stellar age, from 0.1 Gy to 12 Gy, over the metallicity range allowed by the spectroscopy. We compared the measured and from the light curve fit to the computed values of and along each isochrone and recorded the points on the isochrone which matched the measured quantities within their errors. We then calculated the weighted mean of all matches, with weights inversely proportional to the exponent of the distance (in sense) between the observed and model values of , and (see Torres et al., 2008).
This procedure yields a value of which is better constrained than the spectroscopic estimate. With the value of fixed, revised estimates of and were derived from the spectra, and the light curve fit repeated. The new values of and (from spectroscopy), and (from the fit) were again compared to the stellar models to obtain the final values of , , , and age of Gy.
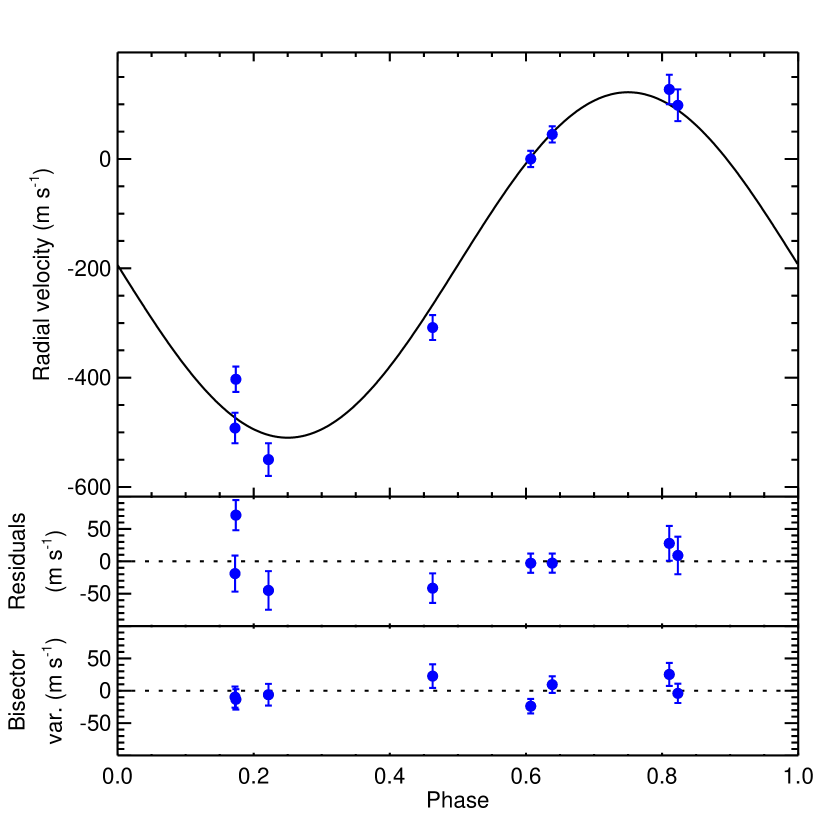
We fit a Keplerian orbit to these data assuming zero eccentricity as a good first approximation, as expected from theoretical arguments for a period as short as 1.48 days. The period and epoch were held fixed. The RMS of this fit is 24.2 m s-1, which is similar to the internal errors of the velocities. The parameters of this orbital solution are listed in Table 3. The orbit is displayed in Fig. 3 (top panel) along with the observations, and the residuals are shown in the middle panel.
We investigated the possibility that the radial velocities we measured are the result of distortions in the line profiles due to contamination from an unresolved eclipsing binary (Santos et al., 2002; Torres et al., 2005) or star spots (Toner & Gray, 1988), instead of being due to true Doppler motion in response to a planetary companion. We cross-correlated each TRES spectrum against a synthetic template matching the properties of the star, and averaged the correlation functions over the orders. From this representation of the average spectral line profile we computed the mean bisectors, and as a measure of the line asymmetry we calculated the “bisector spans” as the velocity difference between points selected near the top and bottom of the mean bisectors (Toner & Gray, 1988; Torres et al., 2005). If the velocities were the result of a blend with an eclipsing binary (Mandushev et al., 2005) or star spots (Queloz et al., 2001), we would expect the line bisectors to vary in phase with the photometric period with an amplitude similar to that of the velocities. Instead, we detect no variation in excess of the measurement uncertainties (see Fig. 3, bottom panel), and we conclude that the velocity variations are real and that the star is orbited by a Jovian planet.
5 Discussion
TrES-5 orbits one of the faintest host stars with transiting planets found to date. The discovery demonstrates that precise photometry and spectroscopy are possible from the ground even for such faint stars, although some followup studies will be more challenging. With a period of only days, TrES-5 is a classical “hot Jupiter”, although the relatively cool host star ( K) places it near the upper (hotter) end of the transition zone between the “pM class” and “pL class” planets proposed in Fortney et al. (2008). In such planets the importance of gaseous TiO and VO absorption is diminished, temperature inversion may not be present, and the flux from the host star is more evenly distributed around the planet and inside its interior. Because of its location near the pM/pL boundary, TrES-5 could be a suitable object for testing the models of planetary atmospheres.
At TrES-5 is above the upper quartile of the planetary mass distribution. The mass and radius of TrES-5 are in good agreement with the theoretical mass-radius relations for irradiated planets (Fortney et al., 2007; Hansen & Barman, 2007). For an age of 7.5 Gyr, planetary mass of and equilibrium temperature of K, the predicted radius of the planet is , which is in good agreement with the observed value. Thus, TrES-5 does not appear to have the anomalously large radius of many close-in giant exoplanets. A comparison with the planetary models of Fortney et al. (2007) for the mass, age and semimajor axis of TrES-5 indicates that the planet is best approximated by a model with no heavy-elements core.
It has been noted that many massive planets have non-zero eccentricity even at
short periods (Southworth et al., 2009). Using the current catalog of transiting planets
at http://exoplanet.eu, we find that over a third of the short-period,
massive planets ( days and ) have non-zero
eccentricities. In our radial velocity fit we have assumed based on the
short period of TrES-5 and theoretical arguments about the time scales of
tidal interactions (Zahn & Bouchet, 1989). Our radial velocities clearly reject large
eccentricities. From MCMC analysis of the radial velocity data, we find that
the prefered orbital solution has . We therefore
adopt for the orbit of TrES-5, but we cannot rule out a small
eccentricity (). A future detection of the secondary eclipse will
help constrain the orbital eccentricity much better, as well as test for the
presence of temperature inversion in the atmosphere of TrES-5.
References
- Baglin et al. (2009) Baglin, A., Auvergne, M., Barge, P., et al. 2009, in Transiting Planets, Proc. IAU Symp. 253, 71
- Bakos et al. (2007) Bakos, G. Á., et al. 2007, ApJ, 671, L173
- Baraffe et al. (2010) Baraffe, I., Chabrier, G., & Barman, T. 2010, Rep. Prog. Phys., 73, 016901
- Borucki et al. (2010) Borucki, W. J., et al. 2010, Science, 327, 977
- Buchhave et al. (2010) Buchhave, L. A., et al. 2010, ApJ, 720, 1118
- Casagrande et al. (2006) Casagrande, L., Portinari, L., & Flynn, C. 2006, MNRAS, 373, 13
- Charbonneau et al. (2007) Charbonneau, D., Brown, T. M., Burrows, A., & Laughlin, G. 2007, in Protostars and Planets V, eds. B. Reipurth, D. Jewitt, & K. Keil, (Tucson: University of Arizona Press), 701
- Claret (2004) Claret, A. 2004, A&A, 428, 1001
- Cox (2000) Cox, A. N. (editor), Allen’s Astrophysical Quantities, 4th Edition (New York: AIP Press Springer-Verlag), p. 295
- Chatterjee et al. (2008) Chatterjee, S., Ford, E. B., Matsumura, S., & Rasio, F. A. 2008, ApJ, 686, 580
- Dunham et al. (2004) Dunham, E. W., Mandushev, G., Taylor, B., & Oetiker, B. 2004, PASP, 116, 1072
- Ford (2005) Ford, E. B. 2005, AJ, 129, 1706
- Fortney et al. (2007) Fortney, J. J., Marley, M. S., & Barnes, J. W. 2007, ApJ, 659, 1661
- Fortney et al. (2008) Fortney, J. J., Lodders, K., Marley, M. S., & Freedman, R. S. 2008, ApJ, 678, 1419
- Fűrész (2008) Fűrész, G. 2008, Ph.D. thesis, University of Szeged, Hungary
- Hansen & Barman (2007) Hansen, B. M. S., & Barman, T. 2007, ApJ, 671, 861
- Landolt (1992) Landolt, A. U. 1992, AJ, 104, 340
- Latham et al. (1989) Latham, D. W., Stefanik, R. P., Mazeh, T., Mayor, M., & Burki, G. 1989, Nature, 339, 38
- Latham et al. (2002) Latham, D. W., Stefanik, R. P., Torres, G., Davis, R. J., Mazeh, T., Carney, B. W., Laird, J. B., & Morse, J. A. 2002, AJ, 124, 1144
- Mandel & Agol (2002) Mandel, K., & Agol, E. 2002, ApJ, 580, L171
- Mandushev et al. (2005) Mandushev, G., Torres, G., Latham, D. W., et al. 2005, ApJ, 621, 1061
- Markwardt (2008) Markwardt, C. B. 2008, in Astronomical Data Analysis Software and Systems XVIII, ASP Conf. Ser. 411, eds. D. Bohlender, P. Dowler & D. Durand (San Francisco: ASP), 251
- Mayor & Queloz (1995) Mayor, M. & Queloz, D. 1995, Nature, 378, 355
- Nordström et al. (1994) Nordström, B., Latham, D. W., Morse, J. A., Milone, A. A. E., Kurucz, R. L., Andersen, J., & Stefanik, R. P. 1994, A&A, 287, 338
- O’Donovan et al. (2007) O’Donovan, F. T., et al. 2007, ApJ, 663, L37
- Queloz et al. (2001) Queloz, D., et al. 2001, A&A, 379, 279
- Ramírez & Meléndez (2005) Ramírez, I., & Meléndez, J. 2005, ApJ, 626, 465
- Santos et al. (2002) Santos, N. C. et al. 2002, A&A, 392, 215
- Skrutskie et al. (2006) Skrutskie, M. F., et al. 2006, AJ, 131, 1163
- Southworth et al. (2009) Southworth, J., et al. 2009, ApJ, 707, 167
- Sozzetti et al. (2007) Sozzetti, A., Torres, G., Charbonneau, D., Latham, D. W., Holman, M. J., Winn, J. N., Laird, J. B., & O’Donovan, F. T. 2007, ApJ, 664, 1190
- Struve (1952) Struve, O. 1952, The Observatory, 72, 199
- Toner & Gray (1988) Toner, G. G. & Gray, D. F. 1988, ApJ, 334, 1008
- Torres et al. (2005) Torres, G., Konacki, M., Sasselov, D. D., & Jha, S. 2005, ApJ, 619, 558
- Torres et al. (2008) Torres, G., Winn, J. N., & Holman, M. J. 2008, ApJ, 677, 1324
- Yi et al. (2001) Yi, S. K., Demarque, P., Kim, Y.-C., Lee, Y.-W., Ree, C. H., Lejeune, T., & Barnes, S. 2001, ApJS, 136, 417
- Zacharias et al. (2010) Zacharias, N., et al. 2010, AJ, 139, 2184
- Zahn & Bouchet (1989) Zahn, J.-P. & Bouchet, L. 1989, A&A, 223, 112


| HJD | RV (m s-1) |
|---|---|
| 2455456.847578 | |
| 2455468.707361 | |
| 2455647.005138 | |
| 2455649.002656 | |
| 2455651.985839 | |
| 2455659.987762 | |
| 2455667.970142 | |
| 2455673.945954 |
| Parameter | Units | Value | |
|---|---|---|---|
| days | |||
| HJD | |||
| AU | |||
| deg | |||
| m s-1 | |||
| K | |||
Note. — kg (Jupiter’s mass); m (Jupiter’s equatorial radius) (Cox, 2000)