Math. Model. Nat. Phenom.
Vol. XX, No. XX, 2012, pp. XX–XX
Simple Model of Shape Evolution of Desiccated Colloidal Sessile Drop
Yu. Yu. Tarasevich111Corresponding author. E-mail: tarasevich@aspu.ru, I. V. Vodolazskaya, and O. P. Isakova
Institute of Physics and Mathematics, Astrakhan State University, 414056 Astrakhan, Russia
Abstract. We propose simple model of colloidal sessile drop desiccation. The model describes correctly both evolution of the phase boundary between sol and gel inside such a drop and the final shape of the dried film (deposit). The model is based on mass conservation and natural assumption that deposit (gel phase) prevents flows and evaporation.
Key words: sessile drop, colloid, desiccation, phase boundary, mass conservation, mass transfer, flow
AMS subject classification: 68U20, 76T20, 76B07
1. Motivation
During last decade, the drying of particle-laden sessile drops attracts much attention from the scientific community because of numerous applications. First of all one should refer to the important surface-patterning technique known as evaporation-induced self-assembly (EISA) or evaporation driven self-assembly (EDSA), ink-jet printing, coating technologies, spotting technologies for bio-assays, etc.
As a rule, the particle-laden sessile drops desiccate with pinned contact line. The outward flow occurs inside the drop and carries the particles to the drop edge. The ring-like deposit remains on the substrate [5, 6].
There may be two very different situations when a particle-laden sessile drop desiccates. First, the particles inside such a drop may interact with each other only pure mechanically (impacts). In this case, the deposit forms a porous medium. This medium prevents neither bulk flow inside it nor evaporation from its free surface. Second, the particles may form chemical bonds. In the last case, a phase transition may occur (e.g., sol to gel). The new phase blocks any flows, the solvent evaporation from such a phase is negligible. The proposed models mainly deal with the first situation [2, 4, 5, 7, 9, 10, 14, 15, 17, 18, 30, 31, 33]. Only several models treat the deposit as impenetrable for flows and inhibiting evaporation [13, 14, 28, 29]. Nevertheless, the simulation of desiccated colloidal drops with phase transition is extremely important for high-throughput drag screening [24], biostabilization [19], and medical tests [20, 21, 22]. The models [13, 14, 28, 29] utilize the sets of rather complicated PDE’s. We propose alternative very simple but efficient model.
There are three different modes of colloidal sessile drop desiccation [16]:
-
1.
, where is the gelation time and is the desiccation time. The gelled phase occurs near the drop edge and moves inward while the central area of the drop remains liquid.
-
2.
. The gelled skin covers the free drop surfaces. This thin shell cannot prevent evaporation of the solvent. The buckling instability occurs.
-
3.
. The phase transition from sol to gel in the whole bulk of the drop is almost instantaneous. The gelled drop loses solvent via evaporation very slow.
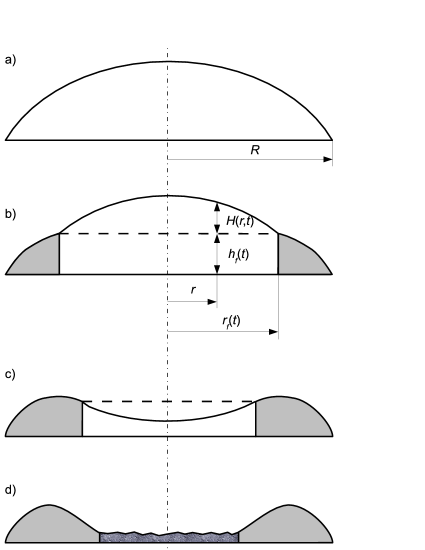
The mode of our interest is the first one. In this particular case, the desiccation process can be divided into several stages.
-
1.
Initial single-phase liquid stage (Figure 1a). The whole drop is a sol. The outward flow carries suspended particles to the drop edge until volume fraction of the suspended particles, , reaches critical value, . Note that particle-enriched region is extremely narrow whereas the particle volume fraction in central area of the drop is almost constant along its radius [25, 26, 27].
- 2.
-
3.
Final single-phase solid stage (Figure 1d). The gelled deposit loses the rest of moisture and cracks. The real fluids of interests (e.g., biological fluids) may content both suspended particles and dissolved substances. In this case, the dendritic crystals may occur in the central area of a sample [1, 24].
2. Model description
2.1. Main assumptions
We consider a colloidal (nano- or microparticle-laden) sessile drop deposited on horizontal solid impermeable substrate. The drop is axisymmetric. In our consideration, we suppose
-
1.
The liquid is incompressible.
-
2.
The contact line is pinned during the desiccation.
-
3.
Free surface of the liquid phase is a spherical cap. This assumption is valid for the sufficient small drops when Bond number is much smaller than unity and rather slow flows when capillary number is small.
- 4.
-
5.
Any hydrodynamical flows inside gelled phase are absent. This statement can be concluded from the simple observation that gelled ring cracks (see, e.g., [1], i.e. there is not any flow to prevent moisture loss even by very slow evaporation.
-
6.
The drop apex height as well the drop mass decrease almost linearly up to full gelation [1].
-
7.
The phase boundary is vertical. Volume fraction of the colloidal particles is in the liquid (sol) phase and constant in the solid (gel) phase. This assumption is supported by our simulations [28].
-
8.
Sedimentation is negligible.
2.2. Governing equations
In the cylindrical coordinates, free surface of the liquid phase, , is described by the equation
where is the height of the phase boundary between sol and gel, is the radial coordinate of the phase front, is the profile of the free surface above liquid (sol) phase and (see Figure 1b).
The conservation of solute yields
| (2.1) |
All quantities, , , , are the functions of time, . We omit arguments here and below to simplify notation.
The conservation of solvent yields
| (2.2) |
where is the density of solution.
In spite of the fact that during evaporation, drop mass decrease looks almost linearly [1, 3, 23, 32], deviation of the evaporation rate from constant is fairly visible [23]. We suppose that evaporation rate is proportional to the area of free liquid surface and decreases when volume fraction of colloidal particles increases
| (2.4) |
To our best knowledge, the experiments regarding density of vapor flux above two-phase desiccated sessile drops are not performed yet, so reasonableness of our choice (2.4) can be examined only by simulations.
Mass conservation for the solution can be rewritten as
| (2.5) |
We suppose
| (2.6) |
where constant is the rate of apex height decrease for a drop of pure solvent. Our assumption is supported by experiments (see, e.g., [1, 23]).
From physical point of view, contact angle between sol, gel, and air, , have to be constant for arbitrary position of the phase boundary, if the volume fraction of colloidal particles inside liquid phase is fixed. Obviously, for the high concentrated colloids (), have to tend to zero. Contrary, for the dilute colloids (), , where is the contact angle between gel, air, and pure solvent. We assume
| (2.7) |
In fact, this speculation is valid for the static equilibrium of the phases. If the phase boundary moves, not only surface tension, but viscous forces should be involved into consideration. Unfortunately, to our best knowledge, there is not any published measurements of , thus, it is an adjustable parameter in our model.
At the point A with the coordinates , angle between tangent line to the liquid phase and horizon, angle between tangent line to the gelled phase and horizon (see Figure 2) can be found from the relation
| (2.8) |
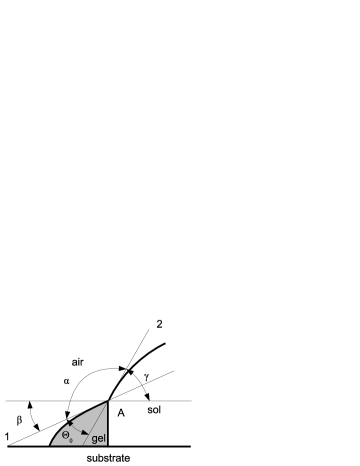
It is clear, that
| (2.9) |
and (see Figure 2). Hence, from (2.8) and (2.9) yields
| (2.10) |
where is defined by Equation 2.7.
Set of equations (2.1), (2.5), (2.6), (2.7), (2.10) is complete and allows calculate the shape of two-phase colloidal drop and volume fraction of colloidal particles inside sol at any time.
It is convenient to measure all lengths in units of initial drop radius (radius of its constant base). In this case .
2.3. Parameters of the model
It is rather difficult to extract necessary information from the published experimental data.
To estimate parameters of the model, we use, particularly, the data about desiccation of drops of a phosphate buffered saline solution (, ionic strength M) of bovine serum albumin (BSA) [1]. For the concentration of BSA 40 gl-1, initial drop mass is about 15 mg, initial height is about 1.5 mm, and drop radius is about 2.5 mm. Thus, initial ratio of height to radius is about 0.6. Central zone of the deposit is flat and its height is m. Thus, ratio of final deposit height to the initial drop height is about 0.024. For the concentration of BSA 60 gl-1, central part of the deposit is about 60 m, while the rim is about 80 m.
For the drop with radius 1.75 mm and concentration of albumen 100 gl-1, the heights of the dip and rim are about 15 and 35 m, respectively [8].
For the drops of native blood plasma and radius 3–3.5 mm, the heights of the dip and rim are about 10 and 20–40 m, respectively [11].
In our computation, initial volume fraction of colloidal particles varies from 0.04 to 0.4, and ratio of initial drop height, to its radius varies from 0.06 to 0.6.
3. Results
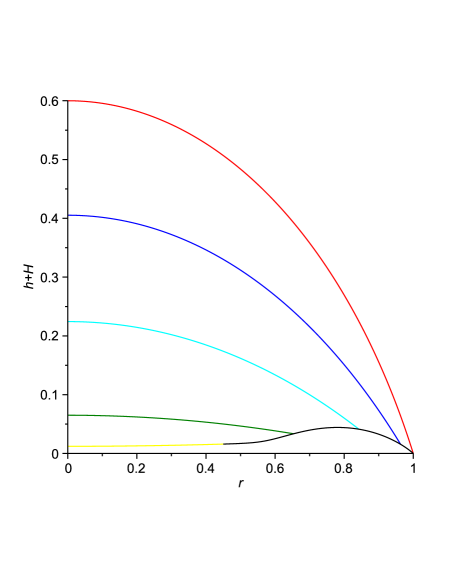
Figure 3 demonstrates our simulations for , . Evaporation rate is , velocity of apex decreasing is , and adjustable parameter is . Different profiles correspond (from up to down) to the initial time (), , , , and . Final profile of the gelled film is close to the experimentally observed [1, 8, 11].
Dynamics of volume fraction of the colloidal particles looks like reported by Sobac and Brutin in [23]. The experiment [23] shows rather sharp decreasing of the drying rate, , when the system changes from two-phase (sol and gel) to one-phase (gel). Unfortunately, our computations of drying rate don’t demonstrate the same excellent agreement with the experiment, i.e. drying rate decreases monotonically. We suppose the results of simulations may be improved by means of more accurate definition of (2.4).
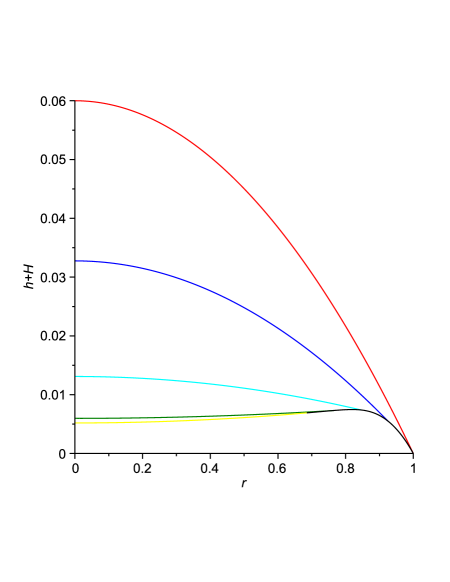
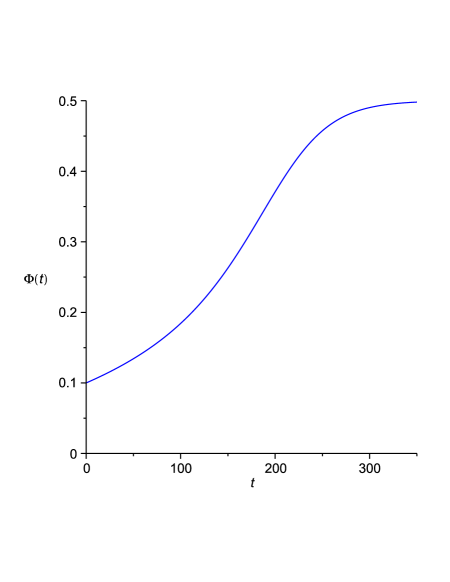
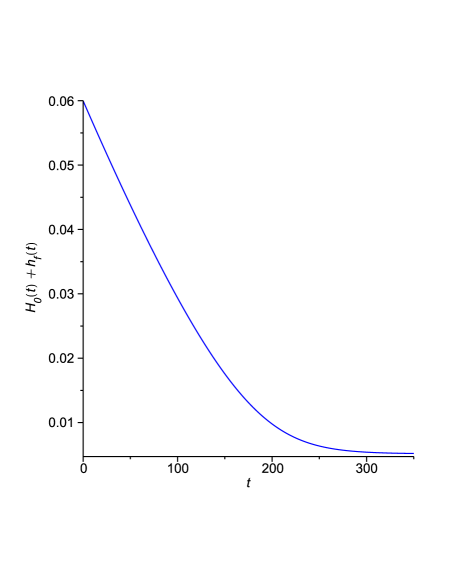
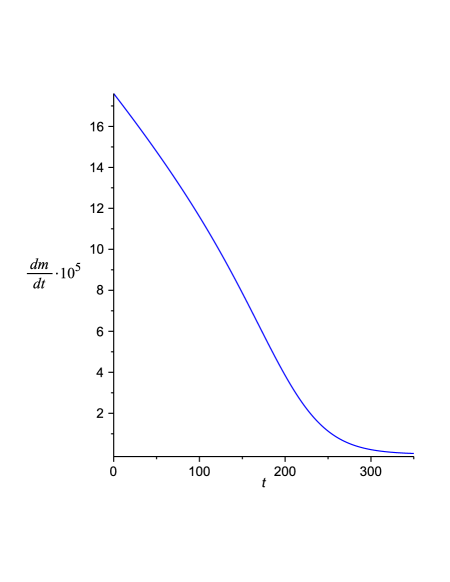
Figure 4 shows evolution of the drop during desiccation if initial volume fraction of the suspended colloidal particles is 0.04 and the drop is rather thick (). These parameters correspond to the experiments by Annarelli et al. [1]. Adjustable parameter is . Instants are the same as in Figure 3.
4. Conclusion
Proposed semiempirical model give simple explanation of the colloidal sessile drop desiccation. The results obtained for the parameters corresponding blood serum are consistent with experiments. The model allows to describe correctly the final shape of the dried film (deposit).
Acknowledgements
The authors are grateful to the Russian Foundation for Basic Research for the financial support (grant 09-08-97010-r_povolzhje_a).
References
- [1] C. C. Annarelli, J. Fornazero, J. Bert, J. Colombani, Crack patterns in drying protein solution drops, The European Physical Journal E, 5, (2001), No. 5, 599–603.
- [2] R. Bhardwaj, X. Fang, D. Attinger, Pattern formation during the evaporation of a colloidal nanoliter drop: a numerical and experimental study, New Journal of Physics, 11, (2009), No. 7, 075020.
- [3] D. Brutin, B. Sobac, B. Loquet, J. Sampol, Pattern formation in drying drops of blood, Journal of Fluid Mechanics, 667, (2011), 85–95.
- [4] R. V. Craster, O. K. Matar, K. Sefiane, Pinning, retraction, and terracing of evaporating droplets containing nanoparticles, Langmuir, 25, (2009), No. 6, 3601–3609.
- [5] R. D. Deegan, O. Bakajin, T. F. Dupont, G. Huber, S. R. Nagel, T. A. Witten, Contact line deposits in an evaporating drop, Physical Review E, 62, (2000), No. 1, 756–765.
- [6] R. D. Deegan, O. Bakajin, T. F. Dupont, G. Huber, S. R. Nagel, T. A. Witten, Capillary flow as the cause of ring stains from dried liquid drops, Nature, 389, (1997), No. 6653, 827–829.
- [7] B. J. Fischer, Particle convection in an evaporating colloidal droplet, Langmuir, 18, (2002), No. 1, 60–67.
- [8] A. L. Kalyanov, V. V. Lychagov, L. I. Malinova, A. A. Paiziev, V. P. Ryabukho, Low-Coherence Full-Field Interferometry of Volume Structure of Crystallised Soline Solution of Protein, Computer optics, 34, (2010), No. 1, 90–100, in Russian.
- [9] H.-S. Kim, S. Park, F. Hagelberg, Computational approach to drying a nanoparticle-suspended liquid droplet, Journal of Nanoparticle Research, (2010), 1–10.
- [10] A. V. Kistovich, Yu. D. Chashechkin, V. V. Shabalin, Formation mechanism of a circumferential roller in a drying biofluid drop, Technical Physics, 55, (2010), 473–478.
- [11] V. V. Lychagov, A. L. Kal’yanov, V. P. Ryabukho, Low-coherence interference microscopy of the internal structure of crystallized blood plasma, Optics and Spectroscopy, 107, (2009), 859–865.
- [12] T. Okuzono, N. Aoki, T. Kajiya, M. Doi, Effects of gelation on the evaporation rate of polymer solutions, J. Phys. Soc. Jpn., 79, (2010), No. 9, 094801.
- [13] T. Okuzono, M. Kobayashi, M. Doi, Final shape of a drying thin film, Physical Review E, 80, (2009), No. 2, 021603.
- [14] K. Ozawa, E. Nishitani, M. Doi, Modeling of the drying process of liquid droplet to form thin film, Japanese Journal of Applied Physics, 44, (2005), 4229–4234.
- [15] F. Parisse, C. Allain, Shape changes of colloidal suspension droplets during drying, J. Phys. II France, 6, (1996), No. 7, 1111–1119.
- [16] L. Pauchard, F. Parisse, C. Allain, Influence of salt content on crack patterns formed through colloidal suspension desiccation, Physical Review E, 59, (1999), No. 3, 3737–3740.
- [17] A. J. Petsi, A. N. Kalarakis, V. N. Burganos, Deposition of brownian particles during evaporation of two-dimensional sessile droplets, Chemical Engineering Science, 65, (2010), No. 10, 2978–2989.
- [18] Y. O. Popov, Evaporative deposition patterns: Spatial dimensions of the deposit, Physical Review E, 71, (2005), No. 3, 036313.
- [19] V. Ragoonanan, A. Aksan, Heterogeneity in desiccated solutions: Implications for biostabilization, Biophysical Journal, 94, (2008), No. 6, 2212–2227.
- [20] E. Rapis, Protein and life (self-assembling and symmetry of protein nanostructures), Philobiblion and Milta-PKPGIT, Jerusalem and Moscow, 2003, in Russian.
- [21] L. V. Savina, Crystalloscopic structures of blood serum of healthy people and patients, Sov. Kuban, Krasnodar, 1999, in Russian.
- [22] V. N. Shabalin, S. N. Shatohina, Morphology of human biological fluids, Khrizostom, Moscow, 2001, in Russian.
- [23] B. Sobac, D. Brutin, Structural and evaporative evolutions in desiccating sessile drops of blood, Phys. Rev. E, 84, (2011), No. 1, 011603.
- [24] P. Takhistov, H.C. Chang, Complex stain morphologies, Industrial & Engineering Chemistry Research, 41, (2002), No. 25, 6256–6269.
- [25] Yu. Yu. Tarasevich, O. P. Isakova, V. V. Kondukhov, A. V. Savitskaya, Effect of evaporation conditions on the spatial redistribution of components in an evaporating liquid drop on a horizontal solid substrate, Technical Physics, 55, (2010), 636–644.
- [26] Yu. Yu. Tarasevich, D. M. Pravoslavnova, Drying of a multicomponent solution drop on a solid substrate: Qualitative analysis, Technical Physics, 52, (2007), 159–163.
- [27] Yu. Yu. Tarasevich, D. M. Pravoslavnova, Segregation in desiccated sessile drops of biological fluids, The European Physical Journal E, 22, (2007), No. 4, 311–314.
- [28] Yu. Yu. Tarasevich, I. V. Vodolazskaya, O. P. Isakova, Desiccating colloidal sessile drop: dynamics of shape and concentration, Colloid & Polymer Science, 289, (2011), 1015–1023.
- [29] I. V. Vodolazskaya, Yu. Yu. Tarasevich, The model of drying sessile drop of colloidal solution, Modern Physics Letters B (MPLB), 25, (2011), No. 15, 1303–1310.
- [30] E. Widjaja, M. Harris, Particle deposition study during sessile drop evaporation, AIChE J., 54, (2008), No. 9, 2250–2260.
- [31] T. A. Witten, Robust fadeout profile of an evaporation stain, EPL (Europhysics Letters), 86, (2009), No. 6, 64002.
- [32] T. Yakhno, V. Kazakov, O. Sanina, A. Sanin, V. Yakhno, Drops of biological fluids drying on a hard substrate: Variation of the morphology, weight, temperature, and mechanical properties, Technical Physics, 55, (2010), 929–935.
- [33] R. Zheng, A study of the evaporative deposition process: Pipes and truncated transport dynamics, The European Physical Journal E: Soft Matter and Biological Physics, 29, (2009), 205–218.