11email: xhsun@nao.cas.cn 22institutetext: Max-Planck-Institut für Radioastronomie, Auf dem Hügel 69, 53121 Bonn, Germany
22email: wreich@mpifr-bonn.mpg.de
New 6 cm and 11 cm observations of the supernova remnant CTA 1
Abstract
Aims. We attempt to study spatial variations of the spectrum and rotation measures (RMs) of the large diameter, high-latitude supernova remnant (SNR) CTA 1.
Methods. We conducted new 6 cm and 11 cm observations of CTA 1 using the Urumqi 25-m and Effelsberg 100-m telescopes. Data at other wavelengths were included to investigate the spectrum and polarisation properties.
Results. We obtained new total intensity and polarisation maps at 6 cm and 11 cm with angular resolutions of and , respectively. We derived a spectral index of () based on the integrated flux densities at 408 MHz, 1420 MHz, 2639 MHz, and 4800 MHz. The spectral index map calculated from data at the four frequencies shows a clear steepening of the spectrum from the strong shell emission towards the north-western breakout region with weak diffuse emission. The decrease of the spectral index is up to about . The RM map derived from polarisation data at 6 cm and 11 cm shows a sharp transition between positive RMs in the north-eastern and negative RMs in the south-western part of the SNR. We note a corresponding RM pattern of extragalactic sources and propose the existence of a large-diameter Faraday screen in front of CTA 1, which covers the north-eastern part of the SNR. The RM of the Faraday screen is estimated to be about +45 rad m-2. A RM structure function of CTA 1 indicates a very regular magnetic field within the Faraday screen, which is larger than about 2.7 G in case of 500 pc distance.
Conclusions. CTA 1 is a large-diameter shell-type SNR located out of the Galactic plane, which makes it an ideal object to study its properties without suffering confusion. The rare breakout phenomenon known for CTA 1 is confirmed. We identify a Faraday screen partly covering CTA 1 with a regular magnetic field in the opposite direction to the interstellar magnetic field. The detection of Faraday screens in the Galactic plane is quite common, but is difficult at high latitudes where the polarisation angles of weak polarised background emission are rotated. RMs from extragalactic sources are needed for this purpose, although the number density of extragalactic RMs is still small despite of significant observational progress.
Key Words.:
ISM: supernova remnants – Polarisation – Radio continuum: general – Methods: observational1 Introduction
The supernova remnant (SNR) CTA 1 (G119.5+10.2) was discovered by Harris & Roberts (1960). Since then extensive observations at radio, optical, and X-ray bands have been made. Radio maps at high-angular resolution were observed with the Effelsberg 100-m telescope at 1720 MHz and 2695 MHz (Sieber et al. 1979, 1981) and with the DRAO synthesis array combined with data from the Effelsberg 100-m telescope at 408 MHz and 1420 MHz (Pineault et al. 1993, 1997). CTA 1 shows a well-defined semi-circular shell towards the south-east and weak diffuse emission towards the north-west. Optical observations revealed strong [O III] filaments, which generally coincide with the radio shell (Fesen et al. 1981, 1983; Mavromatakis et al. 2000). Strong centre-filled X-ray emission was also observed, which consists of both a thermal component heated by the reverse shock and a non-thermal component powered by a then putative pulsar (Seward et al. 1995; Slane et al. 1997). The pulsar together with its wind nebula was recently detected by Fermi (Abdo et al. 2008). All observations indicate that CTA 1 is a composite SNR in the Sedov phase.
CTA 1 is a text-book example for the breakout phenomenon (Pineault et al. 1997), similar to the SNR VRO 42.05.1 (Landecker et al. 1982). The blast wave of the supernova sweeps the low-density region towards the north-west, where the magnetic field is not sufficiently compressed and the limb-brightened shell is not formed. Breakout phenomena of SNRs can be used to study the non-uniformity of the interstellar medium. Spatial variations in the spectral index could be a diagnosis of the particle acceleration mechanisms. The steepening of the spectrum towards the diffuse region was qualitatively shown by Pineault et al. (1997) based on 408 MHz and 1420 MHz data. However, observations at higher frequencies are needed to obtain a more precise spatial distribution of the spectral index.
CTA 1 was argued to be a site of enhanced interstellar plasma turbulence by analysing the structure functions for rotation measures (RMs) of extragalactic sources in the line-of-sight through and outside the SNR (Simonetti 1992). In principle it would be straightforward to compare the RM structure function of extragalactic sources directly with that of the SNR. Polarised emission has been observed at 2695 MHz (Sieber et al. 1981) and 1720 MHz (Sieber et al. 1979). However, measurements at these two bands cannot warrant a reliable RM map for the SNR because of depolarisation at 1720 MHz. Polarisation observations at higher frequencies such as 4.8 GHz are therefore essential to calculate RMs.
CTA 1 resides at , and experiences little obscuration by the emission from the plane at that high latitude. This makes it a well-suited object to study the spatial variation of the spectral index. In this paper we present new 6 cm and 11 cm observations of CTA 1, which is one of the targets of the campaign to map large northern sky SNRs at 6 cm. This project is part of the Sino-German 6 cm polarisation survey of the Galactic plane (Sun et al. 2007; Gao et al. 2010; Sun et al. 2011; Xiao et al. 2011; Gao et al. 2011). Results on some large SNRs have been already reported, such as G65.2+5.7 (Xiao et al. 2009), the Cygnus Loop (Sun et al. 2006), HB 3 (Shi et al. 2008), G156.2+5.7 (Xu et al. 2007), and S 147 (Xiao et al. 2008).
We describe the new 6 cm and 11 cm observations of CTA 1 as well as other data used, and present the maps in Sect. 2. The results and discussions on the spectrum of integrated flux densities, maps of spectral index and RM are given in Sect. 3. Particularly the detection of a large high-latitude Faraday screen is reported. We summarize our results in Sect. 4.
Throughout the paper we adopt the distance to the SNR of kpc determined from H I measurements (Pineault et al. 1993).
2 New observations and other data used
2.1 Urumqi 6 cm observations
CTA 1 was observed with the Urumqi 25-m telescope of National Astronomical Observatories, Chinese Academy of Sciences, between September and December 2004. Details on the 6 cm receiving system were already given by Sun et al. (2006, 2007). A field of size, centred at , (unless otherwise noted, all the Equatorial coordinates are in the epoch of J2000.0 hereafter), was observed in raster-scans along both Right Ascension and Declination directions. All relevant observational parameters are listed in Table 1.
| Wavelength | 6 cm | 11 cm |
|---|---|---|
| Frequency | 4.8 GHz | 2.639 GHz |
| Bandwidth | 600 MHz | 80 MHz |
| Resolution | ||
| 22 K | 17 K | |
| [K]/ [Jy] | 0.164 | 2.52 |
| Scan velocity | /min | /min |
| Sub-scan separation | ||
| Coverages | 9 | 4 |
| rms of () | 0.5 mK | 3 mK |
| rms of () | 0.3 mK | 1 mK |
| Primary calibrator | 3C 286 | 3C 286 |
| Flux density | 7.5 Jy | 10.4 Jy |
| Polarisation percentage | 11% | 9.9% |
| Polarisation angle |
The data processing procedures were described by e.g. Sun et al. (2007) and Gao et al. (2010). The raw data from the observations are maps of Stokes , , and stored in NOD2 format (Haslam 1974). For each individual map, spikes were removed, the baselines were adjusted, and the scanning effects were suppressed using the method developed by Sofue & Reich (1979). The edited map was further multiplied by a calibration factor determined from 3C 286 to convert map-units into units of main-beam brightness temperature. Maps observed in orthogonal directions were then added in the Fourier domain (Emerson & Gräve 1988) to further eliminate scanning effects and yield the final results. Instrumental polarisation was cleaned according to observations of the unpolarised calibrator 3C 295 following the method described by Sun et al. (2007).
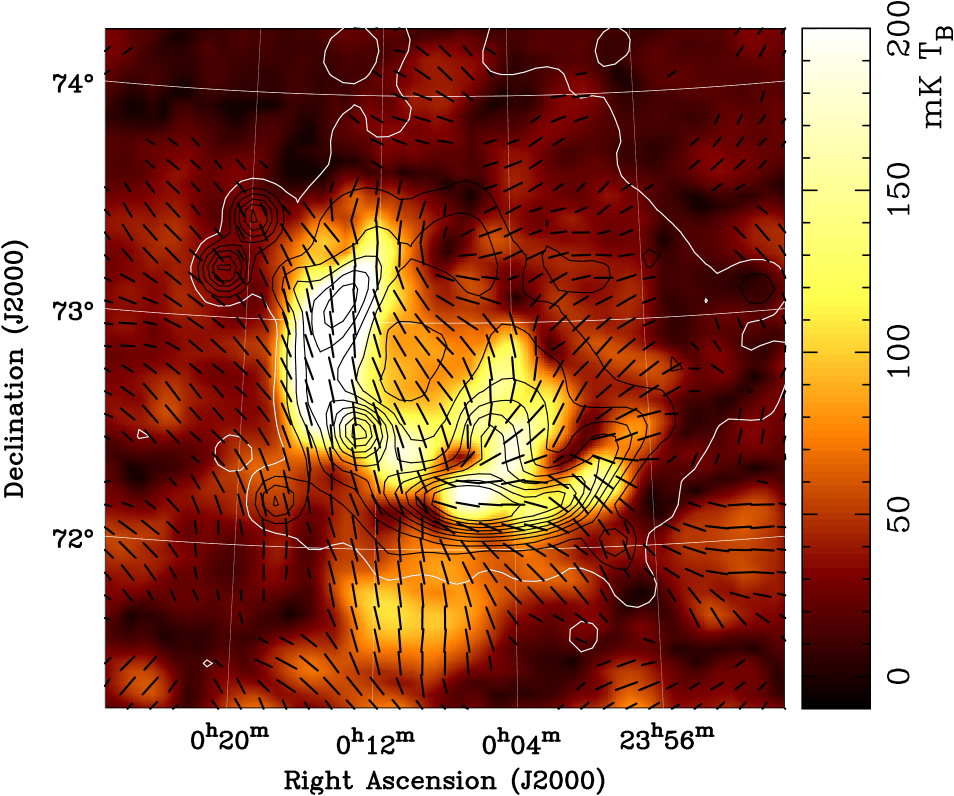
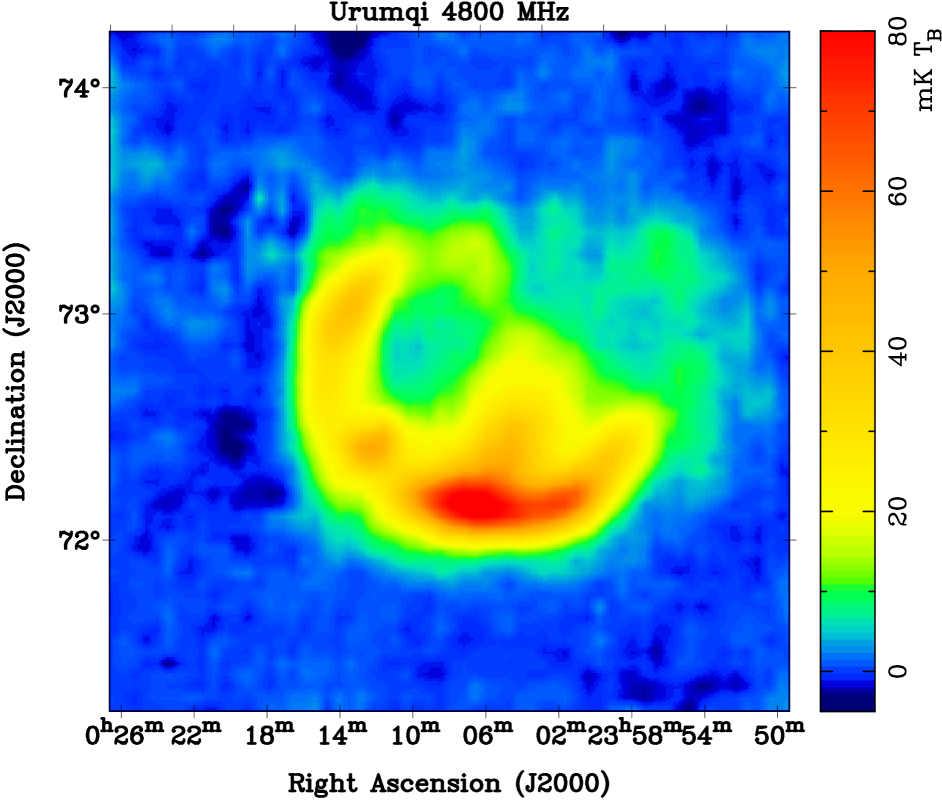
We show the new 6 cm total intensity and polarisation maps in Fig. 1. The polarisation intensity () was obtained as following Wardle & Kronberg (1974) to correct for the positive noise offset. The polarisation angle () was calculated as . Here and are the rms-noise of and . The rms-noise is 0.5 mK for , and 0.3 mK for , , and , which are quite close to the theoretical expectations.
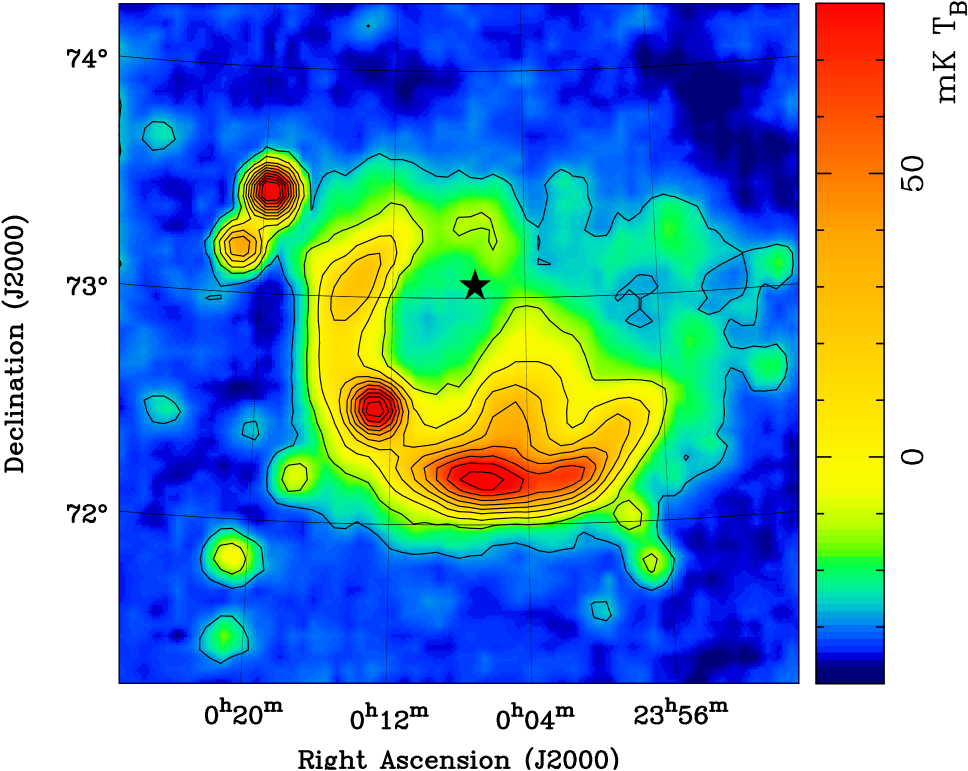
Similar to previous radio observations of CTA 1 (Sieber et al. 1981; Pineault et al. 1997), a very bright semicircular shell roughly centred at , and with a radius of about clearly outlines half of the SNR. The opposite half of CTA 1 mainly manifests weak and diffuse emission, which characterizes the “breakout” region. A bright arc protruding from the southern shell is clearly seen, which is called central branch hereafter. This corresponds to the “bridge” named by Pineault et al. (1997). The weak hooklike feature (just above the gamma-ray pulsar indicated in Fig. 1) as reported by Pineault et al. (1997) connecting the top parts of the central branch and eastern shell can be identified. The strong compact source coinciding with the shell is planetary nebula NGC 40 (, ), discussed in Appendix A.
Strong polarised emission corresponding to the shell and the central branch was detected. The B-vectors follow the shell and the central branch. As shown below in Sect. 3.3.1, the intrinsic RM of CTA 1 is up to 40 rad m-2. This means the polarization angles at 6 cm deviate less than from their intrinsic values. Thus the B-vectors at 6 cm shown in Fig. 1 fairly represent the orientation of the magnetic field. Near NGC 40, the polarisation is much weaker than in the neighbouring area, which splits the shell into two parts (the eastern shell and the southern shell hereafter). This low-polarisation region is probably caused by a dense cloud pre-dating the supernova explosion, which drastically decreases the particle acceleration efficiency (Pineault et al. 1997). There is polarised emission connecting the central branch and the eastern shell. The average polarisation percentage () at 6 cm is about 37% for the eastern shell, about 30% for the central branch, and about 28% for the southern shell.
2.2 Effelsberg 11 cm observations
CTA 1 was observed by Sieber et al. (1979) using the Effelsberg 100-m telescope at 2695 MHz. The system temperature was about 100 K at that time. A new 11 cm receiver was installed in 2005, which has a much lower system temperature of 17 K. We conducted observations of CTA 1 at 11 cm using the new system in November and December 2005 and January 2006. Four coverages were obtained. The relevant observation parameters are listed in Table 1.
The data were processed following standard procedures for Effelsberg continuum observations, which were the same used to reduce the Urumqi 6 cm observations.
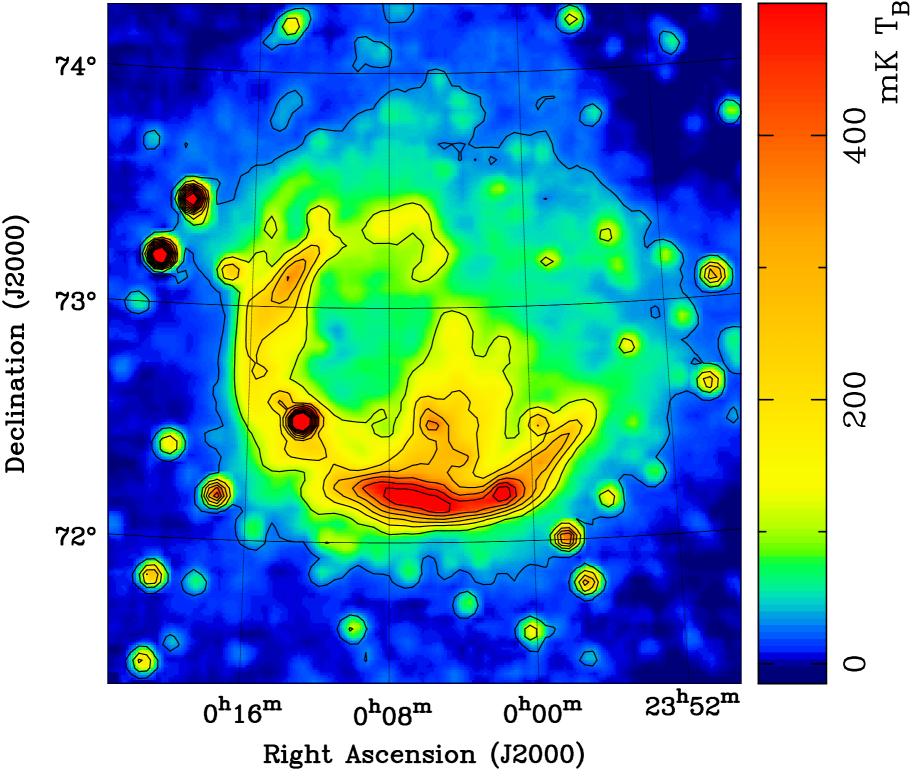
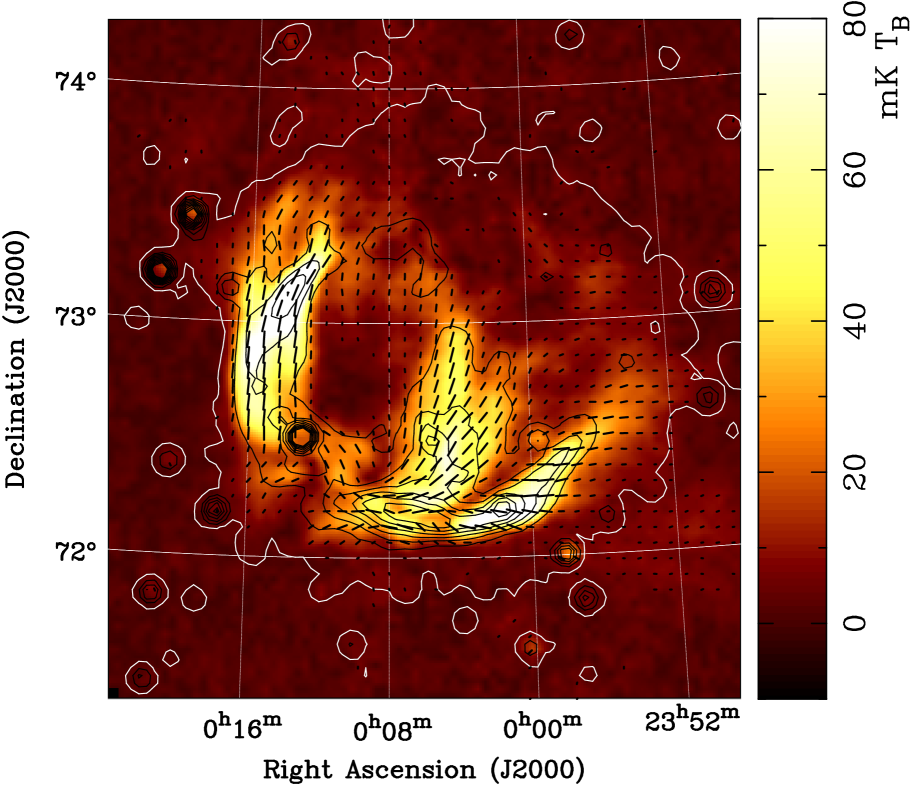
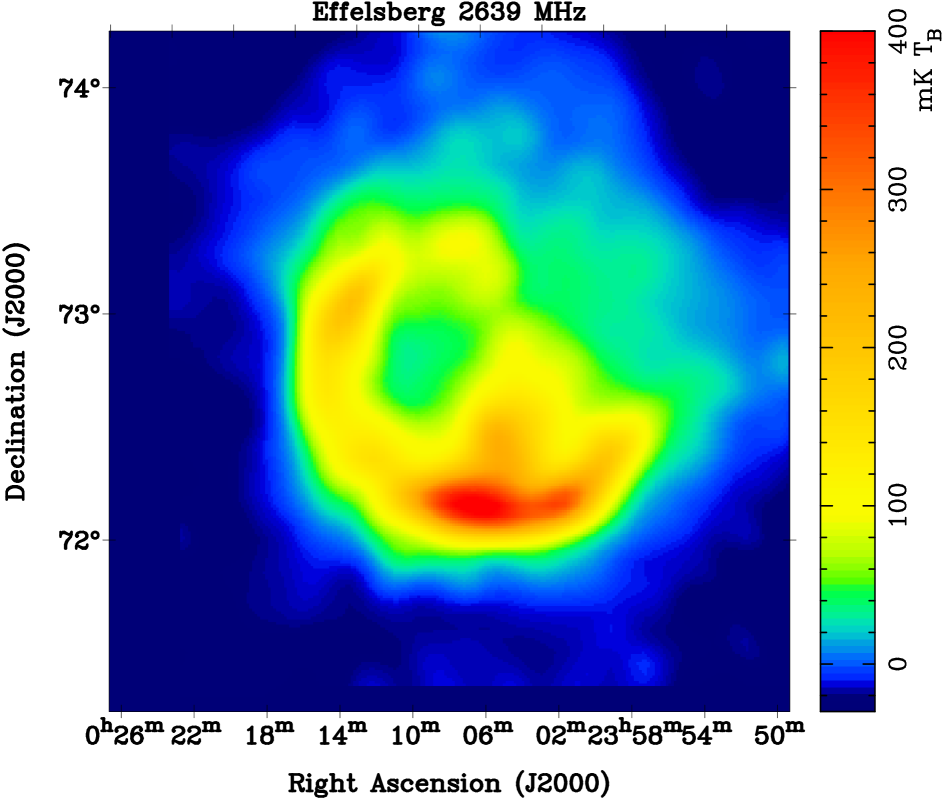
The total intensity and polarisation maps of CTA 1 at 11 cm are shown in Fig. 2. Both the total intensity and the polarisation maps resemble the corresponding 6 cm maps, but have a higher angular resolution. The breakout region can be tracked further to the north than in the 6 cm map, indicating a very steep spectrum.
A number of details can be revealed in the polarisation image. The northern end of the eastern shell and the central branch seem to split CTA 1 into two branches. Towards the low-polarisation region near NGC 40, we note several discrete small patches as the one at , , which is barely visible in the 6 cm polarisation image. These could be fragments of a dense cloud disrupted after the passage of the shock wave from the supernova explosion as discussed by Pineault et al. (1997).
The average polarisation percentage is about 30% for the eastern shell, 22% for the central branch, and 26% for the southern shell.
2.3 408 MHz and 1420 MHz total intensity data
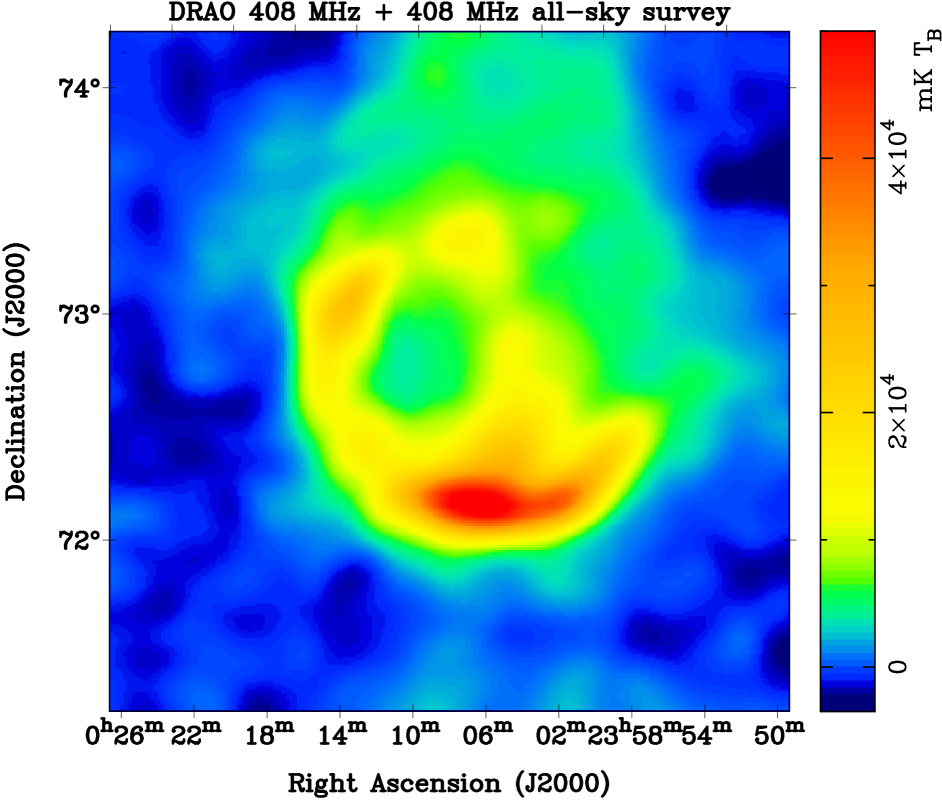
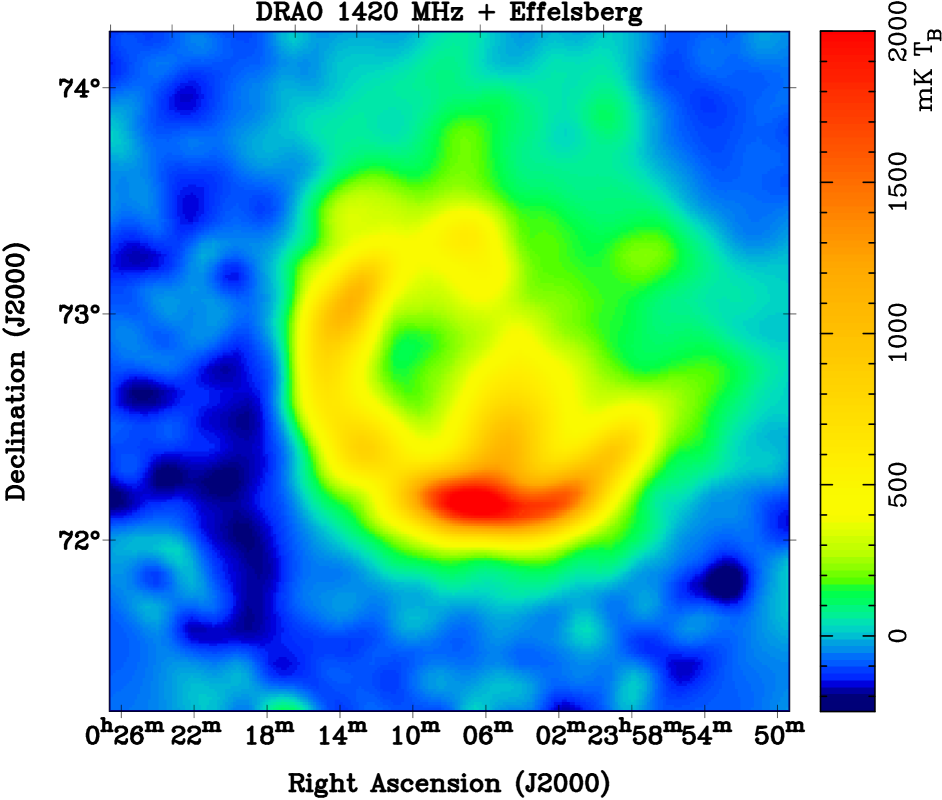
408 MHz and 1420 MHz maps were published by Pineault et al. (1997), which were observed with the DRAO synthesis array, where the missing large-scale components were included from the 408 MHz all-sky survey (Haslam et al. 1982) and 1420 MHz observations made with the Effelsberg telescope including data from the 1420 MHz Stockert survey (Reich 1982) for the broadest structures. The maps have angular resolutions of at 408 MHz and at 1420 MHz. We use these data to construct a spectral index map together with the 6 cm and 11 cm observations.
2.4 Effelsberg 1400 MHz polarisation data
We extracted 1400 MHz polarisation data for the area of CTA 1 from an unpublished section of the Effelsberg Medium Latitude Survey (EMLS), which was described by Uyanıker et al. (1998) and Reich et al. (2004). The resolution is . The 1420 MHz total intensity map from the combined DRAO and Effelsberg observations is of high quality (Pineault et al. 1997) and therefore not replaced by total intensity data from the EMLS.
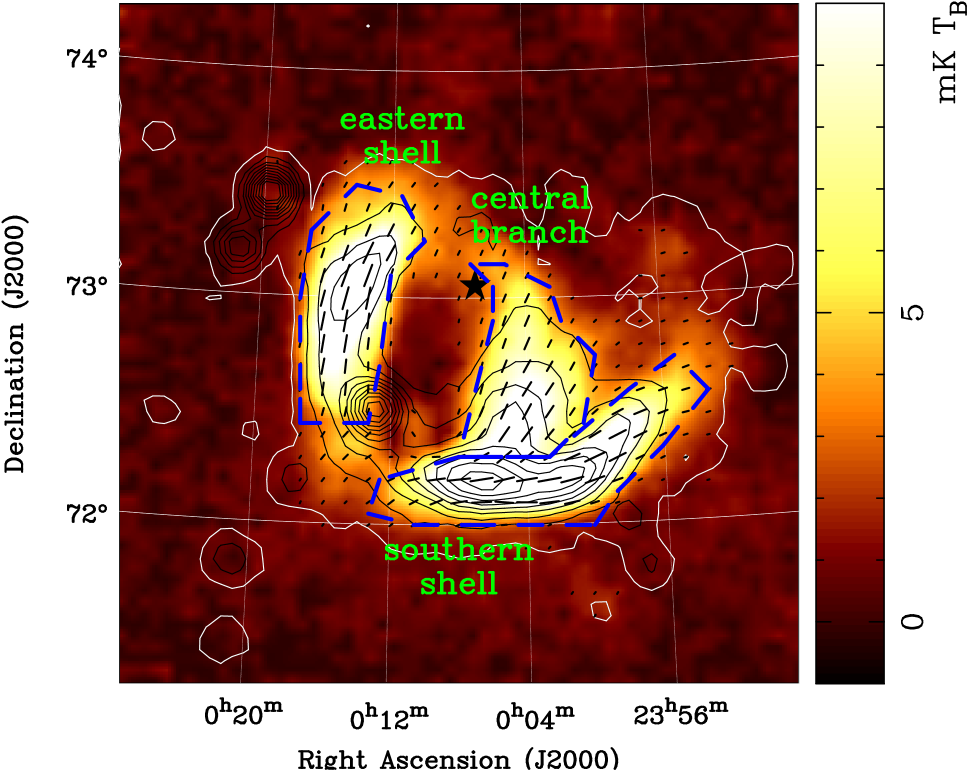
The 21 cm polarisation map from the EMLS is shown in Fig. 3. The polarisation distribution along the eastern shell is quite similar to that observed at 6 cm and 11 cm. For the southern shell, eastwards of , however, there is almost complete depolarisation. Parts of the central branch also experience large depolarisation. The average polarisation percentage is about 26% for the eastern shell, 14% for the central branch, and 10% for the southern shell. Polarisation patches originating within the interstellar medium surround CTA 1 and most likely also exist along the line-of-sight to the SNR. They cause an overestimate of the 21 cm polarisation percentage of CTA 1.
3 Spectrum and rotation measure of CTA 1
3.1 Integrated flux densities and spectrum of CTA 1
We used flux-density measurements of CTA 1 at 408 MHz, 1420 MHz, 2639 MHz, and 4800 MHz to constrain the spectrum of this SNR. Data at lower frequencies compiled by Sieber et al. (1981) were not used, because their very low angular resolution makes it difficult to assess the contribution of compact sources.
Compact, point like sources visible in the total intensity maps at 408 MHz, 1420 MHz, and 2639 MHz, were fitted by a 2D-elliptical Gaussian to subtract them. Most of the extragalactic sources are very weak at 6 cm and confused with CTA 1. Therefore their flux densities cannot be measured from the 6 cm map, and extrapolation from low frequency observations is the only way to estimate their contribution. We obtained a map of sources at 1420 MHz and scaled it to 4.8 GHz using a spectral index of (e.g. Zhang et al. 2003). The spectral index is defined as with being the flux density at frequency . The scaled map was then smoothed to and subtracted from the 6 cm map. NGC 40 has been treated separately according to its spectrum shown in Fig. 12. A hyper-plane calculated from average values from the four map-corners was then subtracted from each map to set the surroundings of the SNR to zero.
We measured the integrated flux density of CTA 1 to be 11.61.2 Jy at 6 cm and 20.32.0 at 11 cm after discounting the contribution of extragalactic sources. We corrected the flux densities obtained by Pineault et al. (1997) accordingly and used integrated flux densities of 313 Jy and 604 Jy at 1420 MHz and 408 MHz, respectively. Fitting the flux density values at these four frequencies yields a spectral index of (Fig. 4), consistent with that reported by Pineault et al. (1997) of .

As a crosscheck for the integrated flux density spectral index, we made TT-plots (Turtle et al. 1962) between 6 cm and the other three frequencies (Fig. 5). With this method the influence of a possible incorrect zero-level setting can be controlled. The TT-plot spectral index () from brightness temperatures relates to as . As shown in Fig. 5, the spectral index from TT-plots is between cm and 408 MHz, between 6 cm and 21 cm, and between 6 cm and 11 cm. These values convincingly confirm the spectral index we obtained from the integrated flux densities. The group of outliers at 40–50 mK in the TT-plots in Fig. 5 are from the residuals when subtracting NGC 40 from the 6 cm map.
3.2 Spectrum steepening
A steepening of the spectrum from the shell towards the breakout region was already reported by Pineault et al. (1997) based on the 408 MHz and 1420 MHz observations. The new 6 cm and 11 cm measurements allow us to study the spatial variations of the spectral index more accurately, because of the wider frequency range.
Towards the SNR, the observed intensity is a sum of the intrinsic emission from the SNR and the fluctuations of the diffuse interstellar medium on degree scales. To set up a common zero-level for all the maps, an offset has to be applied for each frequency before calculating a spectral index map of CTA 1. The source-removed maps at 408 MHz, 1420 MHz and 2639 MHz were smoothed to an angular resolution of . We assume the offset to be zero at 4.8 GHz. This is reasonable because the large-scale emission is very weak at the high-latitude of CTA 1. We then added or subtracted a constant offset from the maps at each of the other three frequencies to assure the TT-plots versus 6 cm intersect at zero brightness temperature (Fig. 5). Total intensities of 830 mK, 87 mK and 24 mK were subtracted from maps at 408 MHz, 1420 MHz and 2639 MHz, respectively, to properly settle the zero-levels. The adjusted maps are displayed in Fig. 6.


For each pixel of the region encompassing CTA 1 from zero-level corrected maps at the four frequencies (Fig. 6), we made a linear fit for intensities versus frequencies in logarithmic scale to obtain the spectral index map. For regions at , only intensities at 408 MHz, 1420 MHz and 2639 MHz were used since no diffuse emission from the SNR could be detected at 4.8 GHz exceeding the noise level. The result is shown in Fig. 7. The errors are generally less than 0.1 and become larger towards the very northern part of CTA 1, where the spectral index decreases to about .
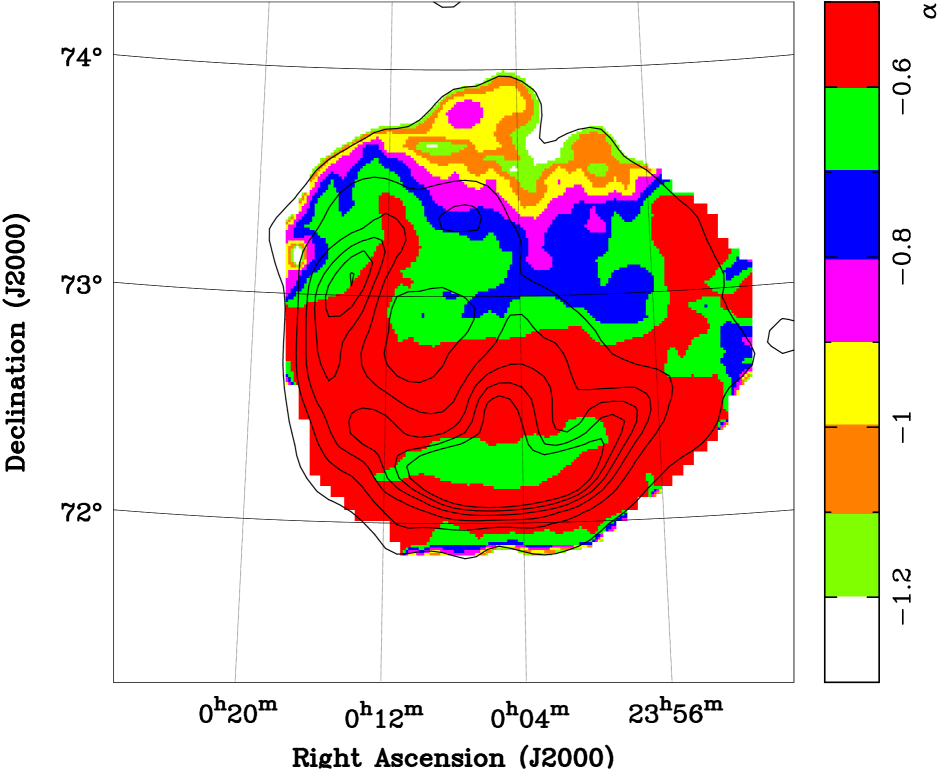
Spectral index values are between and towards the shell and the central branch, and gradually become smaller towards the breakout region. The variation is up to about , which confirms the results by Pineault et al. (1997).
The mechanism for the spectrum steepening is not yet clear. It is widely accepted that cosmic-ray electrons experience diffusive shock acceleration (DSA) in SNR shock fronts and become relativistic. The spectral index of the synchrotron emission observed from these electrons can be written as , where is the shock compression ratio. To produce the observed spectral index, the compression ratio is about 3.5–4 for the shell, and 2.7–2.9 for the breakout region. A decrease of the compression ratio requires a decreasing shock Mach number, which is possible in case of a low gas density in the breakout region (Pineault et al. 1997). However, whether DSA is still important in the breakout region remains very uncertain.
It could be the case that the steep-spectrum emission of the breakout region originates from higher-energy electrons than in the SNR shell because of a weaker magnetic field there. These high-energy electrons may have a steeper spectrum than the low-energy electrons due to synchrotron aging. They may have been accelerated and diffused out from the SNR shell. In this case a steepening at higher frequencies should be seen in the SNR spectra. However, no indication of a spectral break is found in the frequency range between 408 MHz and 4800 MHz, which means that any spectral break due to synchrotron aging should be at higher frequencies. Sensitive observations of CTA 1 at even higher frequencies are needed including measurements of the extended diffuse emission from the breakout region, although it is difficult to map such a large object with arcmin angular resolution.
3.3 RM map of CTA 1
3.3.1 RM determination
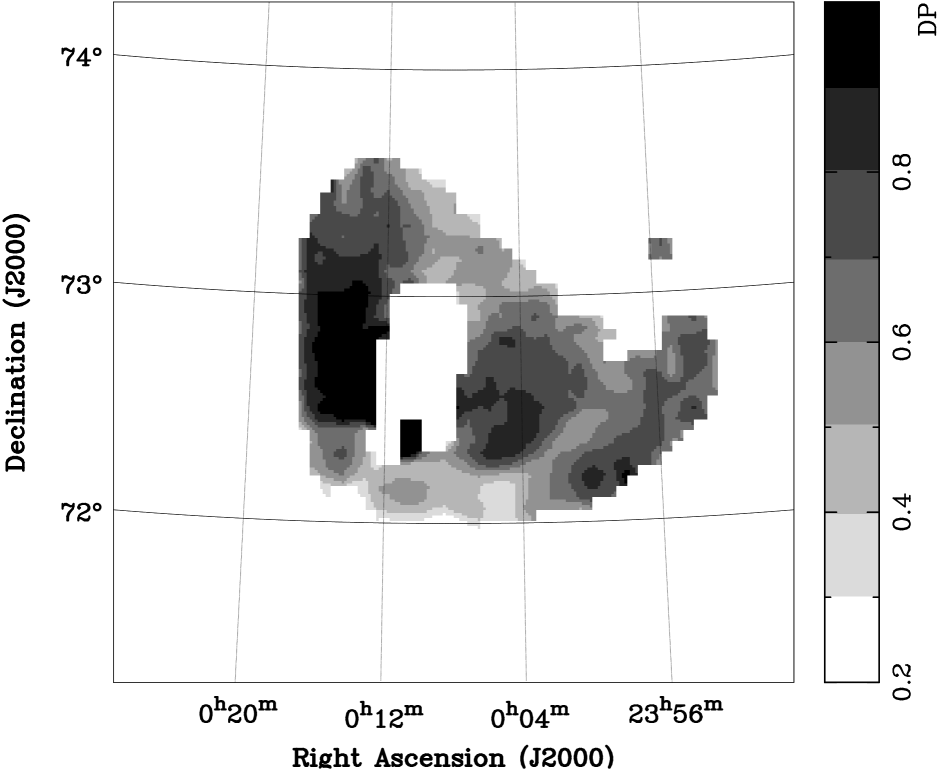
We smoothed the 11 cm and data to an angular resolution of and derived a map of polarisation angles. According to the polarisation angles at 6 cm and 11 cm, we calculated RMs as,
| (1) |
RM is proportional to the integral of the thermal electron density multiplied by the magnetic field parallel to the line-of-sight. Pixels with brightness temperatures less than were not included. The results are shown in Fig. 8. RMs of extragalactic sources in the CTA 1 area were taken from the catalogue by Taylor et al. (2009) and displayed in Fig 8. Their RMs range between 40 rad m-2 and are much smaller than the RM ambiguity of 348 rad m-2 between 6 cm and 11 cm. Therefore we always use the minimum polarisation angle difference to calculate RM.
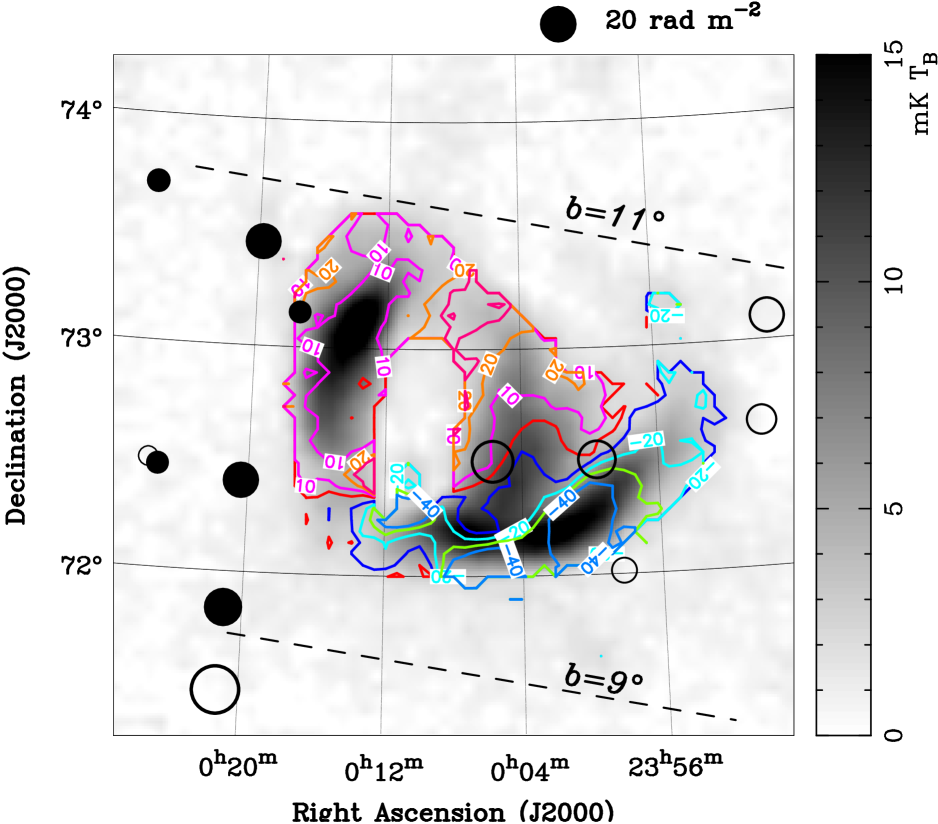
The RM distribution of CTA 1 exhibits a clear pattern. Towards the eastern shell and the central branch, RMs are always positive, and always negative along the southern shell. The average of RMs for the eastern shell and the central branch is about +10 rad m-2 and +15 rad m-2. For the southern shell, the absolute values of RMs are as large as about 50 rad m-2. The RM map by Sieber et al. (1981) based on the Effelsberg 11 cm and 18 cm observations qualitatively agrees with our result. Interestingly the RMs of extragalactic sources show a similar pattern as CTA 1, but extend to a much larger region as discussed in Sect. 3.3.2.
3.3.2 A Faraday screen in front of CTA 1
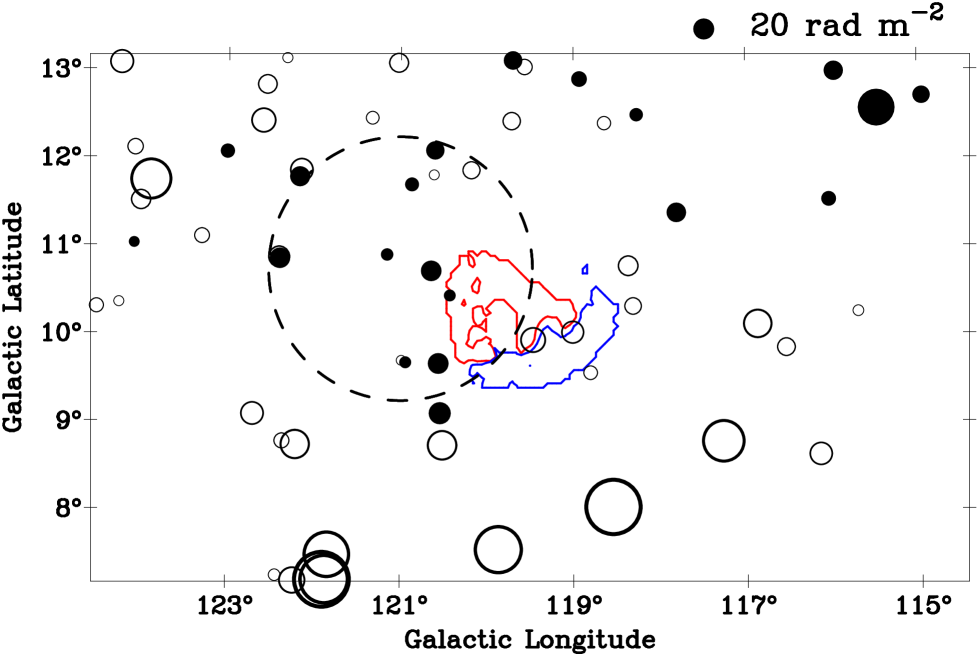
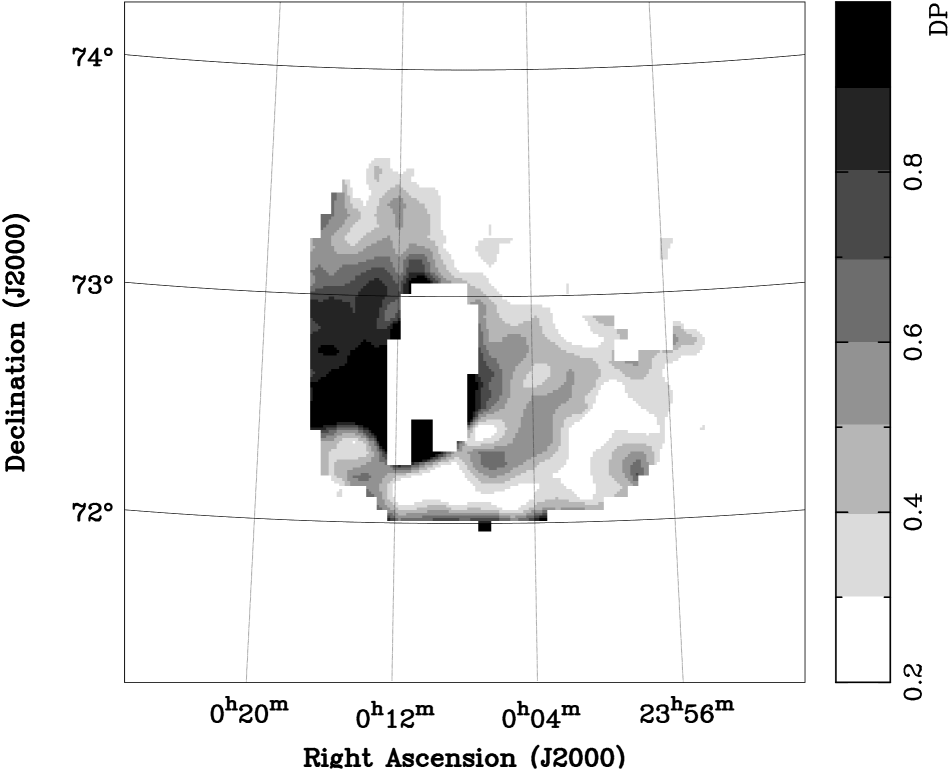
The RM pattern of CTA 1 as well as that of extragalactic sources (Fig. 8) strongly suggests, that there is a Faraday screen in the direction of the eastern shell and the central branch of CTA 1. The Faraday screen exceeds the size of CTA 1 as it can be clearly seen from a larger field containing RMs from extragalactic sources (Fig. 9). Therefore the Faraday screen should be located in front of CTA 1, which has a distance of about 1.4 kpc. Its centre is roughly at , with a poorly constrained size of about . To estimate the RM of the Faraday screen, we first need to investigate RMs from the SNR and the Galactic foreground.
The intrinsic RMs of CTA 1 can be estimated from depolarisation. Polarised emission originating from different depth experiences different Faraday rotation, and summing up all the emission components along the line-of-sight may partly cancel polarised emission components. We define the relative depolarisation () at 11 cm and 21 cm as , where is the polarisation percentage. The 11 cm and 21 cm depolarisation maps are shown in Fig. 10. Following Sokoloff et al. (1998) wavelength-dependent depolarisation is related to RM as,
| (2) |
where we take cm (4.8 GHz).
The average depolarisation is about 0.9, 0.8, and 0.8 for the eastern shell, the central branch, and the southern shell, respectively. This implies a small amount of depolarisation at 11 cm. At 21 cm, the average depolarisation is about 0.9 for the eastern shell, which means an intrinsic absolute RM of 10 rad m-2. The average depolarisation of about 0.6 towards the central branch requires an absolute RM value of of about 18 rad m-2. Towards the southern shell except for several fragments, there is complete depolarisation at 21 cm. The average depolarisation of the fragments is about 0.3, implying an absolute RM value larger than about 25 rad m-2.
The intrinsic RMs of CTA 1 are negative following the regular Galactic magnetic field direction in this area. The observed positive RMs towards the eastern shell and the central branch are caused by the Faraday screen in front of CTA 1.
Based on the 3D-emission models of the Milky Way by Sun et al. (2008) and Sun & Reich (2010), a RM from the diffuse interstellar medium up to the 1.4 kpc distance of CTA 1 was calculated to be about rad m-2. Unfortunately the newly discovered gamma-ray pulsar by Fermi (Abdo et al. 2008) does not yet have a radio detection and thus a measured RM. However, the pulsar B0105+68, about offset from the centre of CTA 1 has a distance of about 2.6 kpc and a RM of rad m-2 (Mitra et al. 2003). A linear interpolation to 1.4 kpc distance yields a RM of rad m-2, consistent with that from the 3D-emission models.
The RM of the Faraday screen can be calculated from the observed RMs towards the eastern shell and the central branch of CTA 1 by subtracting the intrinsic CTA 1 values and the Galactic foreground contribution. The result is about 37–50 rad m-2. In the following we use a mean value of about 45 rad m-2 for the Faraday screen. For the southern shell, which is not influenced by the Faraday screen, the intrinsic RMs plus that from the Galactic foreground roughly agree with the observed ones.
The Faraday screen will cause a rotation of the polarisation angles at 21 cm by more than . However, we cannot find a correspondence with the EMLS data. This implies that most of the polarised emission observed at 21 cm originates from regions closer than the Faraday screen.
Assuming the Faraday screen to be spherical with a mean size of about , the regular magnetic field parallel to the line-of-sight can be estimated as . Here is the H intensity in R, is the distance in pc, the electron temperature is assumed to be 8000 K, and the extinction is neglected. There is no enhanced H emission visible towards the Faraday screen in the Wisconsin H-Alpha Mapper northern sky survey (Haffner et al. 2003). The average and the fluctuations of the H intensity are about 4 R and 1 R, respectively, which implies an upper limit of about 7 R for the Faraday screen. For an assumed distance of 500(1000) pc, the depth of the screen along line-of-sight is about 26(52) pc and the lower limit of the regular magnetic field parallel to the line-of-sight is about 2.7(1.9) G.
3.3.3 RM structure functions
Simonetti (1992) found that CTA 1 is a site of enhanced interstellar plasma turbulence based on a structure function analysis for a number of RMs of extragalactic sources at line-of-sights through and outside the SNR. The RM map we obtained above allows us to compare the structure function of RMs from CTA 1 directly with that of RMs from extragalactic sources by Simonetti (1992) and Taylor et al. (2009).
The second order structure function is a frequently used tool to infer turbulent properties of the interstellar medium (e.g. Sun & Reich 2009; Stil et al. 2011), which is defined as,
| (3) |
Here is the angular separation and stands for the ensemble average. We calculated the structure functions from the RM map of CTA 1 for the southern shell, where RM is negative, and for the eastern shell and the central branch, where RM is positive (see Figs. 8 and 9). We also obtained the structure function for RMs of extragalactic sources shown in Fig. 9. Note that several sources coinciding with CTA 1 (Fig. 9) were excluded in order to compare with the RM structure function for extragalactic sources with line-of-sights outside of CTA 1 by Simonetti (1992). The results are shown in Fig. 11.
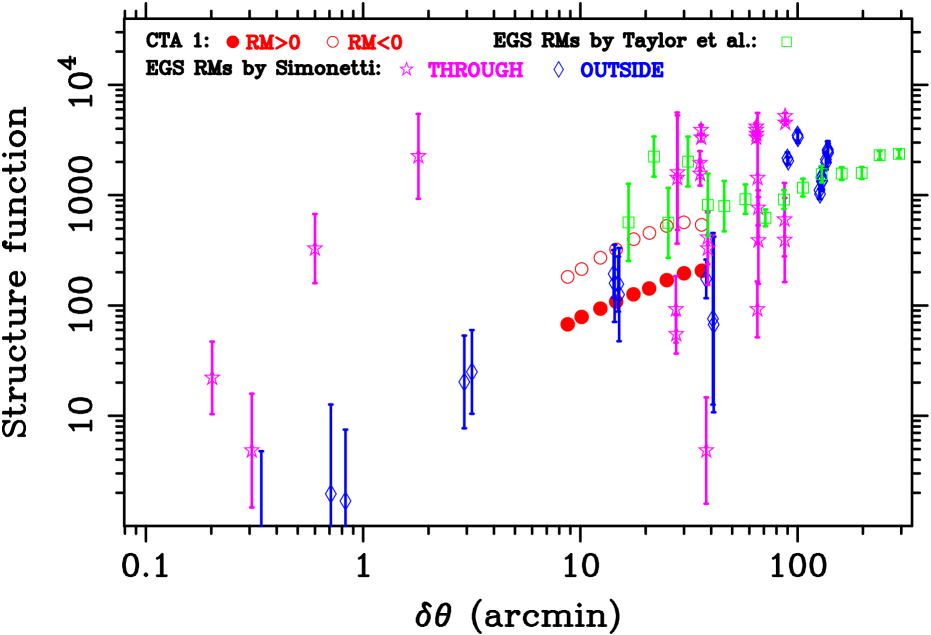
The structure functions for both positive and negative RMs of CTA 1 can be well fitted by a power law with a slope of about 0.85 in the range of , where reflects the angular resolution and is about the width of the shell. Note that the RMs of CTA 1 consist of contributions from the SNR and the Galactic foreground for the southern shell. For the eastern shell and the central branch, the contribution from the Faraday screen adds, which does not change the slope of the structure function. This indicates that the magnetic field in the Faraday screen along the line-of-sight is very regular, so that no additional fluctuations were introduced. The different amplitudes of the two structure functions stem from the different absolute values of RM, which are also reflected in the depolarisation properties (see Sect. 4.2).
The squared RM differences of extragalactic sources at line-of-sights through and outside CTA 1 from Simonetti (1992) are also shown in Fig. 11. At larger scales of , the amplitudes of RM structure functions for all extragalactic sources are similar. At smaller scales of , the squared RM differences for extragalactic sources at line-of-sights through CTA 1 are larger than outside CTA 1. Therefore Simonetti (1992) proposed that CTA 1 induces enhanced plasma turbulence with an outer scale in the range of –. As indicated in Fig. 11, the amplitude of the RM structure function for the shell and central branch regions of CTA 1 roughly agrees with that for extragalactic sources at line-of-sights outside CTA 1, when extrapolated to smaller scales. This implies that the scenario of enhanced plasma fluctuation proposed by Simonetti (1992) is limited at scales below about . Clearly more data are needed to settle this issue.
4 Summary
We performed new 6 cm and 11 cm continuum observations of the shell-type SNR CTA 1. We obtained integrated flux densities of 11.61.2 Jy at 6 cm and 20.32.0 Jy at 11 cm after subtraction of the contributions from compact extragalactic sources. Together with values at 408 MHz and 1420 MHz we derived a spectral index of , which was confirmed by TT-plots. We also obtained a spectral index map based on data at 408 MHz, 1420 MHz, 2639 MHz, and 4800 MHz. The map shows a spectral index variation up to about from the shell towards the breakout region. The reason for the spectrum steepening needs further investigation.
We obtained a RM map using polarisation data at 6 cm and 11 cm. A clear pattern of negative RMs towards the southern part and positive ones towards the eastern part can be seen from the RM map. We argued that there exists a Faraday screen of roughly in size located in front of CTA 1 covering its northeastern part. The RM of the Faraday screen is about 45 rad m-2. Assuming a distance of 500(1000) pc for the Faraday screen the lower limit for the regular magnetic field parallel to the line-of-sights is 2.7(1.9) G.
We calculated RM structure functions for different parts of CTA 1 and could not find an influence by the foreground Faraday screen, which indicates a very regular enhanced magnetic field.
Acknowledgements.
We thank the staff of the Urumqi Observatory of NAOC for qualified assistance with the observations. In particular we like to thank Otmar Lochner for the construction of the 6 cm system and its installation and Maozheng Chen and Jun Ma for their help during the installation of the receiver and subsequent maintenance. We are very grateful to Dr. Peter Müller for the software development needed to make mapping observations at the Urumqi telescope possible. The MPG and the NAOC supported the construction of the Urumqi 6 cm receiving system by special funds. The Chinese survey team is supported by the National Natural Science foundation of China (10773016, 10821061, and 10833003), the National Key Basic Research Science Foundation of China (2007CB815403), and the Partner group of the MPIfR at NAOC in the frame of the exchange program between MPG and CAS for many bilateral visits. XHS likes to thank the MPG and Prof. Michael Kramer for financial support during his stay at the MPIfR. We are grateful to Prof. Ernst Fürst for help with the 11 cm observations and critical reading of the manuscript. Based on observations with the 100-m telescope of the MPIfR (Max-Planck-Institut für Radioastronomie) at Effelsberg. We thank Prof. Dr. Tom Landecker for providing us the 408 MHz and 1420 MHz data. We thank the referee Prof. John Dickel for his instructive and helpful comments.References
- Abdo et al. (2008) Abdo, A. A., Ackermann, M., Atwood, W. B., et al. 2008, Science, 322, 1218
- Becker et al. (1991) Becker, R. H., White, R. L., & Edwards, A. L. 1991, ApJS, 75, 1
- Condon et al. (1998) Condon, J. J., Cotton, W. D., Greisen, E. W., et al. 1998, AJ, 115, 1693
- Emerson & Gräve (1988) Emerson, D. T., & Gräve, R. 1988, A&A, 190, 353
- Fesen et al. (1981) Fesen, R. A., Blair, W. P., Kirshner, R. P., Gull, T. R., & Parker, R. A. R. 1981, ApJ, 247, 148
- Fesen et al. (1983) Fesen, R. A., Gull, T. R., & Ketelsen, D. A. 1983, ApJS, 51, 337
- Gao et al. (2011) Gao, X. Y., Han, J. L., Reich, W., et al. 2011, A&A, 529, A159
- Gao et al. (2010) Gao, X. Y., Reich, W., Han, J. L., et al. 2010, A&A, 515, A64
- Grosdidier et al. (2001) Grosdidier, Y., Acker, A., & Moffat, A. F. J. 2001, A&A, 370, 513
- Haffner et al. (2003) Haffner, L. M., Reynolds, R. J., Tufte, S. L., et al. 2003, ApJS, 149, 405
- Harris & Roberts (1960) Harris, D. E., & Roberts, J. A. 1960, PASP, 72, 237
- Haslam (1974) Haslam, C. G. T. 1974, A&AS, 15, 333
- Haslam et al. (1982) Haslam, C. G. T., Salter, C. J., Stoffel, H., & Wilson, W. E. 1982, A&AS, 47, 1
- Landecker et al. (1982) Landecker, T. L., Pineault, S., Routledge, D., & Vaneldik, J. F. 1982, ApJ, 261, L41
- Mavromatakis et al. (2000) Mavromatakis, F., Papamastorakis, J., Paleologou, E. V., & Ventura, J. 2000, A&A, 353, 371
- Mitra et al. (2003) Mitra, D., Wielebinski, R., Kramer, M., & Jessner, A. 2003, A&A, 398, 993
- Pazderska et al. (2009) Pazderska, B. M., Gawroński, M. P., Feiler, R., et al. 2009, A&A, 498, 463
- Phillips (2005) Phillips, J. P. 2005, MNRAS, 362, 847
- Pineault et al. (1993) Pineault, S., Landecker, T. L., Madore, B., & Gaumont-Guay, S. 1993, AJ, 105, 1060
- Pineault et al. (1997) Pineault, S., Landecker, T. L., Swerdlyk, C. M., & Reich, W. 1997, A&A, 324, 1152
- Reich (1982) Reich, W. 1982, A&AS, 48, 219
- Reich et al. (2004) Reich, W., Fürst, E., Reich, P., et al. 2004, in The Magnetized Interstellar Medium, ed. B. Uyanıker, W. Reich, & R. Wielebinski, 45–50
- Rengelink et al. (1997) Rengelink, R. B., Tang, Y., de Bruyn, A. G., et al. 1997, A&AS, 124, 259
- Seward et al. (1995) Seward, F. D., Schmidt, B., & Slane, P. 1995, ApJ, 453, 284
- Shi et al. (2008) Shi, W. B., Han, J. L., Gao, X. Y., et al. 2008, A&A, 487, 601
- Sieber et al. (1979) Sieber, W., Haslam, C. G. T., & Salter, C. J. 1979, A&A, 74, 361
- Sieber et al. (1981) Sieber, W., Salter, C. J., & Mayer, C. J. 1981, A&A, 103, 393
- Simonetti (1992) Simonetti, J. H. 1992, ApJ, 386, 170
- Siódmiak & Tylenda (2001) Siódmiak, N., & Tylenda, R. 2001, A&A, 373, 1032
- Slane et al. (1997) Slane, P., Seward, F. D., Bandiera, R., Torii, K., & Tsunemi, H. 1997, ApJ, 485, 221
- Sofue & Reich (1979) Sofue, Y., & Reich, W. 1979, A&AS, 38, 251
- Sokoloff et al. (1998) Sokoloff, D. D., Bykov, A. A., Shukurov, A., et al. 1998, MNRAS, 299, 189
- Stil et al. (2011) Stil, J. M., Taylor, A. R., & Sunstrum, C. 2011, ApJ, 726, 4
- Sun & Reich (2010) Sun, X., & Reich, W. 2010, RAA, 10, 1287
- Sun et al. (2007) Sun, X. H., Han, J. L., Reich, W., et al. 2007, A&A, 463, 993
- Sun & Reich (2009) Sun, X. H., & Reich, W. 2009, A&A, 507, 1087
- Sun et al. (2006) Sun, X. H., Reich, W., Han, J. L., Reich, P., & Wielebinski, R. 2006, A&A, 447, 937
- Sun et al. (2011) Sun, X. H., Reich, W., Han, J. L., et al. 2011, A&A, 527, A74
- Sun et al. (2008) Sun, X. H., Reich, W., Waelkens, A., & Enßlin, T. A. 2008, A&A, 477, 573
- Taylor et al. (2009) Taylor, A. R., Stil, J. M., & Sunstrum, C. 2009, ApJ, 702, 1230
- Turtle et al. (1962) Turtle, A. J., Pugh, J. F., Kenderdine, S., & Pauliny-Toth, I. I. K. 1962, MNRAS, 124, 297
- Umana et al. (2008) Umana, G., Leto, P., Trigilio, C., et al. 2008, A&A, 482, 529
- Uyanıker et al. (1998) Uyanıker, B., Fürst, E., Reich, W., Reich, P., & Wielebinski, R. 1998, A&AS, 132, 401
- Wardle & Kronberg (1974) Wardle, J. F. C., & Kronberg, P. P. 1974, ApJ, 194, 249
- Xiao et al. (2008) Xiao, L., Fürst, E., Reich, W., & Han, J. L. 2008, A&A, 482, 783
- Xiao et al. (2011) Xiao, L., Han, J. L., Reich, W., et al. 2011, A&A, 529, A15
- Xiao et al. (2009) Xiao, L., Reich, W., Fürst, E., & Han, J. L. 2009, A&A, 503, 827
- Xu et al. (2007) Xu, J. W., Han, J. L., Sun, X. H., et al. 2007, A&A, 470, 969
- Zhang et al. (2003) Zhang, X., Reich, W., Reich, P., & Wielebinski, R. 2003, ChJAA, 3, 347
Appendix A NGC 40
NGC 40 (, ) is a well-known planetary nebula where its central star shows the Wolf-Rayet phenomenon (Grosdidier et al. 2001). Its distance is very uncertain and estimates range from 0.5 kpc to 3.5 kpc (Phillips 2005). From the polarisation images at 6 cm (Fig. 1), 11 cm (Fig. 2), and 21 cm (Fig. 3), it is evident that NGC 40 does not have an effect on polarisation distribution and cannot cause the low-polarisation region, which divides CTA 1 into an eastern and a southern shell. Therefore its distance should be larger than that of CTA 1 unless it causes no Faraday rotation.

The integrated flux density of NGC 40 was measured to be mJy at 6 cm and mJy at 11 cm. Besides the flux density measurements collected by Sieber et al. (1981) we found some new ones from literature and plotted both datasets in Fig. 12. The two-component radio emission model of planetary nebulae by Siódmiak & Tylenda (2001) was used to fit the spectrum, which yields an opacity of .