Search for charmonium and charmonium-like states in
radiative decays
X. L. Wang
Institute of High Energy Physics, Chinese Academy of Sciences, Beijing
C. P. Shen
Nagoya University, Nagoya
C. Z. Yuan
Institute of High Energy Physics, Chinese Academy of Sciences, Beijing
P. Wang
Institute of High Energy Physics, Chinese Academy of Sciences, Beijing
I. Adachi
High Energy Accelerator Research Organization (KEK), Tsukuba
H. Aihara
Department of Physics, University of Tokyo, Tokyo
D. M. Asner
Pacific Northwest National Laboratory, Richland, Washington 99352
T. Aushev
Institute for Theoretical and Experimental Physics, Moscow
A. M. Bakich
School of Physics, University of Sydney, NSW 2006
E. Barberio
University of Melbourne, School of Physics, Victoria 3010
K. Belous
Institute of High Energy Physics, Protvino
B. Bhuyan
Indian Institute of Technology Guwahati, Guwahati
A. Bozek
H. Niewodniczanski Institute of Nuclear Physics, Krakow
M. Bračko
University of Maribor, Maribor
J. Stefan Institute, Ljubljana
T. E. Browder
University of Hawaii, Honolulu, Hawaii 96822
M.-C. Chang
Department of Physics, Fu Jen Catholic University, Taipei
A. Chen
National Central University, Chung-li
B. G. Cheon
Hanyang University, Seoul
K. Chilikin
Institute for Theoretical and Experimental Physics, Moscow
I.-S. Cho
Yonsei University, Seoul
K. Cho
Korea Institute of Science and Technology Information, Daejeon
Y. Choi
Sungkyunkwan University, Suwon
J. Dalseno
Max-Planck-Institut für Physik, München
Excellence Cluster Universe, Technische Universität München, Garching
M. Danilov
Institute for Theoretical and Experimental Physics, Moscow
Z. Doležal
Faculty of Mathematics and Physics, Charles University, Prague
S. Eidelman
Budker Institute of Nuclear Physics SB RAS and Novosibirsk State University, Novosibirsk 630090
J. E. Fast
Pacific Northwest National Laboratory, Richland, Washington 99352
M. Feindt
Institut für Experimentelle Kernphysik, Karlsruher Institut für Technologie, Karlsruhe
V. Gaur
Tata Institute of Fundamental Research, Mumbai
Y. M. Goh
Hanyang University, Seoul
J. Haba
High Energy Accelerator Research Organization (KEK), Tsukuba
K. Hayasaka
Nagoya University, Nagoya
H. Hayashii
Nara Women’s University, Nara
Y. Hoshi
Tohoku Gakuin University, Tagajo
Y. B. Hsiung
Department of Physics, National Taiwan University, Taipei
H. J. Hyun
Kyungpook National University, Taegu
T. Iijima
Nagoya University, Nagoya
A. Ishikawa
Tohoku University, Sendai
R. Itoh
High Energy Accelerator Research Organization (KEK), Tsukuba
M. Iwabuchi
Yonsei University, Seoul
Y. Iwasaki
High Energy Accelerator Research Organization (KEK), Tsukuba
T. Iwashita
Nara Women’s University, Nara
T. Julius
University of Melbourne, School of Physics, Victoria 3010
J. H. Kang
Yonsei University, Seoul
N. Katayama
High Energy Accelerator Research Organization (KEK), Tsukuba
T. Kawasaki
Niigata University, Niigata
H. Kichimi
High Energy Accelerator Research Organization (KEK), Tsukuba
H. J. Kim
Kyungpook National University, Taegu
H. O. Kim
Kyungpook National University, Taegu
J. B. Kim
Korea University, Seoul
J. H. Kim
Korea Institute of Science and Technology Information, Daejeon
K. T. Kim
Korea University, Seoul
M. J. Kim
Kyungpook National University, Taegu
Y. J. Kim
Korea Institute of Science and Technology Information, Daejeon
K. Kinoshita
University of Cincinnati, Cincinnati, Ohio 45221
B. R. Ko
Korea University, Seoul
N. Kobayashi
Research Center for Nuclear Physics, Osaka
Tokyo Institute of Technology, Tokyo
S. Koblitz
Max-Planck-Institut für Physik, München
P. Križan
Faculty of Mathematics and Physics, University of Ljubljana, Ljubljana
J. Stefan Institute, Ljubljana
A. Kuzmin
Budker Institute of Nuclear Physics SB RAS and Novosibirsk State University, Novosibirsk 630090
Y.-J. Kwon
Yonsei University, Seoul
J. S. Lange
Justus-Liebig-Universität Gießen, Gießen
S.-H. Lee
Korea University, Seoul
J. Li
Seoul National University, Seoul
X. R. Li
Seoul National University, Seoul
Y. Li
CNP, Virginia Polytechnic Institute and State University, Blacksburg, Virginia 24061
J. Libby
Indian Institute of Technology Madras, Madras
C.-L. Lim
Yonsei University, Seoul
C. Liu
University of Science and Technology of China, Hefei
D. Liventsev
Institute for Theoretical and Experimental Physics, Moscow
R. Louvot
École Polytechnique Fédérale de Lausanne (EPFL), Lausanne
D. Matvienko
Budker Institute of Nuclear Physics SB RAS and Novosibirsk State University, Novosibirsk 630090
S. McOnie
School of Physics, University of Sydney, NSW 2006
K. Miyabayashi
Nara Women’s University, Nara
H. Miyata
Niigata University, Niigata
Y. Miyazaki
Nagoya University, Nagoya
G. B. Mohanty
Tata Institute of Fundamental Research, Mumbai
R. Mussa
INFN - Sezione di Torino, Torino
Y. Nagasaka
Hiroshima Institute of Technology, Hiroshima
M. Nakao
High Energy Accelerator Research Organization (KEK), Tsukuba
H. Nakazawa
National Central University, Chung-li
Z. Natkaniec
H. Niewodniczanski Institute of Nuclear Physics, Krakow
S. Neubauer
Institut für Experimentelle Kernphysik, Karlsruher Institut für Technologie, Karlsruhe
S. Nishida
High Energy Accelerator Research Organization (KEK), Tsukuba
K. Nishimura
University of Hawaii, Honolulu, Hawaii 96822
O. Nitoh
Tokyo University of Agriculture and Technology, Tokyo
S. Ogawa
Toho University, Funabashi
T. Ohshima
Nagoya University, Nagoya
S. Okuno
Kanagawa University, Yokohama
S. L. Olsen
Seoul National University, Seoul
University of Hawaii, Honolulu, Hawaii 96822
Y. Onuki
Tohoku University, Sendai
P. Pakhlov
Institute for Theoretical and Experimental Physics, Moscow
G. Pakhlova
Institute for Theoretical and Experimental Physics, Moscow
H. Park
Kyungpook National University, Taegu
H. K. Park
Kyungpook National University, Taegu
T. K. Pedlar
Luther College, Decorah, Iowa 52101
R. Pestotnik
J. Stefan Institute, Ljubljana
M. Petrič
J. Stefan Institute, Ljubljana
L. E. Piilonen
CNP, Virginia Polytechnic Institute and State University, Blacksburg, Virginia 24061
M. Ritter
Max-Planck-Institut für Physik, München
S. Ryu
Seoul National University, Seoul
H. Sahoo
University of Hawaii, Honolulu, Hawaii 96822
Y. Sakai
High Energy Accelerator Research Organization (KEK), Tsukuba
T. Sanuki
Tohoku University, Sendai
O. Schneider
École Polytechnique Fédérale de Lausanne (EPFL), Lausanne
C. Schwanda
Institute of High Energy Physics, Vienna
K. Senyo
Nagoya University, Nagoya
O. Seon
Nagoya University, Nagoya
M. E. Sevior
University of Melbourne, School of Physics, Victoria 3010
M. Shapkin
Institute of High Energy Physics, Protvino
T.-A. Shibata
Research Center for Nuclear Physics, Osaka
Tokyo Institute of Technology, Tokyo
J.-G. Shiu
Department of Physics, National Taiwan University, Taipei
B. Shwartz
Budker Institute of Nuclear Physics SB RAS and Novosibirsk State University, Novosibirsk 630090
F. Simon
Max-Planck-Institut für Physik, München
Excellence Cluster Universe, Technische Universität München, Garching
P. Smerkol
J. Stefan Institute, Ljubljana
Y.-S. Sohn
Yonsei University, Seoul
E. Solovieva
Institute for Theoretical and Experimental Physics, Moscow
S. Stanič
University of Nova Gorica, Nova Gorica
M. Starič
J. Stefan Institute, Ljubljana
M. Sumihama
Research Center for Nuclear Physics, Osaka
Gifu University, Gifu
G. Tatishvili
Pacific Northwest National Laboratory, Richland, Washington 99352
Y. Teramoto
Osaka City University, Osaka
K. Trabelsi
High Energy Accelerator Research Organization (KEK), Tsukuba
M. Uchida
Research Center for Nuclear Physics, Osaka
Tokyo Institute of Technology, Tokyo
S. Uehara
High Energy Accelerator Research Organization (KEK), Tsukuba
Y. Unno
Hanyang University, Seoul
S. Uno
High Energy Accelerator Research Organization (KEK), Tsukuba
Y. Usov
Budker Institute of Nuclear Physics SB RAS and Novosibirsk State University, Novosibirsk 630090
G. Varner
University of Hawaii, Honolulu, Hawaii 96822
C. H. Wang
National United University, Miao Li
M.-Z. Wang
Department of Physics, National Taiwan University, Taipei
Y. Watanabe
Kanagawa University, Yokohama
E. Won
Korea University, Seoul
B. D. Yabsley
School of Physics, University of Sydney, NSW 2006
Y. Yamashita
Nippon Dental University, Niigata
M. Yamauchi
High Energy Accelerator Research Organization (KEK), Tsukuba
Z. P. Zhang
University of Science and Technology of China, Hefei
V. Zhilich
Budker Institute of Nuclear Physics SB RAS and Novosibirsk State University, Novosibirsk 630090
Abstract
Using a sample of 158 million events collected with the
Belle detector, charmonium and charmonium-like states with even
charge parity are searched for in radiative decays. No
significant or signal is observed and the
following upper limits at 90% confidence level (C.L.) are obtained: , , , and . No significant signal of any charmonium-like state is
observed, and we obtain the limits ,
, ,
, and at
90% C.L.
pacs:
14.40.Pq, 14.40.Rt, 13.20.Gd
††preprint: ††preprint: Intended for Phys. Rev. D(R)Authors: X. L. Wang, C. P. Shen C. Z. Yuan, and P. WangCommittee: S. Uehara (chair), S. Lange, H. NakazawaBelle Preprint 2011-12KEK Preprint 2011-10
The data samples of the factories have provided a wealth of
experimental information on charmonium spectroscopy review .
Below open charm threshold agreement between experimental mass
measurements and predictions based upon potential models was
recently demonstrated with high accuracy for the
hc1 ; hc2 . However, in the region above the open charm
threshold, in addition to many conventional charmonium states, a
number of charmonium-like states (the so-called “
particles”) have been discovered with unusual properties. These
may include exotic states, such as quark-gluon hybrids, meson
molecules, and multi-quark states review . Many of these new
states are established in a single production mechanism or in a
single decay mode only. To better understand them, it is necessary
to search for such states in more production processes and/or
decay modes. States with can be studied via
initial state radiation (ISR) with the large data
samples at BaBar or Belle, or via collisions directly at the
peak energy at, for example, BESIII. For charge-parity-even
charmonium states, radiative decays of the narrow
states below the open bottom threshold can be examined.
The production rates of the -wave spin-triplet (=0,
1, 2) and -wave spin-singlet states in
radiative decays have been calculated by Gao et al.; the
rates in decays are estimated to be at the same
level ktchao . However, there are no such calculations or
estimations for “ particles” due to the limited knowledge of
their nature.
In this paper, with the world largest data sample taken at the
peak, we report a search for the , ,
bellex , uehara , and
cdfy in radiative decays, extending our
previous work on the sample yonesRD . In addition,
the new structure bellex4350 , which was observed
as a 3.2 standard deviation () signal in is also
searched for. As any charmonium state above is expected to
have a larger branching fraction for the E1/M1 transition to
than to Barnes , we also search for states
decaying into .
The data used in this analysis include a 24.7 fb-1 data
sample collected at the peak and a 1.7 fb-1 data
sample collected at GeV (off-resonance data) with
the Belle detector Belle operating at the KEKB
asymmetric-energy collider KEKB . The number of the
events is determined by counting the hadronic events in
the data taken at the peak after subtracting the scaled
continuum background from the data sample collected at . The selection criteria for hadronic events are
validated with the off-resonance data by comparing the measured
value ()
with CLEO’s result cleoR . The number of events is
determined to be , with the error dominated
by the MC simulation of the decay dynamics using pythiapythia .
Well measured charged tracks and photon candidates are first
selected. For a charged track, the impact parameters perpendicular
to and along the beam direction with respect to the interaction
point (IP) are required to be less than 0.5 cm and 4 cm,
respectively, and the transverse momentum should exceed
0.1 GeV/ in the laboratory frame. Information from different
detector subsystems is combined to form a likelihood
for each particle species pid . A track with
is identified as a kaon, while a track with
is treated as a pion. With this selection, the
kaon (pion) identification efficiency is about 90% (96%), while
5% (6%) of kaons (pions) are misidentified as pions (kaons).
For electron identification, the likelihood ratio is
defined as , where and are the
likelihoods for electron and non-electron, respectively,
determined using the ratio of the energy deposited in the
electromagnetic calorimeter (ECL) to the momentum measured in the
silicon vertex detector and central drift chamber (CDC), the
shower shape in the ECL, the matching between the position of
charged track trajectory and the cluster position in the ECL, the
hit information from the aerogel threshold Cherenkov counters and
the dE/dx measurements in the CDC EID . For muon
identification, the likelihood ratio is defined as
, where ,
and are the likelihoods for
muon, pion and kaon hypotheses, respectively, based on the
matching quality and penetration depth of associated hits in the
iron flux return (KLM) MUID .
A good neutral cluster is reconstructed as a photon if its ECL
shower does not match the extrapolation of any charged track and
its energy is greater than 40 MeV. In the center-of-mass
(C.M.) frame, the photon candidate with the maximum energy is
taken to be the radiative decay photon (denoted as
), and its energy is required to be greater than
. A photon energy corresponds
to a particle of mass produced in radiative
decays.
We reconstruct signals from or candidates. In
order to reduce the effect of bremsstrahlung or final-state
radiation, photons detected in the ECL within 0.05 radians of the
original or direction are included in the calculation
of the momentum. For the lepton pair used to reconstruct
, at least one track should have while
the other should satisfy in the mode;
or one track should have (in the
analysis, the other track should have associated hits in the KLM
detector that agree with the extrapolated trajectory of a charged
track provided by the drift chamber) in the mode. The lepton
pair identification efficiency is about 97% for and 87% for . In order to improve the
momentum resolution, a mass-constrainted fit is then
performed for signals in the , ,
, and modes. Different modes have
similar mass resolutions. The signal region is
defined as
(), where is the nominal mass of
. The mass sidebands are defined as
and
, and
are twice as wide as the signal region. For the
channel, the is reconstructed from the
final state, with a mass constrained to the nominal
mass to improve its momentum resolution. To estimate the difference
in the mass resolution between MC simulation and data, the process
is selected as a reference sample, and the mass
resolution is found to be from data, and
from MC simulation. The difference in the mass
resolution is included when extracting the signal yields in the
analyses below.
We search for the in the mode. The energy
deposited by the photon (denoted as , since its
energy is much lower than that of ) is required to be greater
than to reduce the large background from
mis-reconstructed photons, and the total number of photons is
required to be exactly two to suppress multiphoton backgrounds.
The angle between the and should be larger than
to remove the background from split-off fake photons.
To remove the ISR background , where a photon is missing, we require the square of the
“mass recoiling against the and ” (, here is the 4-momentum of the
collision system, and is the sum of the 4-momenta of the
observed final state particles) to be within and 0.5 GeV. This requirement is
effective since this background has at least two missing photons
and tends to be large. Bhabha and dimuon
background events with final-state radiative photons are further
suppressed by removing events in which a photon is detected within
a cone around each charged track direction.
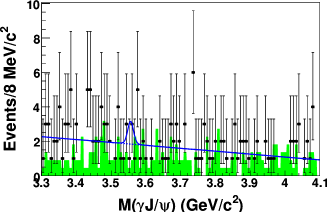
The mode shows a clear signal, while the mode
has some residual radiative Bhabha background. Figure 1
shows the invariant mass distribution together
with the background estimated from the mass sidebands
(normalized to the width of the signal range) for the
combined and modes after the above selection criteria
are applied. Some ISR backgrounds with a correctly reconstructed
remain in the data. No signal is observed.
A simultaneous fit to the signal region is performed with
Breit-Wigner (BW) functions convolved with Gaussian resolution
functions for the resonances and a second-order polynomial
background term. The width of the Gaussian resolution function is
fixed at MeV/, which is obtained by increasing the
MC-simulated value by 10% to account for the difference between
data and MC simulation. The masses and widths of the
resonances are fixed to their PDG values PDG . In the
simultaneous fit, the ratio of the yields in the two decay
channels is fixed to , where is the
decay branching fraction for the mode or mode
reported by the PDG PDG , and is the MC-determined
efficiency for this mode. The upper limit on the number () of signal events at the 90% C.L. is calculated by solving
the equation , where is the number of
signal events, and is the likelihood function depending
on from the fit to the data. The values of are
found to be , and for the , and
, respectively, when requiring the signal yields
to be non-negative in the fit. We do not observe any
structure at high masses, where excited states are
expected.
Figure 1: The
invariant mass distribution in the data
sample. There is no , , or signal
observed. The solid curve is the best fit, the dashed curve is the
background, and the shaded histogram is from the normalized
mass sidebands. The signal yield is required to
be non-negative in the fit.
To search for a possible excited charmonium state in the
final state, a candidate and two oppositely
charged pion candidates are reconstructed. The signal
region is defined as , and
the mass sidebands are defined as and . To suppress backgrounds with misconstructed photons,
we require the energy of the to be higher than .
To suppress the ISR background ,
we require the square of the mass recoiling against the
and to be within and 1.5 GeV
since for the ISR background tends to be shifted towards
negative values.
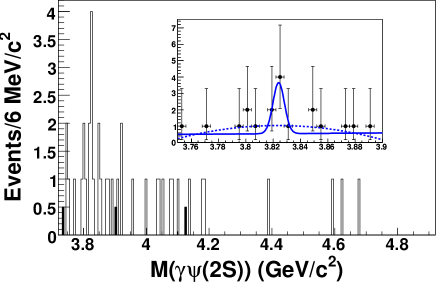
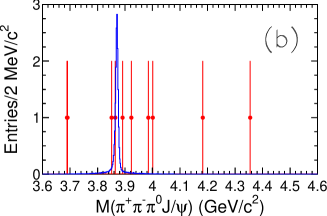
The invariant mass distribution after the above
selection is shown in Fig. 2. There is no significant
signal. However, a few events accumulate around ,
where the decays of the and
Barnes are expected. A fit between
and with a Gaussian to parameterize
the signal shape yields a mass of and a
signal yield of events corresponding to a
statistical significance of . The signal significance
is determined by comparing the value of
from the fit, with values from fits to 10,000 pseudo-experiments.
Here and are the likelihoods of the fits
without and with the signal, respectively. The upper limit on the
product branching fraction at the 90% C.L.
is determined following the procedure described below.
Figure 2: The
invariant mass distribution. The open histogram is
from the signal mass region, the shaded histogram is from
the normalized mass sidebands. In the inset, the solid
curve is the best fit between and , and
the dashed curve is a fit with only a second-order polynomial
to describe the background.
To search for the signal in radiative decays, we
reconstruct candidates from the , ,
, , and modes. Well measured charged
tracks should be identified as pions or kaons, and the number of
charged tracks is six for the final state and four for
the other final states. In the mode, candidates
are reconstructed from pairs with an invariant mass
within 30 MeV/ of the nominal mass. A
candidate should have a displaced vertex and flight
direction consistent with a originating from the IP; the
same selection method is used in Ref. ks . Events with
leptons misidentified as pions in the and modes
are removed by requiring and
for the pion candidates. The value of
for the hadronic daughters of the candidate is
required to be within GeV and 1 GeV.
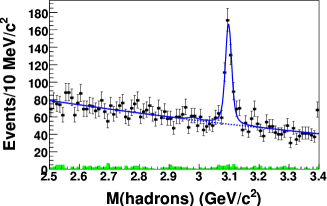
After the selection described above, Fig. 3 shows the
combined mass distribution of the hadronic final states for the
five decay modes. The large signal is due to the
ISR process , while the accumulation of
events within the mass region is small. The shaded
histogram in Fig. 3 is the same distribution for the
off-resonance data and is not normalized.
Figure 3:
The mass distribution for a sum of the five decay modes.
The solid curve is a sum of the corresponding functions obtained
from a simultaneous fit to all the decay modes, and the
dashed curve is a sum of the background functions from the fit.
The shaded histogram is a sum of the off-resonance events (not
normalized). The signal is produced via ISR rather than
from a radiative decay of an resonance.
A simultaneous fit is performed to the five final states.
The ratios of the ()
yields in all the channels are fixed to , where each
is the () decay branching fraction
for the -th mode reported by the PDG PDG , and
is the MC-determined efficiency for this mode. The fit function
contains a BW function convolved with a Gaussian resolution
function (its resolution is fixed to 7.9 from MC
simulation) describing the signal shape, another Gaussian
function describing the signal shape, and a second-order
polynomial describing the background shape. The mass and width of
the BW function are fixed to the PDG values PDG for the
. The results of the fit are shown in Fig. 3, where
the solid curve is the sum of all the fit functions, and the
dashed curve is the sum of the background functions. The fit
yields signal events
corresponding to an upper limit of 44 at the 90% C.L.
In addition, we obtain signal events from the fit (in agreement with
expected from production according to MC
simulation), giving a mass of ,
which is consistent with the PDG value PDG .
The selection criteria for , are
similar to those used for ISR events in
data belley . We require that one candidate be
reconstructed, two well-identified ’s have an invariant mass
greater than 0.35 GeV/, and that be within
the range between GeV and 1 GeV. To suppress
the ISR background, we require that the polar angle of
the candidate satisfy in the C.M.
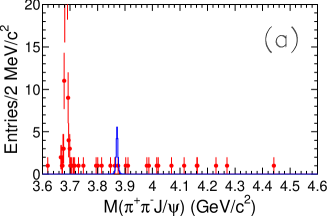
frame. Except for a few residual ISR produced signal
events, only a small number of events appear in the
invariant mass distribution, as shown in Fig. 4(a).
There is no accumulation of events in the mass region.
Fitting using a signal shape from the MC sample and a first-order
polynomial function as the background shape, the upper limit
for the number of signal events is determined to be
3.6 at the 90% C.L.
Figure 4: (a)
Distribution of the invariant mass for candidates. (b) Distribution of the
invariant mass for candidates. (c)
Scatter plots of versus , where
the region indicated by the ellipse corresponds to the
mass regions of and
from the decay. Points with error bars are
data, open histograms are the MC expectation for the
signal (arbitrary normalization). The peak at GeV/ in
(a) is due to production via ISR.
We also search for the and in the
mode. We select , , and candidates in the
mode (with the requirement on the invariant
mass greater than 0.35 GeV/ removed) and a candidate
from a pair of photons with invariant mass within 10 MeV of
the nominal mass. Here the mass resolution is about
4 MeV/ from MC simulation. Figure 4(b) shows the
invariant mass distribution, where the open
histogram is the MC expectation for the signal plotted
with an arbitrary normalization. Using the same fit method as in
, we determine for the number of
signal events to be 4.2 at the 90% C.L.
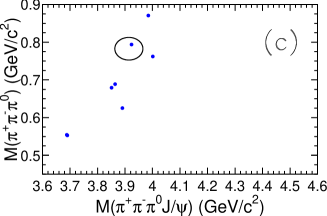
Figure 4(c) shows the scatter plot of versus from data, where the region indicated
by the ellipse corresponds to the mass regions of
and from the
decay. There is one event with at 3.923 GeV/ and at 0.790 GeV/
from data, as shown in the ellipse. Assuming that
the number of background events is zero, the upper limit for the number of signal events is 4.4 at the 90%
C.L.
We search for the and the in the
mode. The selection criteria are very similar to those in the
analysis of described above and the is
reconstructed from a pair. According to MC simulation, the
signal region is defined as
GeV/. The number of well
measured charged tracks is required to be exactly four. After
applying all of the above event selection criteria, there is no
clear or signal. Nor are there candidate events in
the or mass regions. The upper limits on the
number of and signal events are both 2.3 at
the 90% C.L.
Several sources of systematic uncertainties are considered. The
uncertainty due to particle identification efficiency is
2.4%-3.4% and depends on the final state particles. The
uncertainty in the tracking efficiency for tracks with angles and
momenta characteristic of signal events is about 0.35% per track,
and is additive. The photon reconstruction contributes an
additional 2.0% per photon. Errors on the branching fractions of
the intermediate states are taken from the PDG PDG ; they
are 6.9% for the mode, 4.5% for the mode,
4.2% for the mode, 1.7% for the mode, 17% for the mode,
1.0% for the mode, 1.3% for the
mode, and 1.6% for the mode. By using a
phase space distribution and including possible intermediate
resonant states, the largest difference of efficiency is
determined to be 2.1% for the decay modes. The difference
in the overall efficiency for a flat angular distribution of
radiative photons and a distribution is less
than 3.0%. Therefore, we quote an additional error of 5.0% due
to the limited knowledge of the decay dynamics for all the states
studied, except for the mode and mode, which
are known to follow a distribution. According to MC
simulation, the trigger efficiency is 89% for the mode,
rather high for other modes (); we take a 3.0% error
for the mode and 1.0% error for other modes as a
conservative estimate of the corresponding uncertainties. With the
pure or
() samples obtained from Belle data,
the uncertainty due to the recoil mass squared requirement is
1.0% for the channels with a single photon and 4.7% for channels
with two photons. By changing the order of the background
polynomial, the range of the fit, and the values of the masses and
widths of the resonances, uncertainties on the and
signal yields are estimated to be 1.1% and 16%,
respectively. In the mode, the uncertainty
associated with the requirement on the number of photons is 2.0%
after applying a correction factor of 0.94 to the MC efficiency,
which is determined from a study of a very pure
event sample. In the mode, the uncertainty in
the selection efficiency is determined by a study on a
large sample of high momentum decays; the
efficiency difference between data and MC simulation is less than
4.9% ks-error . Finally, the uncertainty on the total
number of events is 2.3%. Assuming that all of these
systematic error sources are independent, we add them in
quadrature to obtain a total systematic error as shown in
Table 1.
Since there is no evidence for signals in the modes studied, we
determine upper limits on the branching fractions of
radiative decays. Table 1 lists the upper limits
for the number of signal events, detection
efficiencies, systematic errors, and final results for the upper
limits on the branching fractions. In order to calculate
conservative upper limits on these branching fractions, the
efficiencies are lowered by a factor of in
the calculation.
Table 1: Summary of the limits on radiative decays to
charmonium and charmonium-like states . Here is
the upper limit on the number of signal events, is the
efficiency with the secondary decay branching fractions excluded
and trigger efficiency included, is the total
systematic error, and () is the upper limit at the 90% C.L. on the decay branching
fraction in the charmonium state case, and on the product
branching fraction in the case of a charmonium-like state.
State ()
(%)
(%)
2.8
14.2
10.9
3.1
14.8
10.8
7.6
15.2
10.7
44
26.3
24
3.6
27.3
7.4
4.2
10.3
9.6
4.4
10.5
9.6
2.3
22.3
7.4
2.3
21.0
7.4
To summarize, we find no significant signals for the or
, as well as for the , , , or
in radiative decays.
The results obtained on the and production
rates are consistent with the theoretical predictions
of ktchao .
We thank the KEKB group for excellent operation of the
accelerator, the KEK cryogenics group for efficient solenoid
operations, and the KEK computer group and the NII for valuable
computing and SINET4 network support. We acknowledge support from
MEXT, JSPS and Nagoya’s TLPRC (Japan); ARC and DIISR (Australia);
NSFC (China); MSMT (Czechia); DST (India); MEST, NRF, NSDC of
KISTI, and WCU (Korea); MNiSW (Poland); MES and RFAAE (Russia);
ARRS (Slovenia); SNSF (Switzerland); NSC and MOE (Taiwan); and DOE
(USA).
References
(1) For a recent review, see
N. Brambilla et al.,
Eur. Phys. J. C 71, 1534 (2011).
(2) J. L. Rosner et al. (CLEO Collaboration),
Phys. Rev. Lett. 95, 102003 (2005).
(3) M. Ablikim et al. (BESIII Collaboration),
Phys. Rev. Lett. 104, 132002 (2010).
(4) Y. J. Gao, Y. J. Zhang, and K. T. Chao,
hep-ph/0701009 on decays, and private communication with
K. T. Chao on decays.
(5) S. K. Choi et al. (Belle Collaboration),
Phys. Rev. Lett. 91, 262001 (2003).
(6) S. Uehara et al. (Belle Collaboration),
Phys. Rev. Lett. 104, 092001 (2010).
(7) T. Aaltonen et al. (CDF Collaboration),
Phys. Rev. Lett. 102, 242002 (2009).
(8) C. P. Shen et al. (Belle Collaboration),
Phys. Rev. D 82, 051504(R) (2010).
(9) C. P. Shen et al. (Belle Collaboration),
Phys. Rev. Lett. 104, 112004 (2010).
(10) T. Barnes, S. Godfrey, and E. S. Swanson,
Phys. Rev. D 72, 054026 (2005); Y. Jia, W. L. Sang, and J. Xu,
arXiv:1007.4541[hep-ph].
(11) A. Abashian et al. (Belle Collaboration),
Nucl. Instr. Meth. A 479, 117 (2002).
(12) S. Kurokawa and E. Kikutani,
Nucl. Instr. Meth. A 499, 1 (2003), and
other papers included in this volume.
(13)D. Besson et al. (CLEO Collaboration),
Phys. Rev. D 76, 072008 (2010).
(14) T. Sjostrand et al., Comput. Phys. Commun. 178,
852 (2008).
(15) E. Nakano, Nucl. Instr. Meth. A 494, 402 (2002).
(16) K. Hanagaki et al., Nucl. Instr. Meth.
A 485, 490 (2002).
(17) A. Abashian et al., Nucl. Instr. Meth.
A 491, 69 (2002).
(18) F. Fang, Ph.D thesis, University of Hawaii, 2003.
(19) K. Nakamura et al. (Particle Data Group),
J. Phys. G 37, 075021 (2010).
(20) C. Z. Yuan et al. (Belle Collaboration),
Phys. Rev. Lett. 99, 182004 (2007).
(21) S.-W. Lin et al. (Belle Collaboration),
Phys. Rev. Lett. 99, 121601 (2007).